Changes in PRIMAP-hist v2.5.1_final compared to v2.5_final for Lebanon
2024-02-29
Johannes Gütschow
Change analysis for Lebanon for PRIMAP-hist v2.5.1_final compared to v2.5_final
Overview over emissions by sector and gas
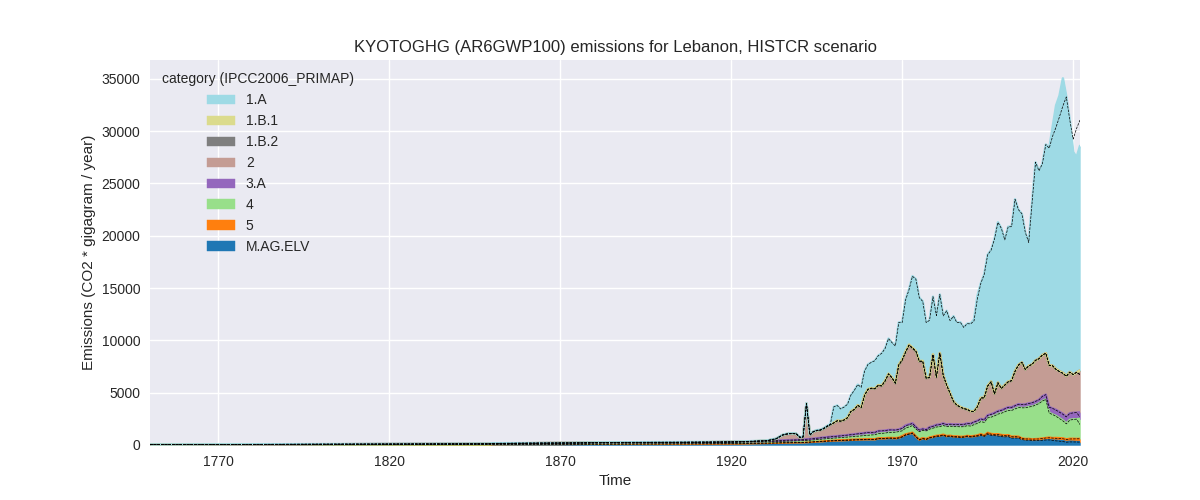
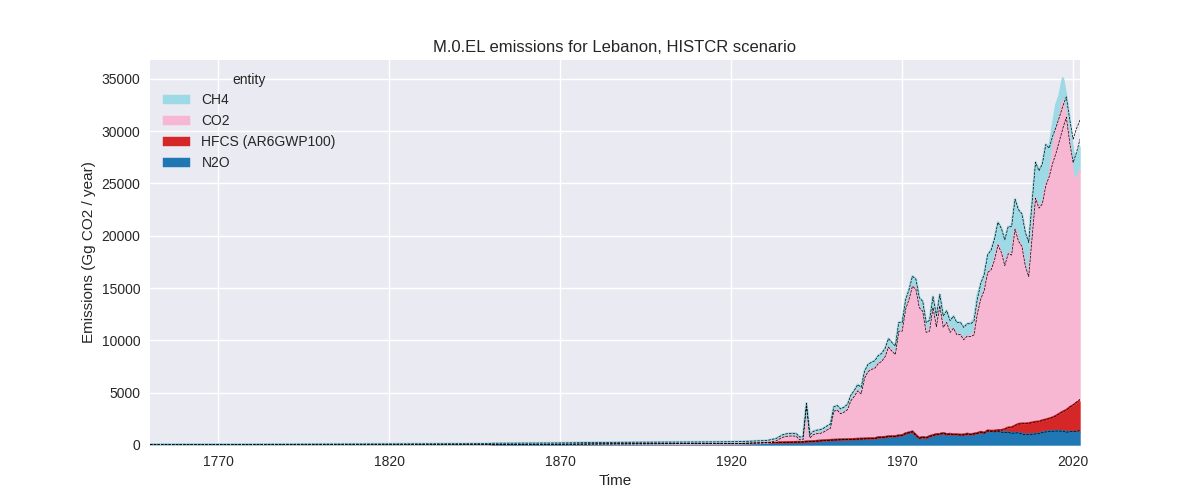
The following figures show the aggregate national total emissions excluding LULUCF AR6GWP100 for the country reported priority scenario. The dotted linesshow the v2.5_final data.

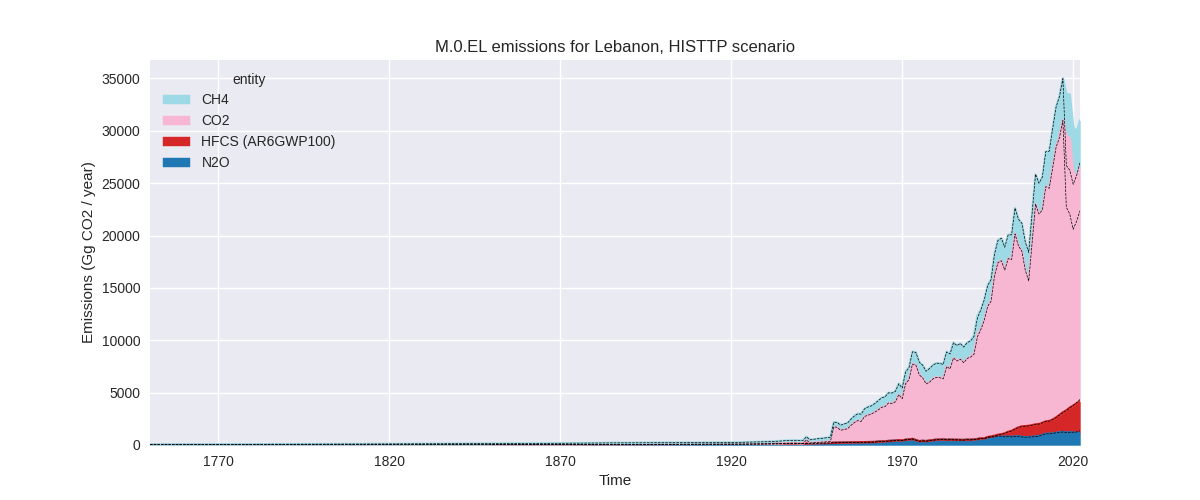
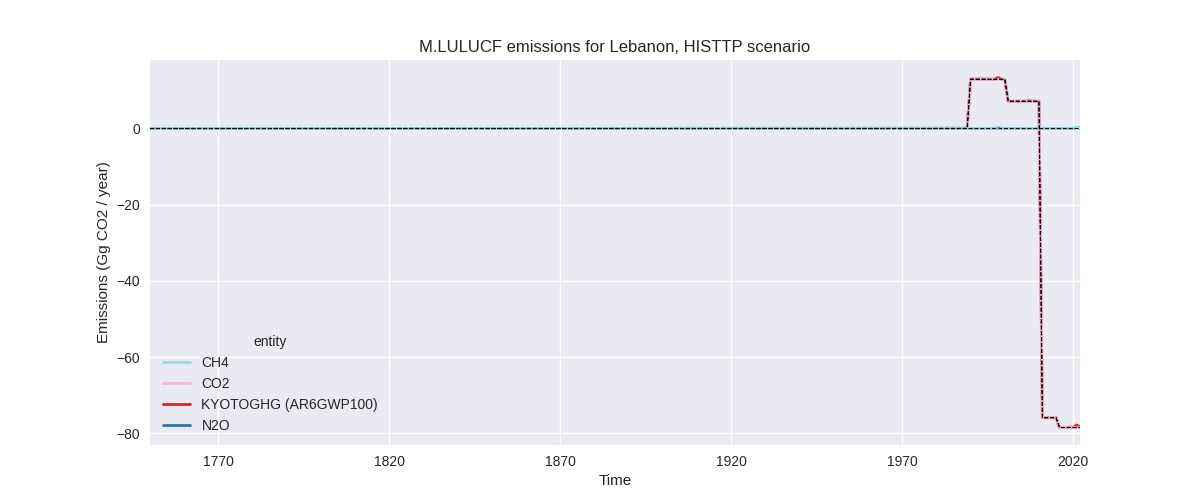
The following figures show the aggregate national total emissions excluding LULUCF AR6GWP100 for the third party priority scenario. The dotted linesshow the v2.5_final data.

Overview over changes
In the country reported priority scenario we have the following changes for aggregate Kyoto GHG and national total emissions excluding LULUCF (M.0.EL):
- Emissions in 2022 have changed by -7.9%% (-2468.05 Gg CO2 / year)
- Emissions in 1990-2022 have changed by 0.2%% (50.28 Gg CO2 / year)
In the third party priority scenario we have the following changes for aggregate Kyoto GHG and national total emissions excluding LULUCF (M.0.EL):
- Emissions in 2022 have changed by 15.0%% (4039.55 Gg CO2 / year)
- Emissions in 1990-2022 have changed by 3.9%% (851.28 Gg CO2 / year)
Most important changes per scenario and time frame
In the country reported priority scenario the following sector-gas combinations have the highest absolute impact on national total KyotoGHG (AR6GWP100) emissions in 2022 (top 5):
- 1: 1.A, CO2 with -2816.36 Gg CO2 / year (-11.7%)
- 2: 4, CH4 with 556.38 Gg CO2 / year (47.6%)
- 3: 3.A, CH4 with -71.81 Gg CO2 / year (-12.6%)
- 4: 1.A, N2O with -45.23 Gg CO2 / year (-22.7%)
- 5: 2, N2O with -44.03 Gg CO2 / year (-15.4%)
In the country reported priority scenario the following sector-gas combinations have the highest absolute impact on national total KyotoGHG (AR6GWP100) emissions in 1990-2022 (top 5):
- 1: 1.A, CO2 with 37.61 Gg CO2 / year (0.2%)
- 2: 4, CH4 with 16.86 Gg CO2 / year (0.8%)
- 3: M.AG.ELV, CO2 with 10.90 Gg CO2 / year (32.9%)
- 4: 2, CO2 with -3.81 Gg CO2 / year (-0.2%)
- 5: 2, N2O with -2.80 Gg CO2 / year (-1.6%)
In the third party priority scenario the following sector-gas combinations have the highest absolute impact on national total KyotoGHG (AR6GWP100) emissions in 2022 (top 5):
- 1: 1.A, CO2 with 4397.40 Gg CO2 / year (25.6%)
- 2: 4, CH4 with -156.76 Gg CO2 / year (-3.8%)
- 3: M.AG.ELV, N2O with -106.14 Gg CO2 / year (-19.9%)
- 4: 2, N2O with -44.03 Gg CO2 / year (-15.4%)
- 5: 1.A, N2O with -28.49 Gg CO2 / year (-24.7%)
In the third party priority scenario the following sector-gas combinations have the highest absolute impact on national total KyotoGHG (AR6GWP100) emissions in 1990-2022 (top 5):
- 1: 1.A, CO2 with 865.42 Gg CO2 / year (5.6%)
- 2: M.AG.ELV, CO2 with 10.90 Gg CO2 / year (32.9%)
- 3: 1.B.2, CH4 with -6.37 Gg CO2 / year (-62.4%)
- 4: 4, CH4 with -4.75 Gg CO2 / year (-0.2%)
- 5: M.AG.ELV, N2O with -4.23 Gg CO2 / year (-1.1%)
Notes on data changes
Here we list notes explaining important emissions changes for the country. ’' means that the following text only applies to the TP time series, while means that it only applies to the CR scenario. Otherwise the note applies to both scenarios.
- 1.A, CO2: The regional EI data used in PRIMAP-hist 2.5 shows a very steep decline in 2018 which is less pronounced in CDIAC 2023 data leading to higher emissions in the last years. /CR/ The different growth rates of CDIAC 2023 and EI 2023 data lead to lower emissions in the last year after harmonization with country reported data.
- 4, CH4: EDGAR 8.0 growth rates have replaced numerical extrapolation for 2022 leading to changes in 2022 emissions for CR and TP time-series.
- M.AG.ELV, N2O: FAO emissions have changed for the latest years and a decline in 2021 has been added leading to lower emissions in the latest years.
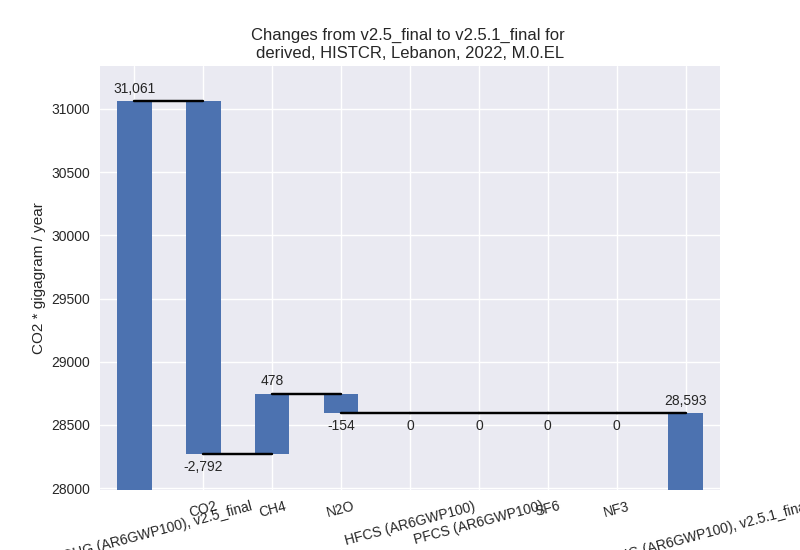
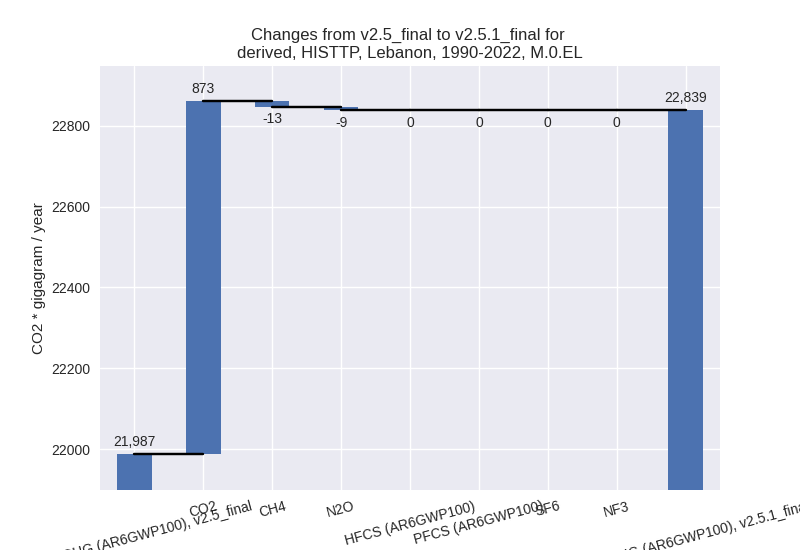
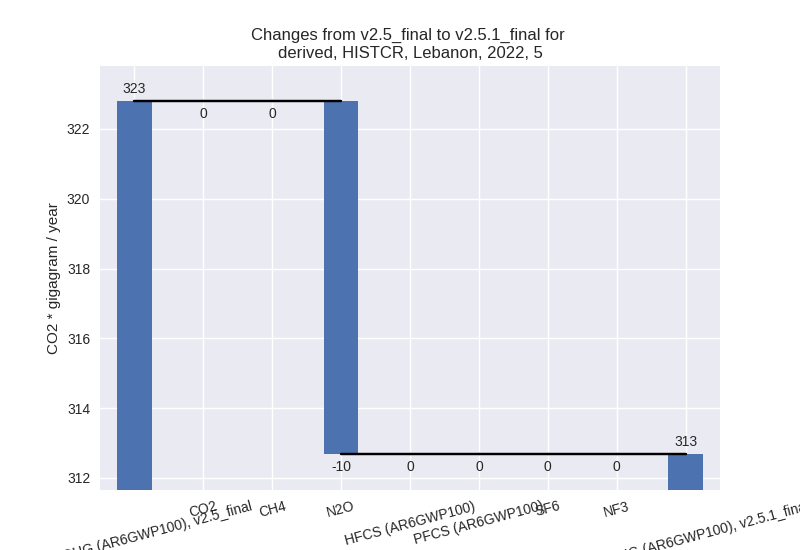
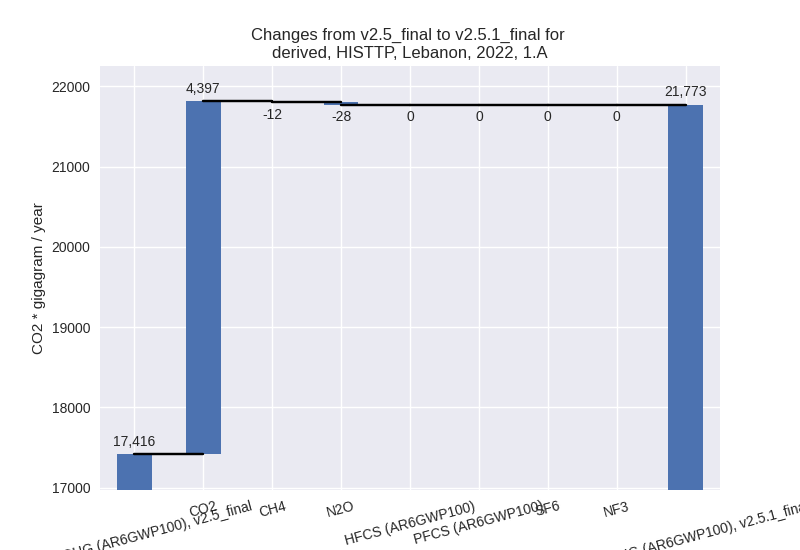
Changes by sector and gas
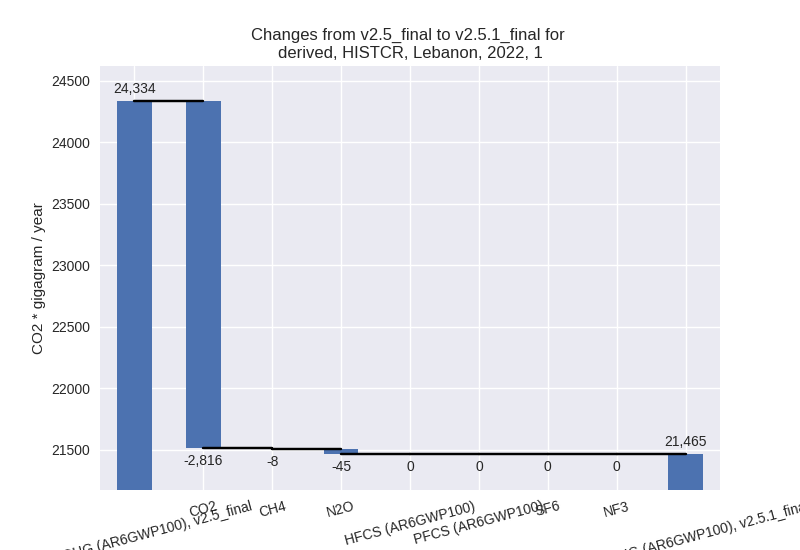
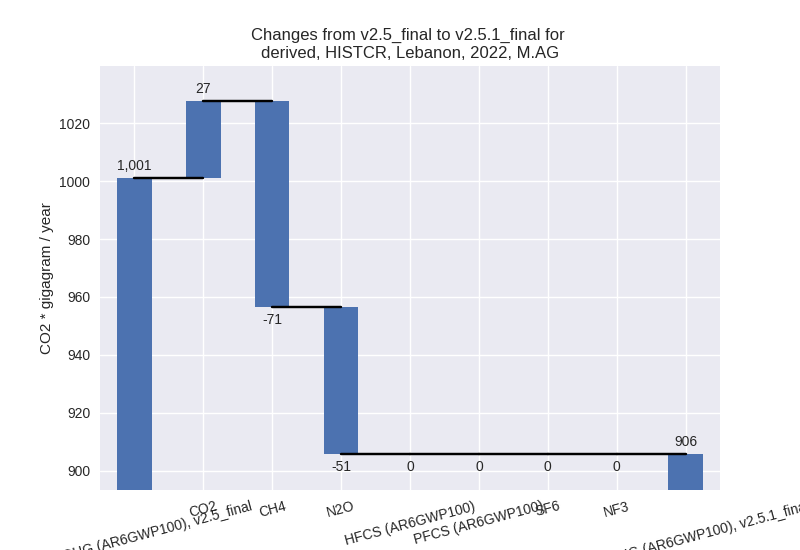
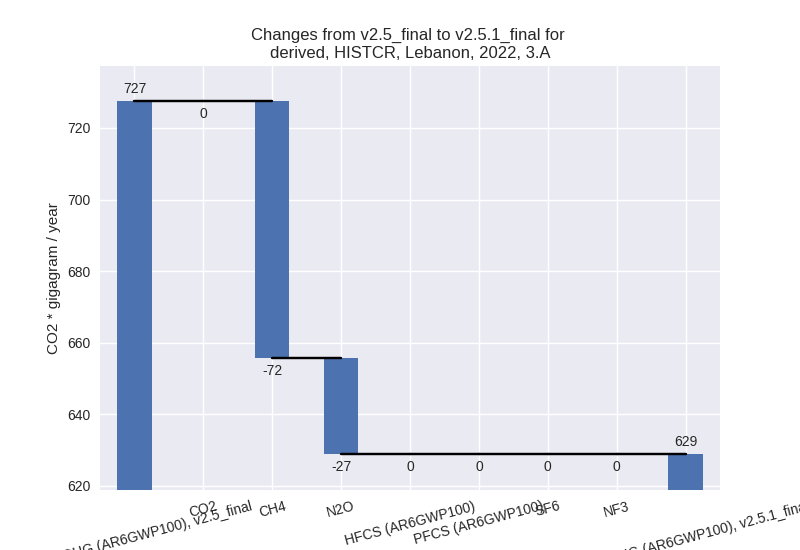
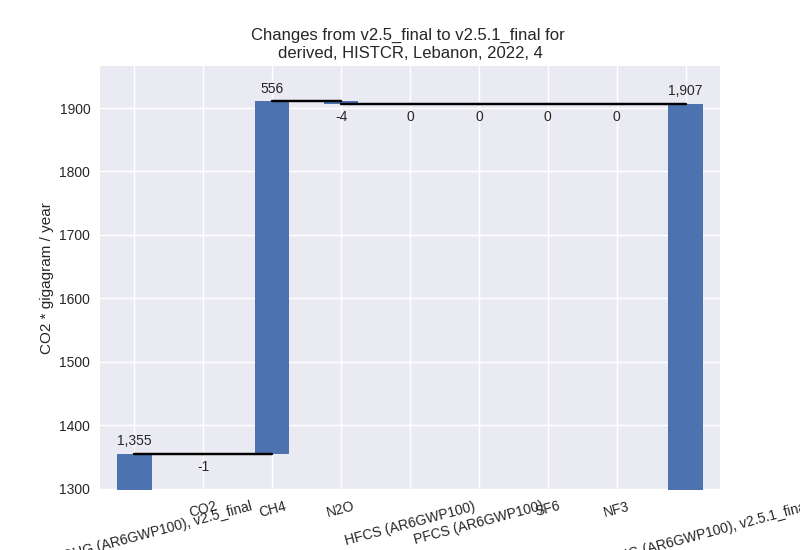
For each scenario and time frame the changes are displayed for all individual sectors and all individual gases. In the sector plot we use aggregate Kyoto GHGs in AR6GWP100. In the gas plot we usenational total emissions without LULUCF. ## country reported scenario
2022

1990-2022
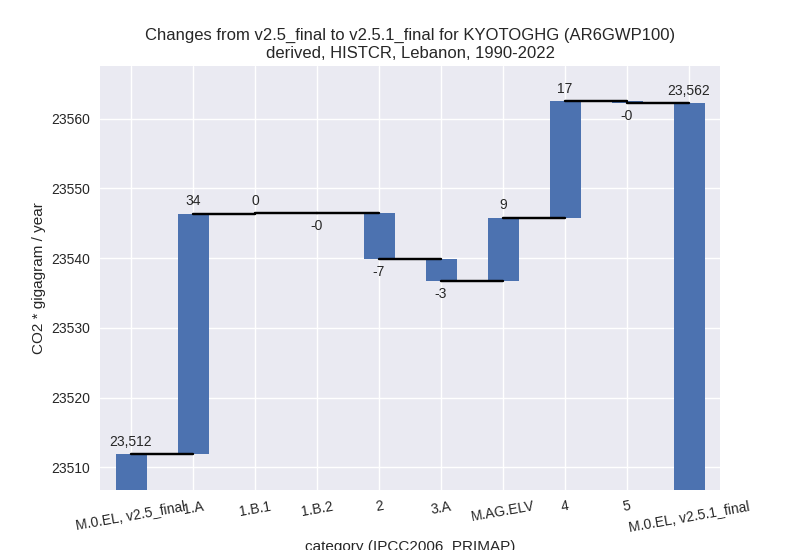
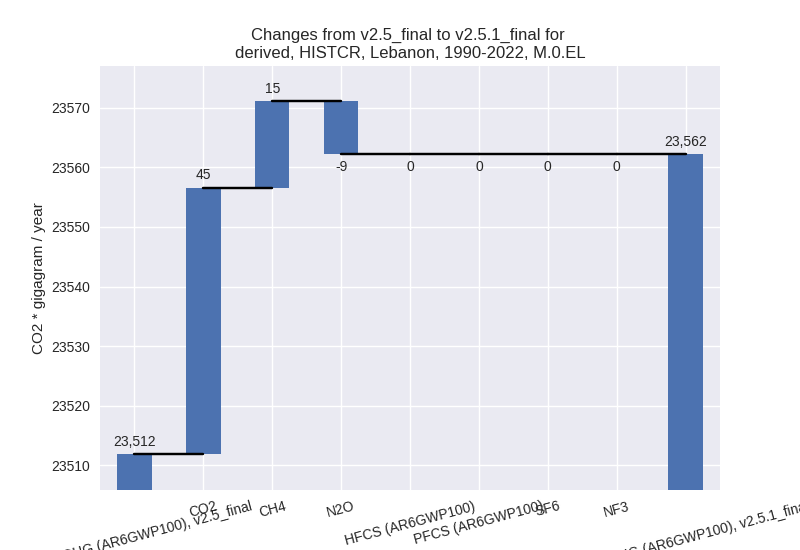
third party scenario
2022


1990-2022

Detailed changes for the scenarios:
country reported scenario (HISTCR):
Most important changes per time frame
For 2022 the following sector-gas combinations have the highest absolute impact on national total KyotoGHG (AR6GWP100) emissions in 2022 (top 5):
- 1: 1.A, CO2 with -2816.36 Gg CO2 / year (-11.7%)
- 2: 4, CH4 with 556.38 Gg CO2 / year (47.6%)
- 3: 3.A, CH4 with -71.81 Gg CO2 / year (-12.6%)
- 4: 1.A, N2O with -45.23 Gg CO2 / year (-22.7%)
- 5: 2, N2O with -44.03 Gg CO2 / year (-15.4%)
For 1990-2022 the following sector-gas combinations have the highest absolute impact on national total KyotoGHG (AR6GWP100) emissions in 1990-2022 (top 5):
- 1: 1.A, CO2 with 37.61 Gg CO2 / year (0.2%)
- 2: 4, CH4 with 16.86 Gg CO2 / year (0.8%)
- 3: M.AG.ELV, CO2 with 10.90 Gg CO2 / year (32.9%)
- 4: 2, CO2 with -3.81 Gg CO2 / year (-0.2%)
- 5: 2, N2O with -2.80 Gg CO2 / year (-1.6%)
Changes in the main sectors for aggregate KyotoGHG (AR6GWP100) are
- 1: Total sectoral emissions in 2022 are 21465.07 Gg
CO2 / year which is 75.1% of M.0.EL emissions. 2022 Emissions have
changed by -11.8% (-2869.32 Gg CO2 /
year). 1990-2022 Emissions have changed by 0.2% (34.58 Gg CO2 / year). For 2022 the
changes per gas
are:
The changes come from the following subsectors:- 1.A: Total sectoral emissions in 2022 are 21456.97
Gg CO2 / year which is 100.0% of category 1 emissions. 2022 Emissions
have changed by -11.8% (-2872.20 Gg
CO2 / year). 1990-2022 Emissions have changed by 0.2% (34.49 Gg CO2 / year). For 2022 the
changes per gas
are:

There is no subsector information available in PRIMAP-hist. - 1.B.1: Total sectoral emissions in 2022 are 8.10 Gg
CO2 / year which is 0.0% of category 1 emissions. 2022 Emissions have
changed by 55.2% (2.88 Gg CO2 /
year). 1990-2022 Emissions have changed by 0.5% (0.09 Gg CO2 / year). For 2022 the
changes per gas
are:

There is no subsector information available in PRIMAP-hist. - 1.B.2: Total sectoral emissions in 2022 are 0.00 Gg CO2 / year which is 0.0% of category 1 emissions. 2022 Emissions have changed by 0.0% (0.00 Gg CO2 / year). 1990-2022 Emissions have changed by -0.0% (-0.00 Gg CO2 / year).
- 1.A: Total sectoral emissions in 2022 are 21456.97
Gg CO2 / year which is 100.0% of category 1 emissions. 2022 Emissions
have changed by -11.8% (-2872.20 Gg
CO2 / year). 1990-2022 Emissions have changed by 0.2% (34.49 Gg CO2 / year). For 2022 the
changes per gas
are:
- 2: Total sectoral emissions in 2022 are 4002.20 Gg CO2 / year which is 14.0% of M.0.EL emissions. 2022 Emissions have changed by -1.1% (-45.03 Gg CO2 / year). 1990-2022 Emissions have changed by -0.2% (-6.61 Gg CO2 / year).
- M.AG: Total sectoral emissions in 2022 are 905.65
Gg CO2 / year which is 3.2% of M.0.EL emissions. 2022 Emissions have
changed by -9.5% (-95.40 Gg CO2 /
year). 1990-2022 Emissions have changed by 0.6% (5.90 Gg CO2 / year). For 2022 the
changes per gas
are:
The changes come from the following subsectors:- 3.A: Total sectoral emissions in 2022 are 628.81 Gg
CO2 / year which is 69.4% of category M.AG emissions. 2022 Emissions
have changed by -13.6% (-98.64 Gg
CO2 / year). 1990-2022 Emissions have changed by -0.8% (-3.12 Gg CO2 / year). For 2022 the
changes per gas
are:
There is no subsector information available in PRIMAP-hist. - M.AG.ELV: Total sectoral emissions in 2022 are 276.84 Gg CO2 / year which is 30.6% of category M.AG emissions. 2022 Emissions have changed by 1.2% (3.24 Gg CO2 / year). 1990-2022 Emissions have changed by 1.5% (9.02 Gg CO2 / year).
- 3.A: Total sectoral emissions in 2022 are 628.81 Gg
CO2 / year which is 69.4% of category M.AG emissions. 2022 Emissions
have changed by -13.6% (-98.64 Gg
CO2 / year). 1990-2022 Emissions have changed by -0.8% (-3.12 Gg CO2 / year). For 2022 the
changes per gas
are:
- 4: Total sectoral emissions in 2022 are 1906.97 Gg
CO2 / year which is 6.7% of M.0.EL emissions. 2022 Emissions have
changed by 40.7% (551.82 Gg CO2 /
year). 1990-2022 Emissions have changed by 0.8% (16.72 Gg CO2 / year). For 2022 the
changes per gas
are:
- 5: Total sectoral emissions in 2022 are 312.68 Gg
CO2 / year which is 1.1% of M.0.EL emissions. 2022 Emissions have
changed by -3.1% (-10.11 Gg CO2 /
year). 1990-2022 Emissions have changed by -0.2% (-0.31 Gg CO2 / year). For 2022 the
changes per gas
are:
third party scenario (HISTTP):
Most important changes per time frame
For 2022 the following sector-gas combinations have the highest absolute impact on national total KyotoGHG (AR6GWP100) emissions in 2022 (top 5):
- 1: 1.A, CO2 with 4397.40 Gg CO2 / year (25.6%)
- 2: 4, CH4 with -156.76 Gg CO2 / year (-3.8%)
- 3: M.AG.ELV, N2O with -106.14 Gg CO2 / year (-19.9%)
- 4: 2, N2O with -44.03 Gg CO2 / year (-15.4%)
- 5: 1.A, N2O with -28.49 Gg CO2 / year (-24.7%)
For 1990-2022 the following sector-gas combinations have the highest absolute impact on national total KyotoGHG (AR6GWP100) emissions in 1990-2022 (top 5):
- 1: 1.A, CO2 with 865.42 Gg CO2 / year (5.6%)
- 2: M.AG.ELV, CO2 with 10.90 Gg CO2 / year (32.9%)
- 3: 1.B.2, CH4 with -6.37 Gg CO2 / year (-62.4%)
- 4: 4, CH4 with -4.75 Gg CO2 / year (-0.2%)
- 5: M.AG.ELV, N2O with -4.23 Gg CO2 / year (-1.1%)
Changes in the main sectors for aggregate KyotoGHG (AR6GWP100) are
- 1: Total sectoral emissions in 2022 are 21786.43 Gg
CO2 / year which is 70.3% of M.0.EL emissions. 2022 Emissions have
changed by 24.9% (4347.97 Gg CO2 /
year). 1990-2022 Emissions have changed by 5.4% (856.39 Gg CO2 / year). For 2022 the
changes per gas
are:

For 1990-2022 the changes per gas are: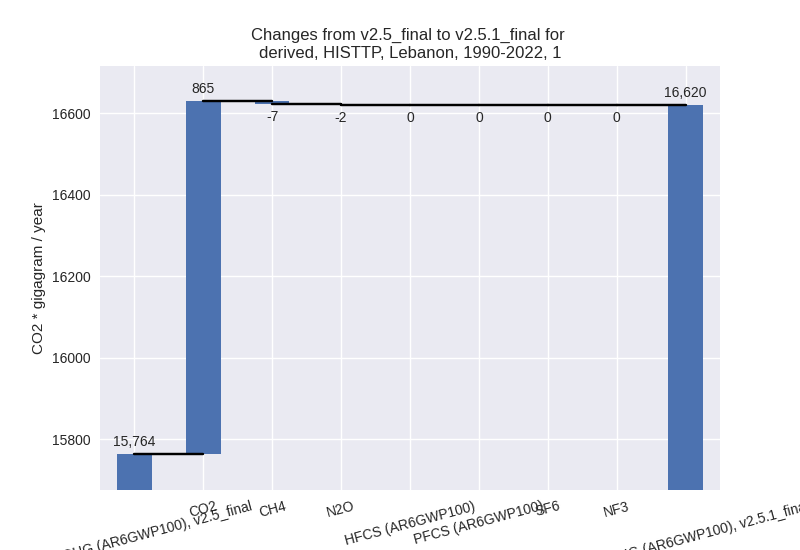
The changes come from the following subsectors:- 1.A: Total sectoral emissions in 2022 are 21772.63
Gg CO2 / year which is 99.9% of category 1 emissions. 2022 Emissions
have changed by 25.0% (4357.07 Gg
CO2 / year). 1990-2022 Emissions have changed by 5.5% (862.68 Gg CO2 / year). For 2022 the
changes per gas
are:
For 1990-2022 the changes per gas are: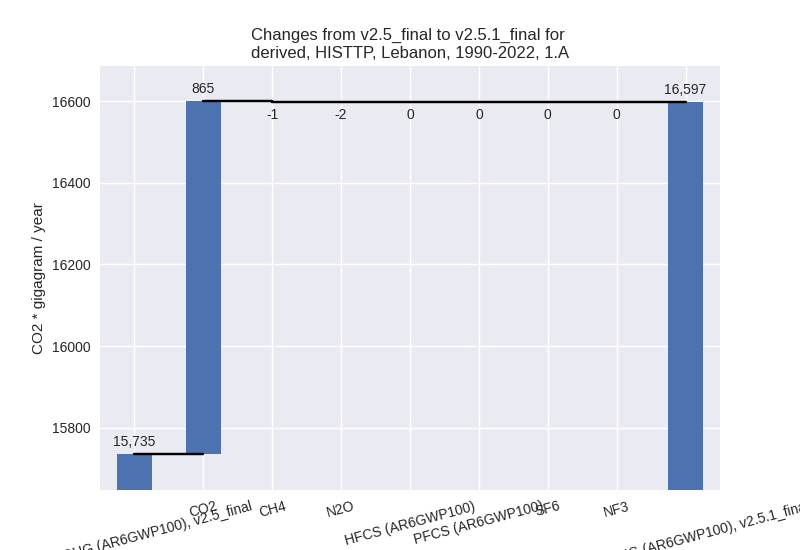
There is no subsector information available in PRIMAP-hist. - 1.B.1: Total sectoral emissions in 2022 are 8.10 Gg
CO2 / year which is 0.0% of category 1 emissions. 2022 Emissions have
changed by 55.2% (2.88 Gg CO2 /
year). 1990-2022 Emissions have changed by 0.5% (0.09 Gg CO2 / year). For 2022 the
changes per gas
are:
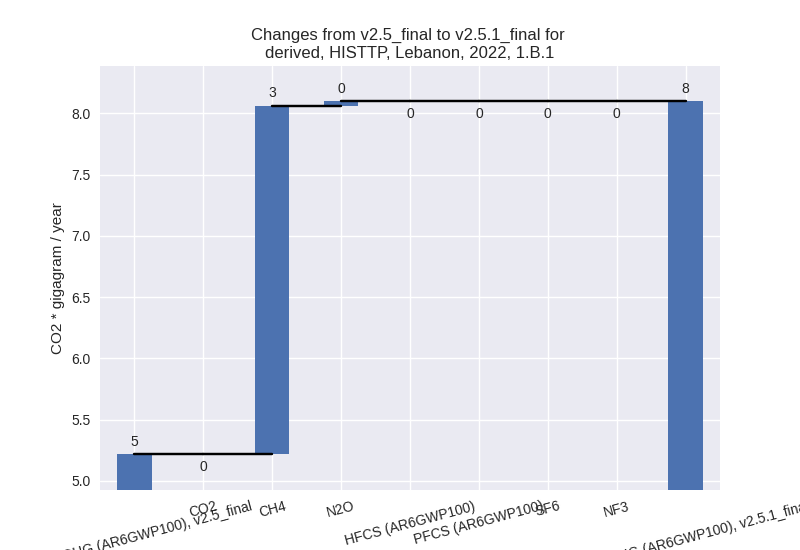
There is no subsector information available in PRIMAP-hist. - 1.B.2: Total sectoral emissions in 2022 are 5.71 Gg
CO2 / year which is 0.0% of category 1 emissions. 2022 Emissions have
changed by -67.7% (-11.98 Gg CO2 /
year). 1990-2022 Emissions have changed by -62.4% (-6.37 Gg CO2 / year). For 2022 the
changes per gas
are:
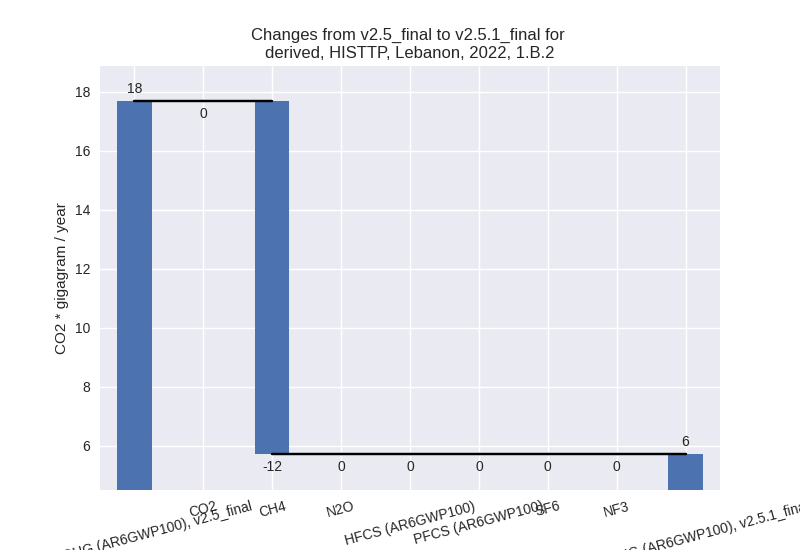
For 1990-2022 the changes per gas are:
There is no subsector information available in PRIMAP-hist.
- 1.A: Total sectoral emissions in 2022 are 21772.63
Gg CO2 / year which is 99.9% of category 1 emissions. 2022 Emissions
have changed by 25.0% (4357.07 Gg
CO2 / year). 1990-2022 Emissions have changed by 5.5% (862.68 Gg CO2 / year). For 2022 the
changes per gas
are:
- 2: Total sectoral emissions in 2022 are 4044.22 Gg CO2 / year which is 13.1% of M.0.EL emissions. 2022 Emissions have changed by -0.9% (-38.43 Gg CO2 / year). 1990-2022 Emissions have changed by -0.2% (-5.87 Gg CO2 / year).
- M.AG: Total sectoral emissions in 2022 are 750.03
Gg CO2 / year which is 2.4% of M.0.EL emissions. 2022 Emissions have
changed by -11.8% (-100.45 Gg CO2 /
year). 1990-2022 Emissions have changed by 0.9% (5.90 Gg CO2 / year). For 2022 the
changes per gas
are:
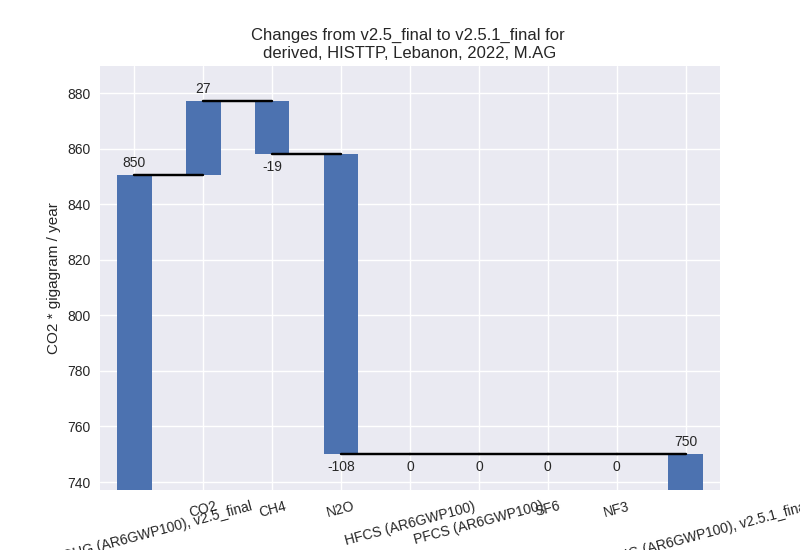
The changes come from the following subsectors:- 3.A: Total sectoral emissions in 2022 are 288.43 Gg
CO2 / year which is 38.5% of category M.AG emissions. 2022 Emissions
have changed by -6.9% (-21.25 Gg CO2
/ year). 1990-2022 Emissions have changed by -0.3% (-0.79 Gg CO2 / year). For 2022 the
changes per gas
are:
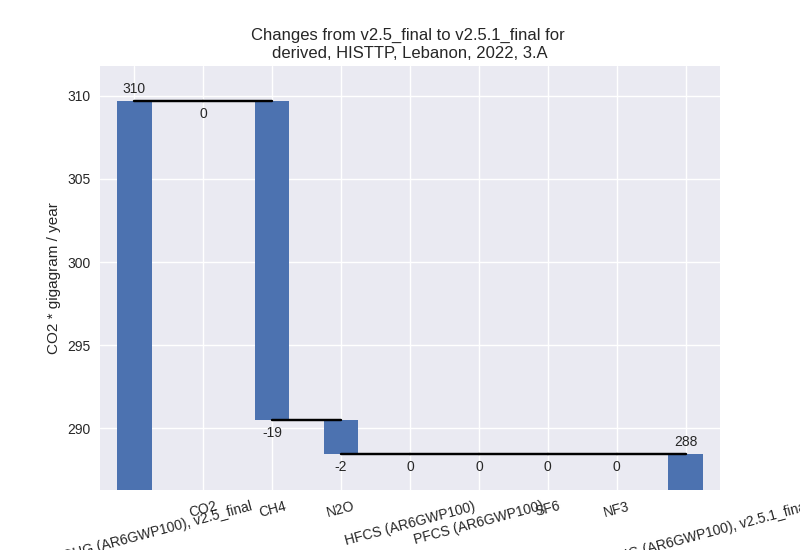
There is no subsector information available in PRIMAP-hist. - M.AG.ELV: Total sectoral emissions in 2022 are
461.60 Gg CO2 / year which is 61.5% of category M.AG emissions. 2022
Emissions have changed by -14.6%
(-79.20 Gg CO2 / year). 1990-2022 Emissions have changed by 1.6% (6.69 Gg CO2 / year). For 2022 the
changes per gas
are:

There is no subsector information available in PRIMAP-hist.
- 3.A: Total sectoral emissions in 2022 are 288.43 Gg
CO2 / year which is 38.5% of category M.AG emissions. 2022 Emissions
have changed by -6.9% (-21.25 Gg CO2
/ year). 1990-2022 Emissions have changed by -0.3% (-0.79 Gg CO2 / year). For 2022 the
changes per gas
are:
- 4: Total sectoral emissions in 2022 are 4096.44 Gg
CO2 / year which is 13.2% of M.0.EL emissions. 2022 Emissions have
changed by -3.7% (-159.43 Gg CO2 /
year). 1990-2022 Emissions have changed by -0.2% (-4.83 Gg CO2 / year). For 2022 the
changes per gas
are:

- 5: Total sectoral emissions in 2022 are 312.68 Gg
CO2 / year which is 1.0% of M.0.EL emissions. 2022 Emissions have
changed by -3.1% (-10.11 Gg CO2 /
year). 1990-2022 Emissions have changed by -0.2% (-0.31 Gg CO2 / year). For 2022 the
changes per gas
are:
