Changes in PRIMAP-hist v2.5.1_final compared to v2.5_final for Libya
2024-02-29
Johannes Gütschow
Change analysis for Libya for PRIMAP-hist v2.5.1_final compared to v2.5_final
Overview over emissions by sector and gas
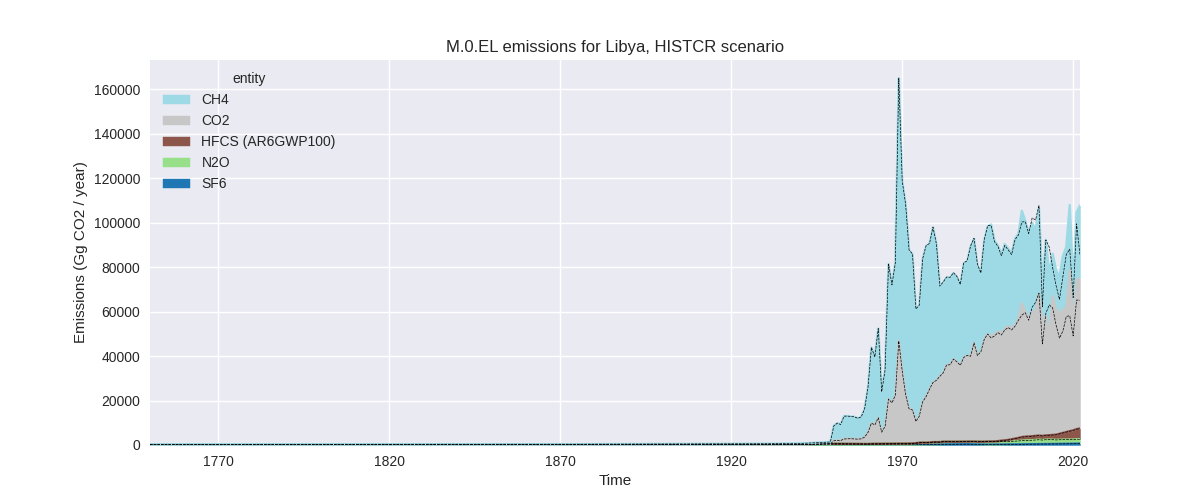
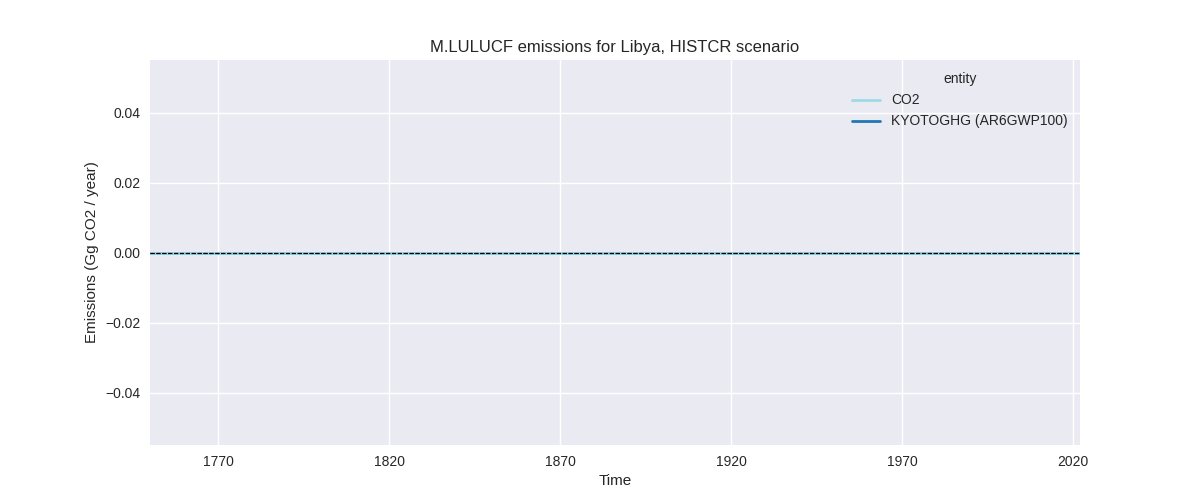
The following figures show the aggregate national total emissions excluding LULUCF AR6GWP100 for the country reported priority scenario. The dotted linesshow the v2.5_final data.

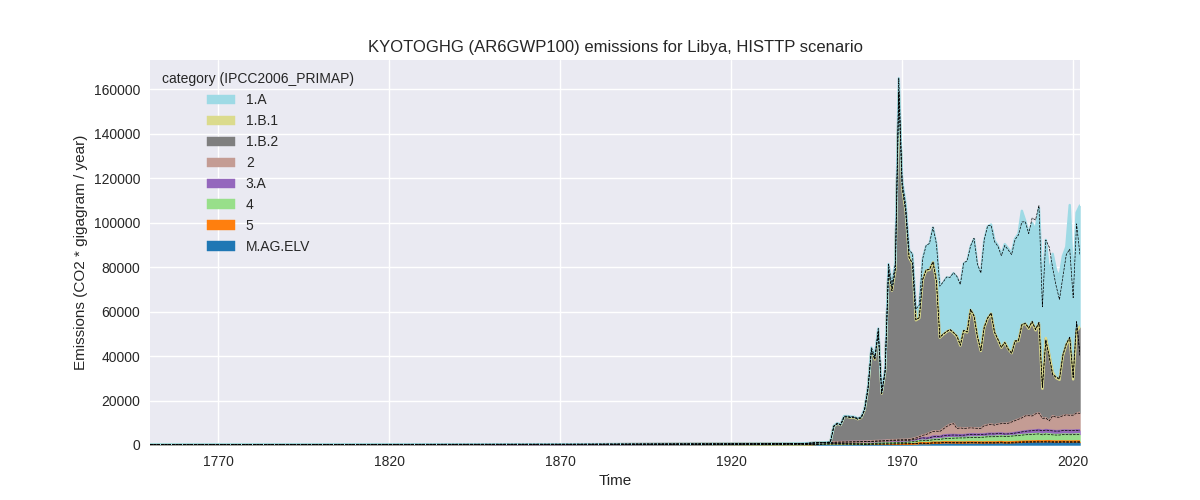
The following figures show the aggregate national total emissions excluding LULUCF AR6GWP100 for the third party priority scenario. The dotted linesshow the v2.5_final data.


Overview over changes
In the country reported priority scenario we have the following changes for aggregate Kyoto GHG and national total emissions excluding LULUCF (M.0.EL):
- Emissions in 2022 have changed by 26.3%% (22392.64 Gg CO2 / year)
- Emissions in 1990-2022 have changed by 2.9%% (2569.57 Gg CO2 / year)
In the third party priority scenario we have the following changes for aggregate Kyoto GHG and national total emissions excluding LULUCF (M.0.EL):
- Emissions in 2022 have changed by 26.3%% (22392.64 Gg CO2 / year)
- Emissions in 1990-2022 have changed by 2.9%% (2569.57 Gg CO2 / year)
Most important changes per scenario and time frame
In the country reported priority scenario the following sector-gas combinations have the highest absolute impact on national total KyotoGHG (AR6GWP100) emissions in 2022 (top 5):
- 1: 1.B.2, CH4 with 12522.34 Gg CO2 / year (84.2%)
- 2: 1.A, CO2 with 9489.68 Gg CO2 / year (21.4%)
- 3: 4, CH4 with 149.18 Gg CO2 / year (5.1%)
- 4: 2, CO2 with 114.37 Gg CO2 / year (4.8%)
- 5: 1.A, CH4 with 90.32 Gg CO2 / year (35.1%)
In the country reported priority scenario the following sector-gas combinations have the highest absolute impact on national total KyotoGHG (AR6GWP100) emissions in 1990-2022 (top 5):
- 1: 1.A, CO2 with 2573.37 Gg CO2 / year (6.3%)
- 2: 2, CO2 with -98.18 Gg CO2 / year (-2.8%)
- 3: 1.B.2, CH4 with 75.40 Gg CO2 / year (0.3%)
- 4: M.AG.ELV, CO2 with 14.83 Gg CO2 / year (42.3%)
- 5: 1.A, CH4 with 5.15 Gg CO2 / year (1.4%)
In the third party priority scenario the following sector-gas combinations have the highest absolute impact on national total KyotoGHG (AR6GWP100) emissions in 2022 (top 5):
- 1: 1.B.2, CH4 with 12522.34 Gg CO2 / year (84.2%)
- 2: 1.A, CO2 with 9489.68 Gg CO2 / year (21.4%)
- 3: 4, CH4 with 149.18 Gg CO2 / year (5.1%)
- 4: 2, CO2 with 114.37 Gg CO2 / year (4.8%)
- 5: 1.A, CH4 with 90.32 Gg CO2 / year (35.1%)
In the third party priority scenario the following sector-gas combinations have the highest absolute impact on national total KyotoGHG (AR6GWP100) emissions in 1990-2022 (top 5):
- 1: 1.A, CO2 with 2573.37 Gg CO2 / year (6.3%)
- 2: 2, CO2 with -98.18 Gg CO2 / year (-2.8%)
- 3: 1.B.2, CH4 with 75.40 Gg CO2 / year (0.3%)
- 4: M.AG.ELV, CO2 with 14.83 Gg CO2 / year (42.3%)
- 5: 1.A, CH4 with 5.15 Gg CO2 / year (1.4%)
Notes on data changes
Here we list notes explaining important emissions changes for the country. ’' means that the following text only applies to the TP time series, while means that it only applies to the CR scenario. Otherwise the note applies to both scenarios.
General note: We have no country reported data for Libya, thus the CR and TP time-series are identical.
- 1.A, CO2: The reason for the changes is that CDIAC 2023 differs from CDIAC 2020 used in v2.5 starting in the 1990ties and especially since 2010.
- 1.B.2, CH4: The changes in 2022 emissions are due to differences between the 2022 data in EDGAR 8.0 and the 2022 data that was obtained from EDGAR 7.0 using extrapolation.
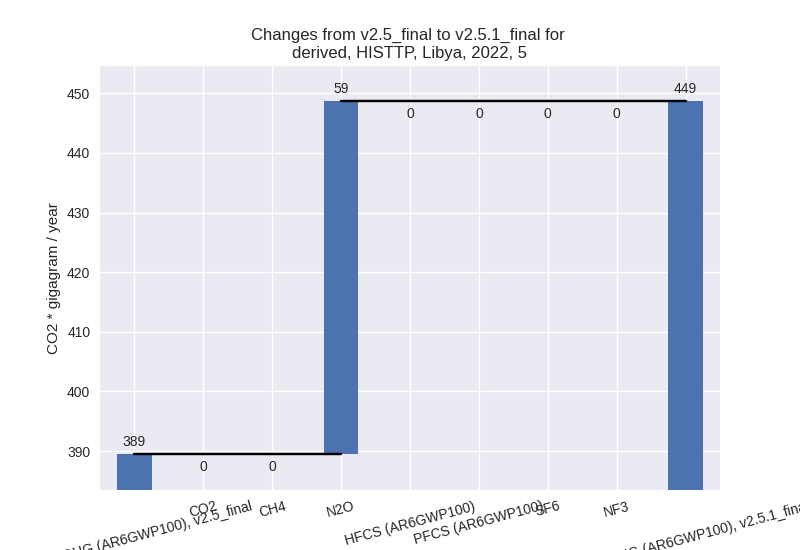
Changes by sector and gas
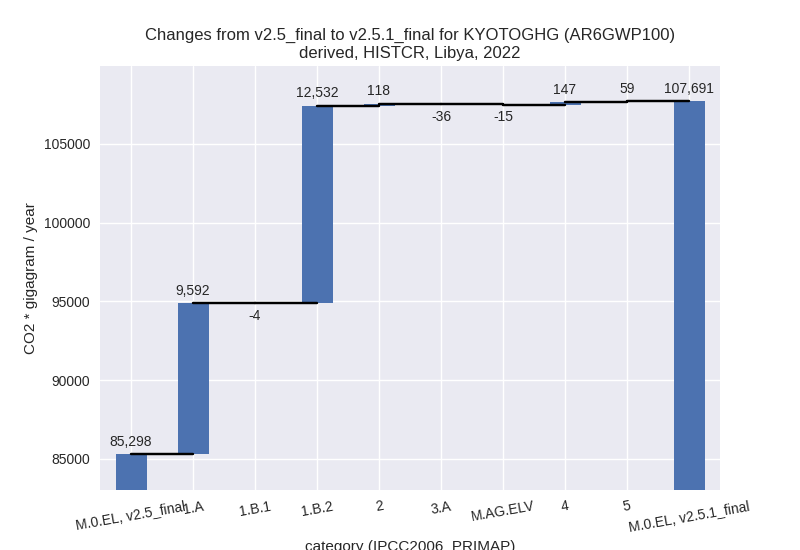
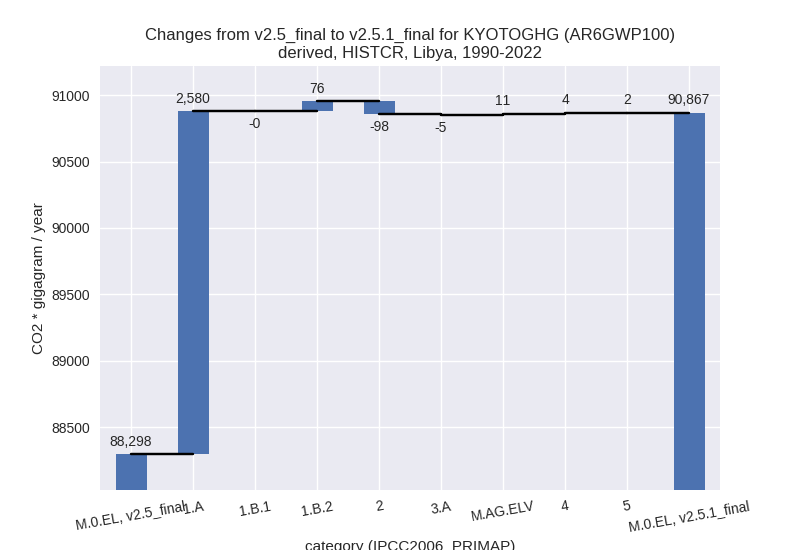
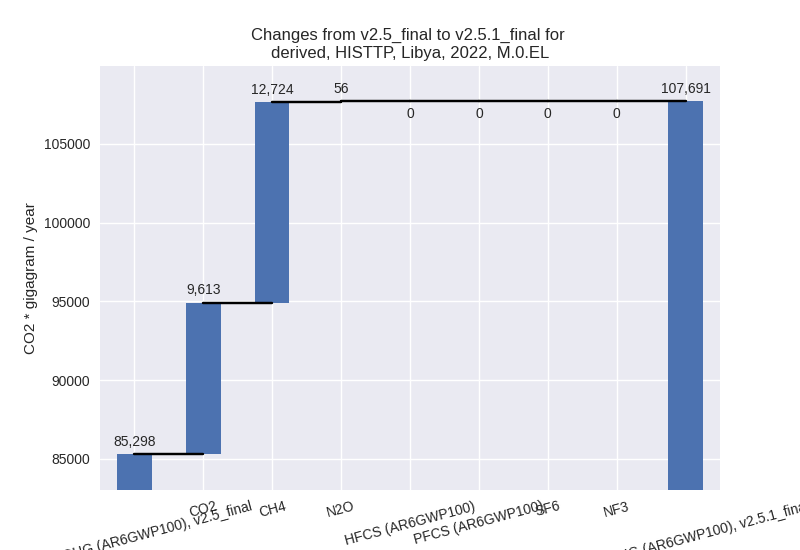
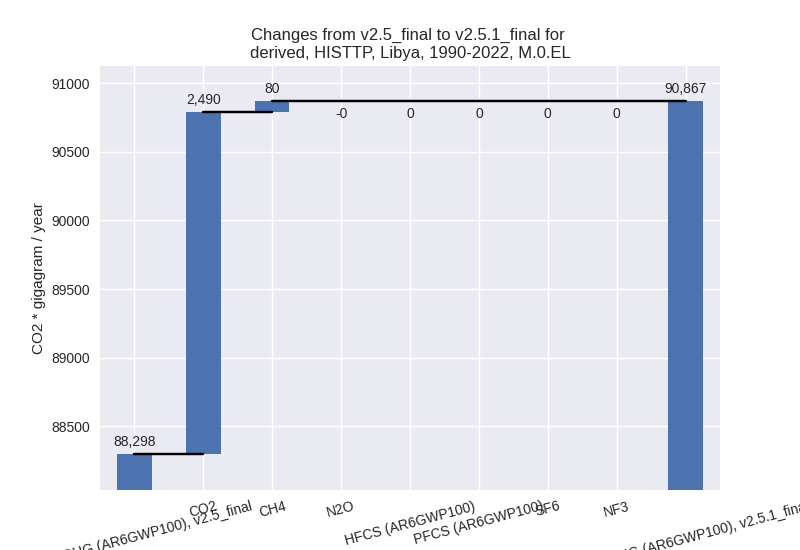
For each scenario and time frame the changes are displayed for all individual sectors and all individual gases. In the sector plot we use aggregate Kyoto GHGs in AR6GWP100. In the gas plot we usenational total emissions without LULUCF. ## country reported scenario
2022

1990-2022

third party scenario
2022

1990-2022

Detailed changes for the scenarios:
country reported scenario (HISTCR):
Most important changes per time frame
For 2022 the following sector-gas combinations have the highest absolute impact on national total KyotoGHG (AR6GWP100) emissions in 2022 (top 5):
- 1: 1.B.2, CH4 with 12522.34 Gg CO2 / year (84.2%)
- 2: 1.A, CO2 with 9489.68 Gg CO2 / year (21.4%)
- 3: 4, CH4 with 149.18 Gg CO2 / year (5.1%)
- 4: 2, CO2 with 114.37 Gg CO2 / year (4.8%)
- 5: 1.A, CH4 with 90.32 Gg CO2 / year (35.1%)
For 1990-2022 the following sector-gas combinations have the highest absolute impact on national total KyotoGHG (AR6GWP100) emissions in 1990-2022 (top 5):
- 1: 1.A, CO2 with 2573.37 Gg CO2 / year (6.3%)
- 2: 2, CO2 with -98.18 Gg CO2 / year (-2.8%)
- 3: 1.B.2, CH4 with 75.40 Gg CO2 / year (0.3%)
- 4: M.AG.ELV, CO2 with 14.83 Gg CO2 / year (42.3%)
- 5: 1.A, CH4 with 5.15 Gg CO2 / year (1.4%)
Changes in the main sectors for aggregate KyotoGHG (AR6GWP100) are
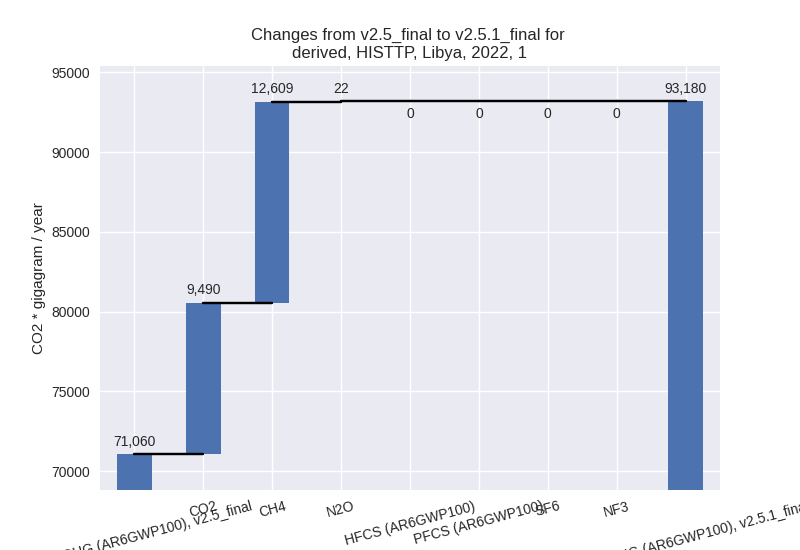
- 1: Total sectoral emissions in 2022 are 93180.09 Gg
CO2 / year which is 86.5% of M.0.EL emissions. 2022 Emissions have
changed by 31.1% (22120.33 Gg CO2 /
year). 1990-2022 Emissions have changed by 3.4% (2655.37 Gg CO2 / year). For 2022 the
changes per gas
are:

For 1990-2022 the changes per gas are:
The changes come from the following subsectors:- 1.A: Total sectoral emissions in 2022 are 54420.39
Gg CO2 / year which is 58.4% of category 1 emissions. 2022 Emissions
have changed by 21.4% (9592.17 Gg
CO2 / year). 1990-2022 Emissions have changed by 6.2% (2579.71 Gg CO2 / year). For 2022 the
changes per gas
are:
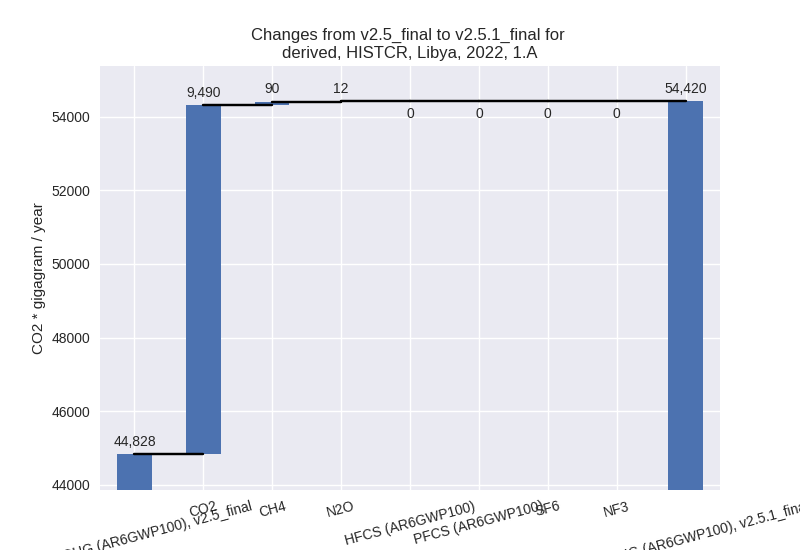
For 1990-2022 the changes per gas are:
There is no subsector information available in PRIMAP-hist. - 1.B.1: Total sectoral emissions in 2022 are 317.84 Gg CO2 / year which is 0.3% of category 1 emissions. 2022 Emissions have changed by -1.1% (-3.57 Gg CO2 / year). 1990-2022 Emissions have changed by -0.0% (-0.01 Gg CO2 / year).
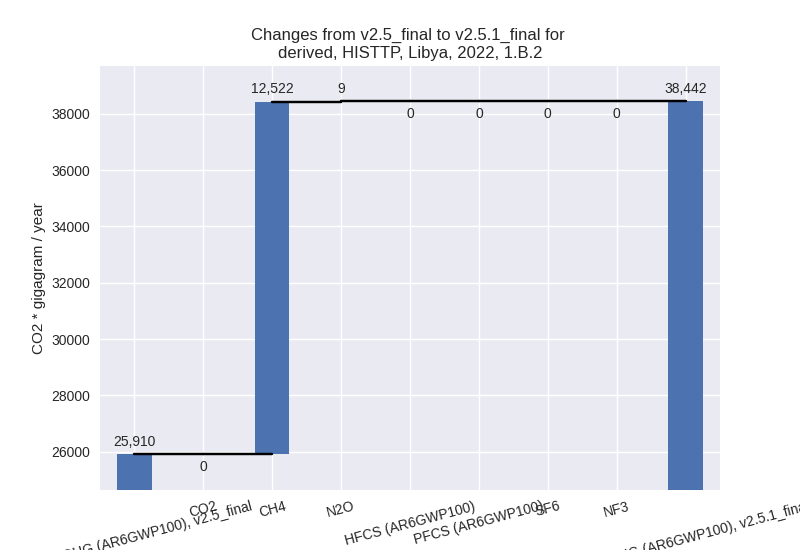
- 1.B.2: Total sectoral emissions in 2022 are
38441.86 Gg CO2 / year which is 41.3% of category 1 emissions. 2022
Emissions have changed by 48.4%
(12531.74 Gg CO2 / year). 1990-2022 Emissions have changed by 0.2% (75.67 Gg CO2 / year). For 2022 the
changes per gas
are:

There is no subsector information available in PRIMAP-hist.
- 1.A: Total sectoral emissions in 2022 are 54420.39
Gg CO2 / year which is 58.4% of category 1 emissions. 2022 Emissions
have changed by 21.4% (9592.17 Gg
CO2 / year). 1990-2022 Emissions have changed by 6.2% (2579.71 Gg CO2 / year). For 2022 the
changes per gas
are:
- 2: Total sectoral emissions in 2022 are 7882.98 Gg CO2 / year which is 7.3% of M.0.EL emissions. 2022 Emissions have changed by 1.5% (117.77 Gg CO2 / year). 1990-2022 Emissions have changed by -1.8% (-98.07 Gg CO2 / year).
- M.AG: Total sectoral emissions in 2022 are 3012.36 Gg CO2 / year which is 2.8% of M.0.EL emissions. 2022 Emissions have changed by -1.7% (-51.31 Gg CO2 / year). 1990-2022 Emissions have changed by 0.2% (6.04 Gg CO2 / year).
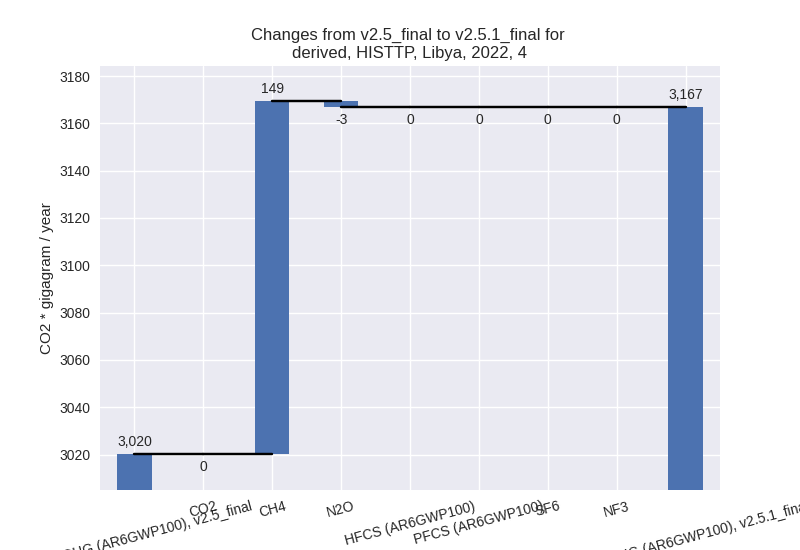
- 4: Total sectoral emissions in 2022 are 3166.81 Gg
CO2 / year which is 2.9% of M.0.EL emissions. 2022 Emissions have
changed by 4.9% (146.67 Gg CO2 /
year). 1990-2022 Emissions have changed by 0.2% (4.44 Gg CO2 / year). For 2022 the
changes per gas
are:

- 5: Total sectoral emissions in 2022 are 448.64 Gg
CO2 / year which is 0.4% of M.0.EL emissions. 2022 Emissions have
changed by 15.2% (59.16 Gg CO2 /
year). 1990-2022 Emissions have changed by 0.6% (1.79 Gg CO2 / year). For 2022 the
changes per gas
are:

third party scenario (HISTTP):
Most important changes per time frame
For 2022 the following sector-gas combinations have the highest absolute impact on national total KyotoGHG (AR6GWP100) emissions in 2022 (top 5):
- 1: 1.B.2, CH4 with 12522.34 Gg CO2 / year (84.2%)
- 2: 1.A, CO2 with 9489.68 Gg CO2 / year (21.4%)
- 3: 4, CH4 with 149.18 Gg CO2 / year (5.1%)
- 4: 2, CO2 with 114.37 Gg CO2 / year (4.8%)
- 5: 1.A, CH4 with 90.32 Gg CO2 / year (35.1%)
For 1990-2022 the following sector-gas combinations have the highest absolute impact on national total KyotoGHG (AR6GWP100) emissions in 1990-2022 (top 5):
- 1: 1.A, CO2 with 2573.37 Gg CO2 / year (6.3%)
- 2: 2, CO2 with -98.18 Gg CO2 / year (-2.8%)
- 3: 1.B.2, CH4 with 75.40 Gg CO2 / year (0.3%)
- 4: M.AG.ELV, CO2 with 14.83 Gg CO2 / year (42.3%)
- 5: 1.A, CH4 with 5.15 Gg CO2 / year (1.4%)
Changes in the main sectors for aggregate KyotoGHG (AR6GWP100) are
- 1: Total sectoral emissions in 2022 are 93180.09 Gg
CO2 / year which is 86.5% of M.0.EL emissions. 2022 Emissions have
changed by 31.1% (22120.33 Gg CO2 /
year). 1990-2022 Emissions have changed by 3.4% (2655.37 Gg CO2 / year). For 2022 the
changes per gas
are:
For 1990-2022 the changes per gas are:
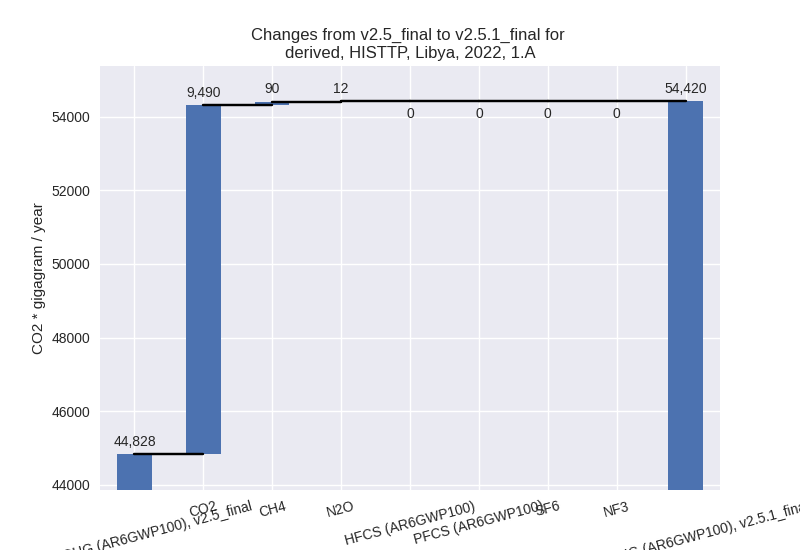
The changes come from the following subsectors:- 1.A: Total sectoral emissions in 2022 are 54420.39
Gg CO2 / year which is 58.4% of category 1 emissions. 2022 Emissions
have changed by 21.4% (9592.17 Gg
CO2 / year). 1990-2022 Emissions have changed by 6.2% (2579.71 Gg CO2 / year). For 2022 the
changes per gas
are:
For 1990-2022 the changes per gas are: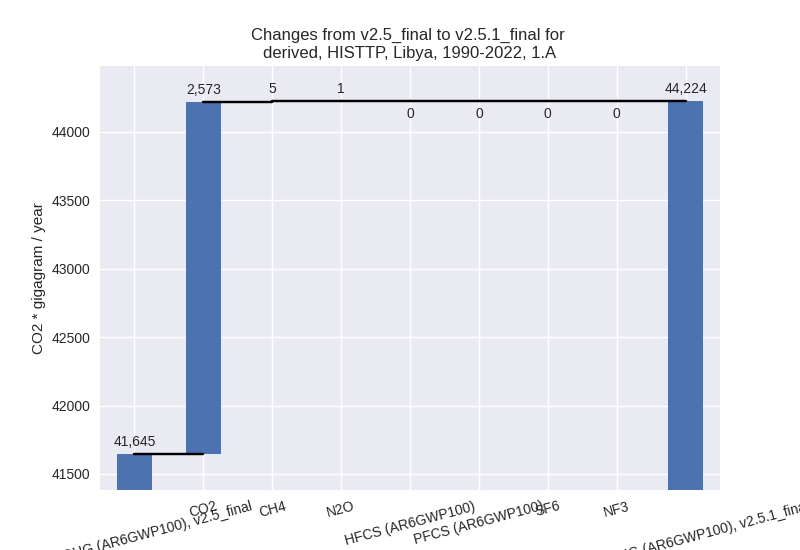
There is no subsector information available in PRIMAP-hist. - 1.B.1: Total sectoral emissions in 2022 are 317.84 Gg CO2 / year which is 0.3% of category 1 emissions. 2022 Emissions have changed by -1.1% (-3.57 Gg CO2 / year). 1990-2022 Emissions have changed by -0.0% (-0.01 Gg CO2 / year).
- 1.B.2: Total sectoral emissions in 2022 are
38441.86 Gg CO2 / year which is 41.3% of category 1 emissions. 2022
Emissions have changed by 48.4%
(12531.74 Gg CO2 / year). 1990-2022 Emissions have changed by 0.2% (75.67 Gg CO2 / year). For 2022 the
changes per gas
are:
There is no subsector information available in PRIMAP-hist.
- 1.A: Total sectoral emissions in 2022 are 54420.39
Gg CO2 / year which is 58.4% of category 1 emissions. 2022 Emissions
have changed by 21.4% (9592.17 Gg
CO2 / year). 1990-2022 Emissions have changed by 6.2% (2579.71 Gg CO2 / year). For 2022 the
changes per gas
are:
- 2: Total sectoral emissions in 2022 are 7882.98 Gg CO2 / year which is 7.3% of M.0.EL emissions. 2022 Emissions have changed by 1.5% (117.77 Gg CO2 / year). 1990-2022 Emissions have changed by -1.8% (-98.07 Gg CO2 / year).
- M.AG: Total sectoral emissions in 2022 are 3012.36 Gg CO2 / year which is 2.8% of M.0.EL emissions. 2022 Emissions have changed by -1.7% (-51.31 Gg CO2 / year). 1990-2022 Emissions have changed by 0.2% (6.04 Gg CO2 / year).
- 4: Total sectoral emissions in 2022 are 3166.81 Gg
CO2 / year which is 2.9% of M.0.EL emissions. 2022 Emissions have
changed by 4.9% (146.67 Gg CO2 /
year). 1990-2022 Emissions have changed by 0.2% (4.44 Gg CO2 / year). For 2022 the
changes per gas
are:
- 5: Total sectoral emissions in 2022 are 448.64 Gg
CO2 / year which is 0.4% of M.0.EL emissions. 2022 Emissions have
changed by 15.2% (59.16 Gg CO2 /
year). 1990-2022 Emissions have changed by 0.6% (1.79 Gg CO2 / year). For 2022 the
changes per gas
are: