Changes in PRIMAP-hist v2.5.1_final compared to v2.5_final for Saint Lucia
2024-02-29
Johannes Gütschow
Change analysis for Saint Lucia for PRIMAP-hist v2.5.1_final compared to v2.5_final
Overview over emissions by sector and gas
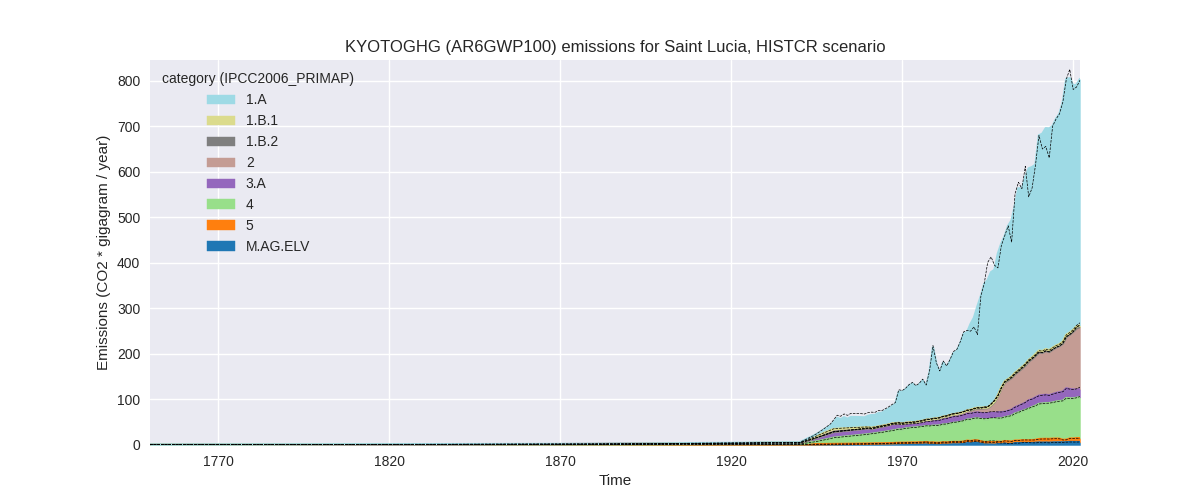
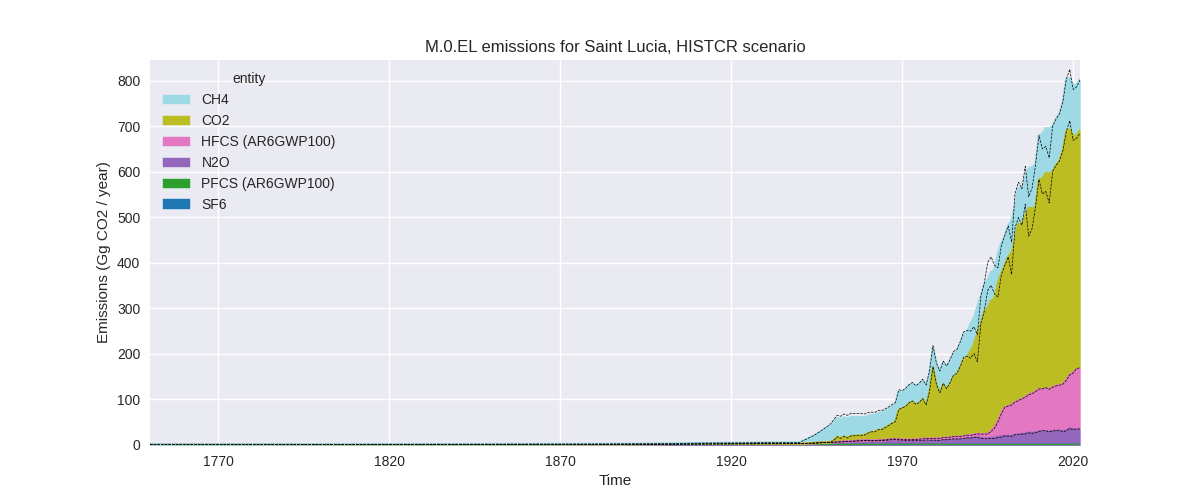
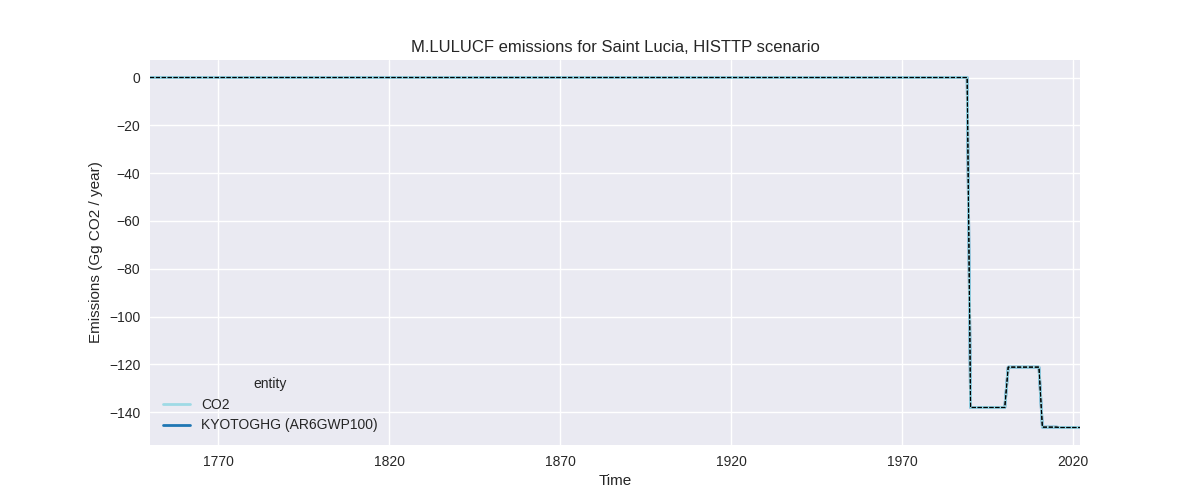
The following figures show the aggregate national total emissions excluding LULUCF AR6GWP100 for the country reported priority scenario. The dotted linesshow the v2.5_final data.
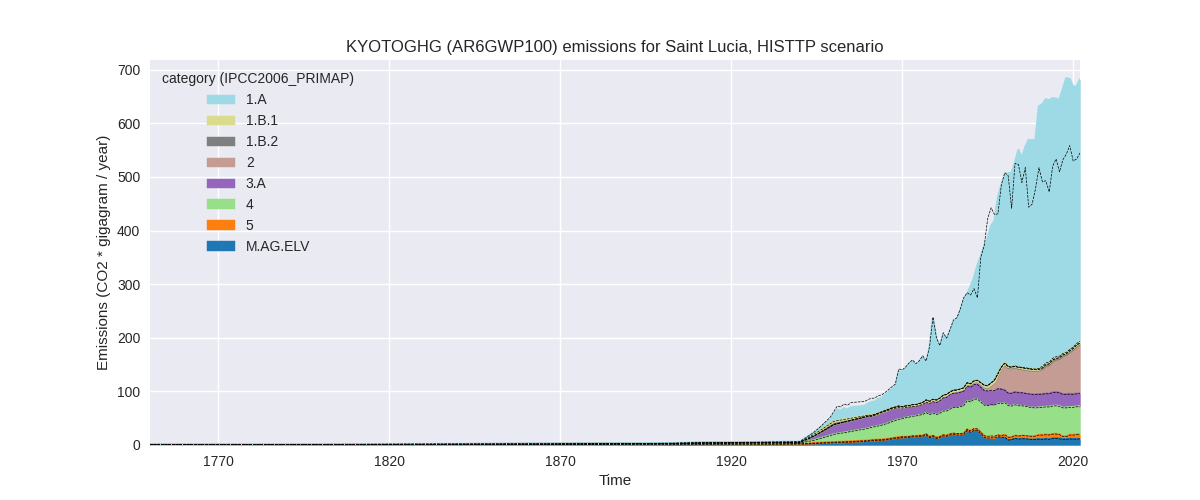
The following figures show the aggregate national total emissions excluding LULUCF AR6GWP100 for the third party priority scenario. The dotted linesshow the v2.5_final data.

Overview over changes
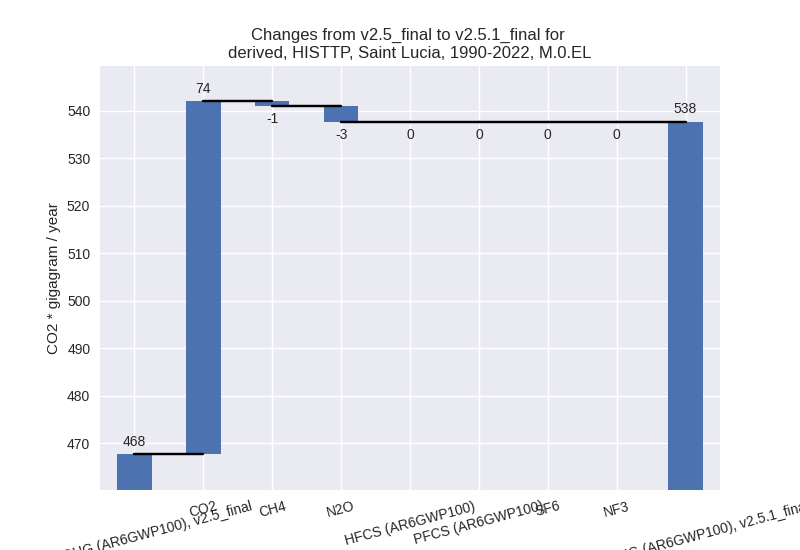
In the country reported priority scenario we have the following changes for aggregate Kyoto GHG and national total emissions excluding LULUCF (M.0.EL):
- Emissions in 2022 have changed by 0.3%% (2.31 Gg CO2 / year)
- Emissions in 1990-2022 have changed by 1.5%% (8.20 Gg CO2 / year)
In the third party priority scenario we have the following changes for aggregate Kyoto GHG and national total emissions excluding LULUCF (M.0.EL):
- Emissions in 2022 have changed by 25.1%% (136.86 Gg CO2 / year)
- Emissions in 1990-2022 have changed by 15.0%% (70.02 Gg CO2 / year)
Most important changes per scenario and time frame
In the country reported priority scenario the following sector-gas combinations have the highest absolute impact on national total KyotoGHG (AR6GWP100) emissions in 2022 (top 5):
- 1: 1.A, CO2 with 8.40 Gg CO2 / year (1.6%)
- 2: 3.A, N2O with -2.37 Gg CO2 / year (-27.3%)
- 3: 4, CH4 with -2.33 Gg CO2 / year (-2.5%)
- 4: 5, N2O with 1.12 Gg CO2 / year (14.6%)
- 5: 1.B.1, CH4 with -0.81 Gg CO2 / year (-18.6%)
In the country reported priority scenario the following sector-gas combinations have the highest absolute impact on national total KyotoGHG (AR6GWP100) emissions in 1990-2022 (top 5):
- 1: 1.A, CO2 with 8.82 Gg CO2 / year (2.3%)
- 2: M.AG.ELV, CO2 with -0.60 Gg CO2 / year (-100.0%)
- 3: 3.A, N2O with -0.13 Gg CO2 / year (-1.9%)
- 4: 1.A, N2O with 0.09 Gg CO2 / year (1.8%)
- 5: 1.A, CH4 with 0.08 Gg CO2 / year (1.5%)
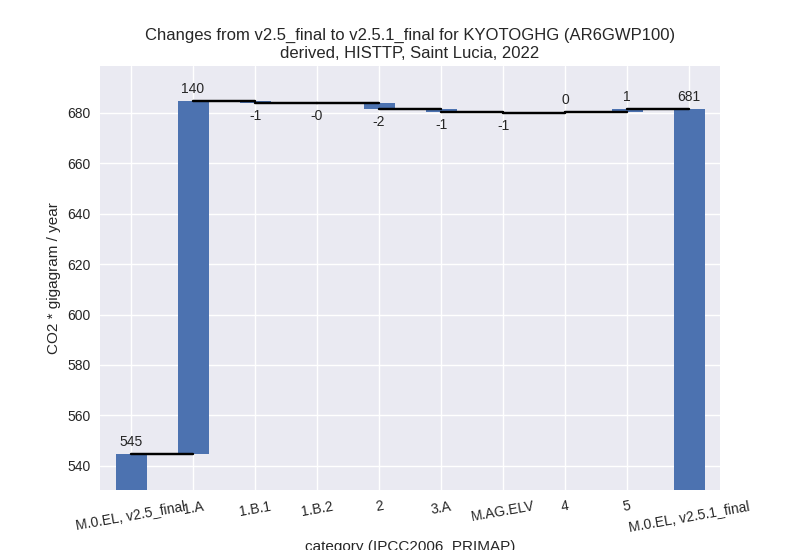
In the third party priority scenario the following sector-gas combinations have the highest absolute impact on national total KyotoGHG (AR6GWP100) emissions in 2022 (top 5):
- 1: 1.A, CO2 with 147.95 Gg CO2 / year (43.5%)
- 2: 1.A, N2O with -5.66 Gg CO2 / year (-77.8%)
- 3: 2, CO2 with -2.38 Gg CO2 / year (-59.8%)
- 4: 1.A, CH4 with -2.26 Gg CO2 / year (-57.7%)
- 5: 5, N2O with 1.12 Gg CO2 / year (14.6%)
In the third party priority scenario the following sector-gas combinations have the highest absolute impact on national total KyotoGHG (AR6GWP100) emissions in 1990-2022 (top 5):
- 1: 1.A, CO2 with 76.44 Gg CO2 / year (24.4%)
- 2: 1.A, N2O with -3.24 Gg CO2 / year (-74.6%)
- 3: 2, CO2 with -1.55 Gg CO2 / year (-62.4%)
- 4: 1.A, CH4 with -1.30 Gg CO2 / year (-47.3%)
- 5: M.AG.ELV, CO2 with -0.60 Gg CO2 / year (-100.0%)
Notes on data changes
Here we list notes explaining important emissions changes for the country. ’' means that the following text only applies to the TP time series, while means that it only applies to the CR scenario. Otherwise the note applies to both scenarios.
General note: Emissions changes are only relevant for the third party priority scenario.
- 1.A, CO2: Updated CDIAC data differ from older versions and show much higher emissions post 2000 leading to higher cumulative and 2022 emissions.
Changes by sector and gas
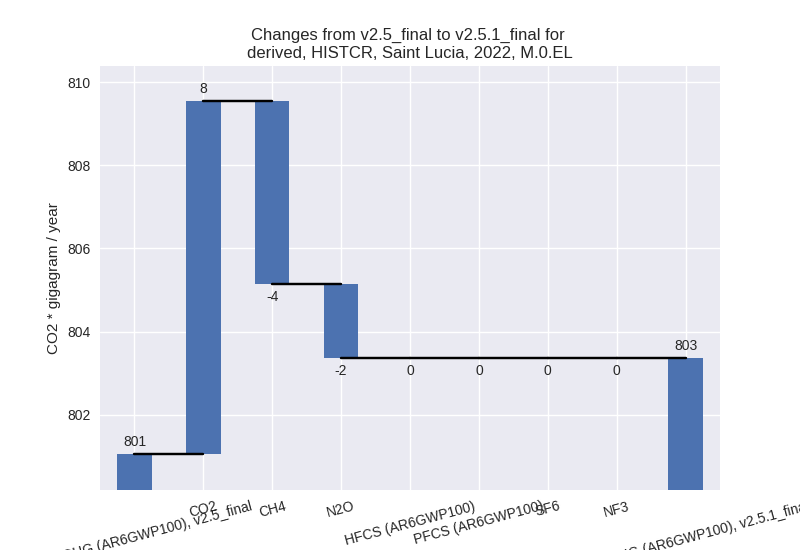
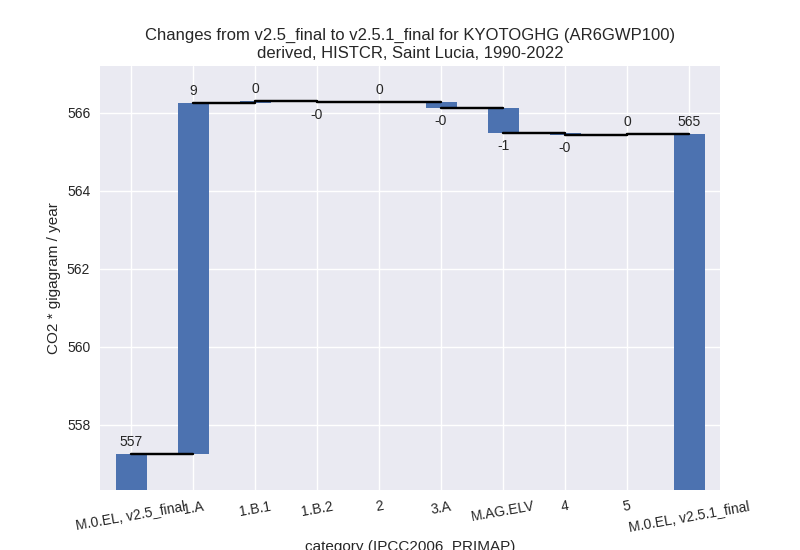
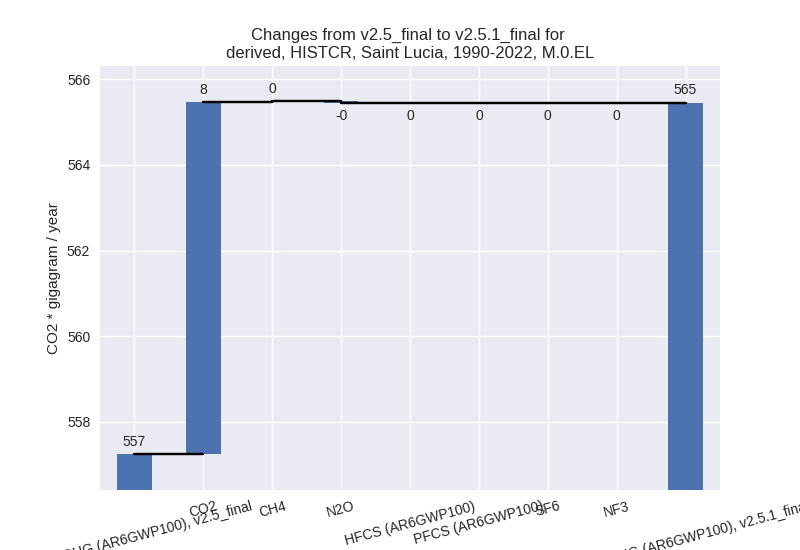
For each scenario and time frame the changes are displayed for all individual sectors and all individual gases. In the sector plot we use aggregate Kyoto GHGs in AR6GWP100. In the gas plot we usenational total emissions without LULUCF. ## country reported scenario
2022

1990-2022
third party scenario
2022

1990-2022

Detailed changes for the scenarios:
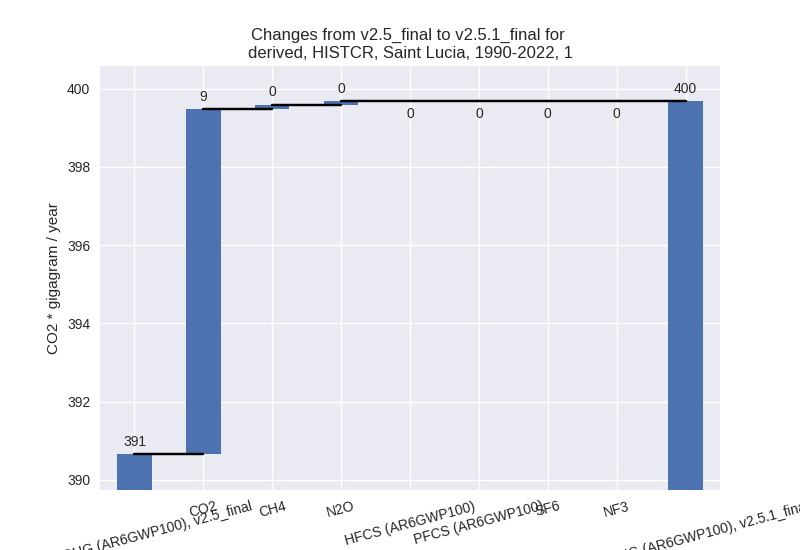
country reported scenario (HISTCR):
Most important changes per time frame
For 2022 the following sector-gas combinations have the highest absolute impact on national total KyotoGHG (AR6GWP100) emissions in 2022 (top 5):
- 1: 1.A, CO2 with 8.40 Gg CO2 / year (1.6%)
- 2: 3.A, N2O with -2.37 Gg CO2 / year (-27.3%)
- 3: 4, CH4 with -2.33 Gg CO2 / year (-2.5%)
- 4: 5, N2O with 1.12 Gg CO2 / year (14.6%)
- 5: 1.B.1, CH4 with -0.81 Gg CO2 / year (-18.6%)
For 1990-2022 the following sector-gas combinations have the highest absolute impact on national total KyotoGHG (AR6GWP100) emissions in 1990-2022 (top 5):
- 1: 1.A, CO2 with 8.82 Gg CO2 / year (2.3%)
- 2: M.AG.ELV, CO2 with -0.60 Gg CO2 / year (-100.0%)
- 3: 3.A, N2O with -0.13 Gg CO2 / year (-1.9%)
- 4: 1.A, N2O with 0.09 Gg CO2 / year (1.8%)
- 5: 1.A, CH4 with 0.08 Gg CO2 / year (1.5%)
Changes in the main sectors for aggregate KyotoGHG (AR6GWP100) are
- 1: Total sectoral emissions in 2022 are 544.21 Gg
CO2 / year which is 67.7% of M.0.EL emissions. 2022 Emissions have
changed by 1.3% (7.00 Gg CO2 /
year). 1990-2022 Emissions have changed by 2.3% (9.02 Gg CO2 / year). For 1990-2022
the changes per gas
are:
The changes come from the following subsectors:- 1.A: Total sectoral emissions in 2022 are 540.59 Gg
CO2 / year which is 99.3% of category 1 emissions. 2022 Emissions have
changed by 1.5% (7.86 Gg CO2 /
year). 1990-2022 Emissions have changed by 2.3% (8.99 Gg CO2 / year). For 1990-2022
the changes per gas
are:

There is no subsector information available in PRIMAP-hist. - 1.B.1: Total sectoral emissions in 2022 are 3.60 Gg
CO2 / year which is 0.7% of category 1 emissions. 2022 Emissions have
changed by -18.6% (-0.82 Gg CO2 /
year). 1990-2022 Emissions have changed by 2.1% (0.06 Gg CO2 / year). For 2022 the
changes per gas
are:

For 1990-2022 the changes per gas are:
There is no subsector information available in PRIMAP-hist. - 1.B.2: Total sectoral emissions in 2022 are 0.02 Gg
CO2 / year which is 0.0% of category 1 emissions. 2022 Emissions have
changed by -61.3% (-0.03 Gg CO2 /
year). 1990-2022 Emissions have changed by -62.0% (-0.03 Gg CO2 / year). For 2022 the
changes per gas
are:

For 1990-2022 the changes per gas are: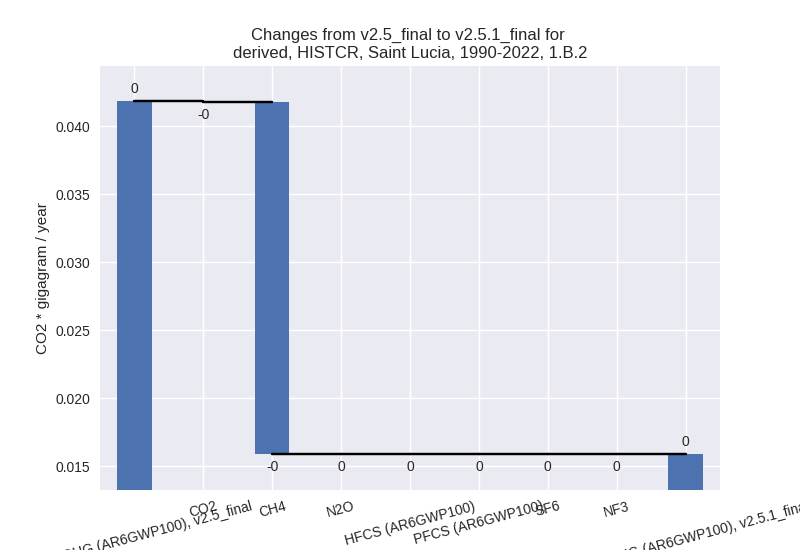
There is no subsector information available in PRIMAP-hist.
- 1.A: Total sectoral emissions in 2022 are 540.59 Gg
CO2 / year which is 99.3% of category 1 emissions. 2022 Emissions have
changed by 1.5% (7.86 Gg CO2 /
year). 1990-2022 Emissions have changed by 2.3% (8.99 Gg CO2 / year). For 1990-2022
the changes per gas
are:
- 2: Total sectoral emissions in 2022 are 136.94 Gg CO2 / year which is 17.0% of M.0.EL emissions. 2022 Emissions have changed by 0.0% (0.04 Gg CO2 / year). 1990-2022 Emissions have changed by 0.0% (0.00 Gg CO2 / year).
- M.AG: Total sectoral emissions in 2022 are 23.76 Gg
CO2 / year which is 3.0% of M.0.EL emissions. 2022 Emissions have
changed by -12.9% (-3.52 Gg CO2 /
year). 1990-2022 Emissions have changed by -3.6% (-0.78 Gg CO2 / year). For 2022 the
changes per gas
are:

For 1990-2022 the changes per gas are: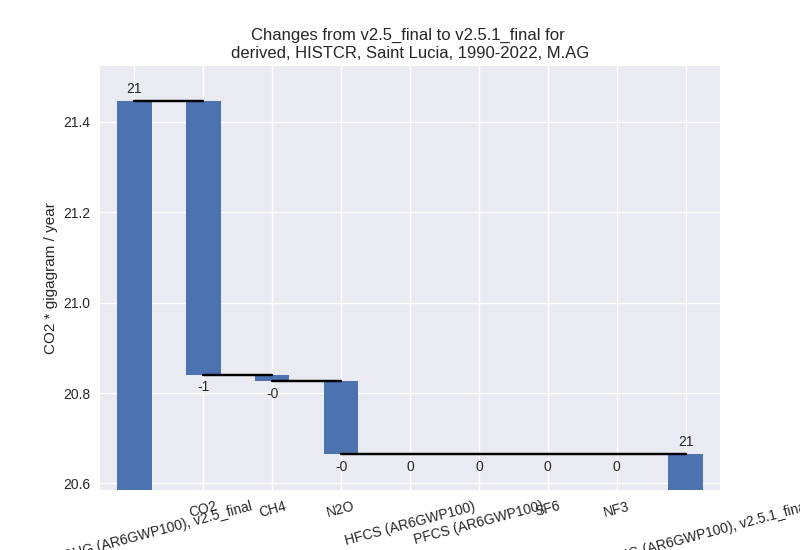
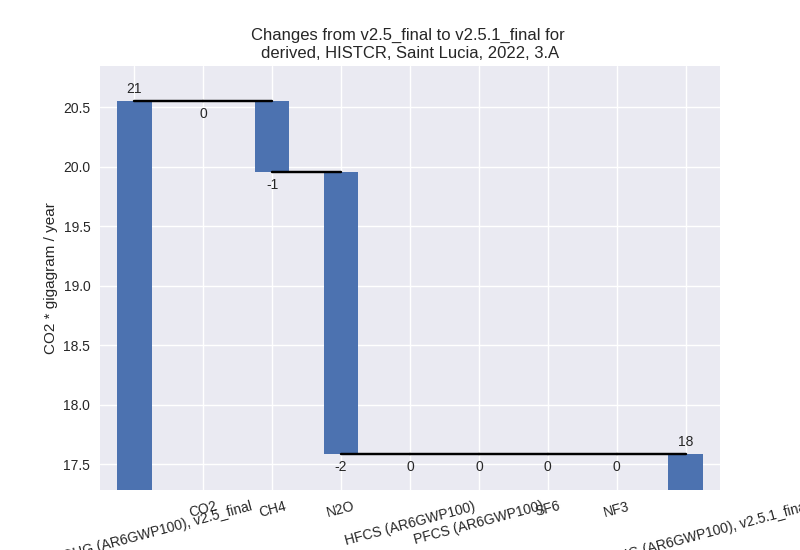
The changes come from the following subsectors:- 3.A: Total sectoral emissions in 2022 are 17.59 Gg
CO2 / year which is 74.0% of category M.AG emissions. 2022 Emissions
have changed by -14.4% (-2.97 Gg CO2
/ year). 1990-2022 Emissions have changed by -0.9% (-0.15 Gg CO2 / year). For 2022 the
changes per gas
are:
There is no subsector information available in PRIMAP-hist. - M.AG.ELV: Total sectoral emissions in 2022 are 6.17
Gg CO2 / year which is 26.0% of category M.AG emissions. 2022 Emissions
have changed by -8.3% (-0.56 Gg CO2
/ year). 1990-2022 Emissions have changed by -11.9% (-0.63 Gg CO2 / year). For 2022 the
changes per gas
are:

For 1990-2022 the changes per gas are: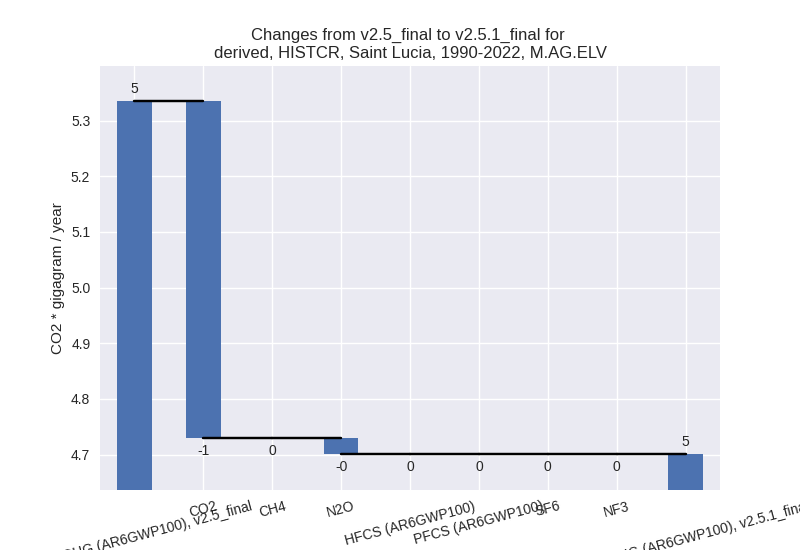
There is no subsector information available in PRIMAP-hist.
- 3.A: Total sectoral emissions in 2022 are 17.59 Gg
CO2 / year which is 74.0% of category M.AG emissions. 2022 Emissions
have changed by -14.4% (-2.97 Gg CO2
/ year). 1990-2022 Emissions have changed by -0.9% (-0.15 Gg CO2 / year). For 2022 the
changes per gas
are:
- 4: Total sectoral emissions in 2022 are 89.68 Gg
CO2 / year which is 11.2% of M.0.EL emissions. 2022 Emissions have
changed by -2.5% (-2.33 Gg CO2 /
year). 1990-2022 Emissions have changed by -0.1% (-0.07 Gg CO2 / year). For 2022 the
changes per gas
are:

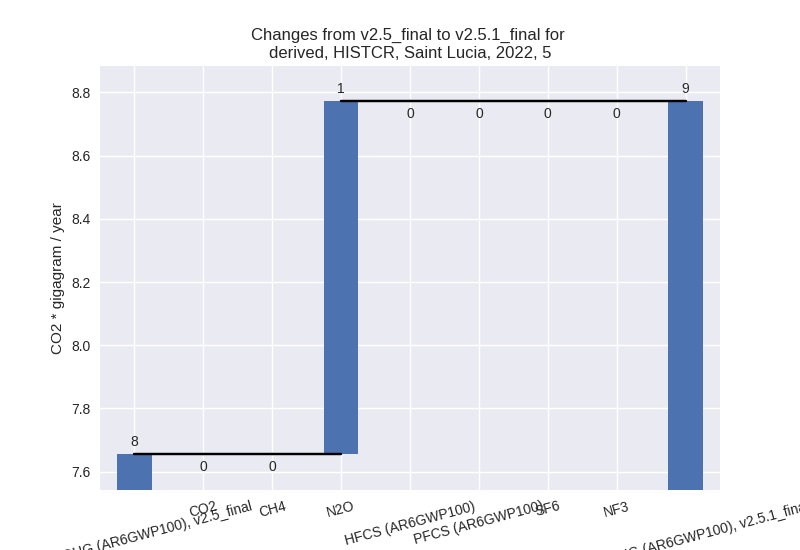
- 5: Total sectoral emissions in 2022 are 8.77 Gg CO2
/ year which is 1.1% of M.0.EL emissions. 2022 Emissions have changed by
14.6% (1.12 Gg CO2 / year).
1990-2022 Emissions have changed by 0.6% (0.03 Gg CO2 / year). For 2022 the
changes per gas
are:
third party scenario (HISTTP):
Most important changes per time frame
For 2022 the following sector-gas combinations have the highest absolute impact on national total KyotoGHG (AR6GWP100) emissions in 2022 (top 5):
- 1: 1.A, CO2 with 147.95 Gg CO2 / year (43.5%)
- 2: 1.A, N2O with -5.66 Gg CO2 / year (-77.8%)
- 3: 2, CO2 with -2.38 Gg CO2 / year (-59.8%)
- 4: 1.A, CH4 with -2.26 Gg CO2 / year (-57.7%)
- 5: 5, N2O with 1.12 Gg CO2 / year (14.6%)
For 1990-2022 the following sector-gas combinations have the highest absolute impact on national total KyotoGHG (AR6GWP100) emissions in 1990-2022 (top 5):
- 1: 1.A, CO2 with 76.44 Gg CO2 / year (24.4%)
- 2: 1.A, N2O with -3.24 Gg CO2 / year (-74.6%)
- 3: 2, CO2 with -1.55 Gg CO2 / year (-62.4%)
- 4: 1.A, CH4 with -1.30 Gg CO2 / year (-47.3%)
- 5: M.AG.ELV, CO2 with -0.60 Gg CO2 / year (-100.0%)
Changes in the main sectors for aggregate KyotoGHG (AR6GWP100) are
- 1: Total sectoral emissions in 2022 are 493.61 Gg
CO2 / year which is 72.4% of M.0.EL emissions. 2022 Emissions have
changed by 39.3% (139.17 Gg CO2 /
year). 1990-2022 Emissions have changed by 22.4% (72.15 Gg CO2 / year). For 2022 the
changes per gas
are:

For 1990-2022 the changes per gas are:
The changes come from the following subsectors:- 1.A: Total sectoral emissions in 2022 are 491.06 Gg
CO2 / year which is 99.5% of category 1 emissions. 2022 Emissions have
changed by 39.9% (140.03 Gg CO2 /
year). 1990-2022 Emissions have changed by 22.4% (71.91 Gg CO2 / year). For 2022 the
changes per gas
are:

For 1990-2022 the changes per gas are: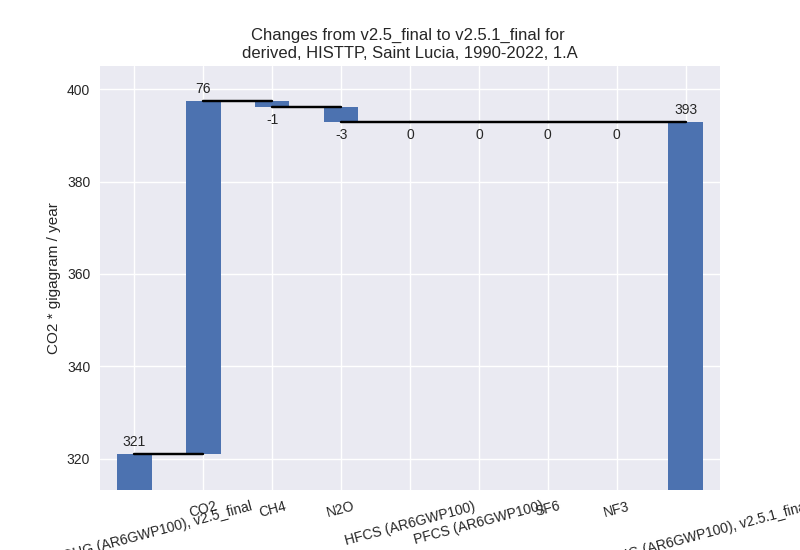
There is no subsector information available in PRIMAP-hist. - 1.B.1: Total sectoral emissions in 2022 are 2.53 Gg
CO2 / year which is 0.5% of category 1 emissions. 2022 Emissions have
changed by -24.6% (-0.83 Gg CO2 /
year). 1990-2022 Emissions have changed by 16.6% (0.26 Gg CO2 / year). For 2022 the
changes per gas
are:

For 1990-2022 the changes per gas are: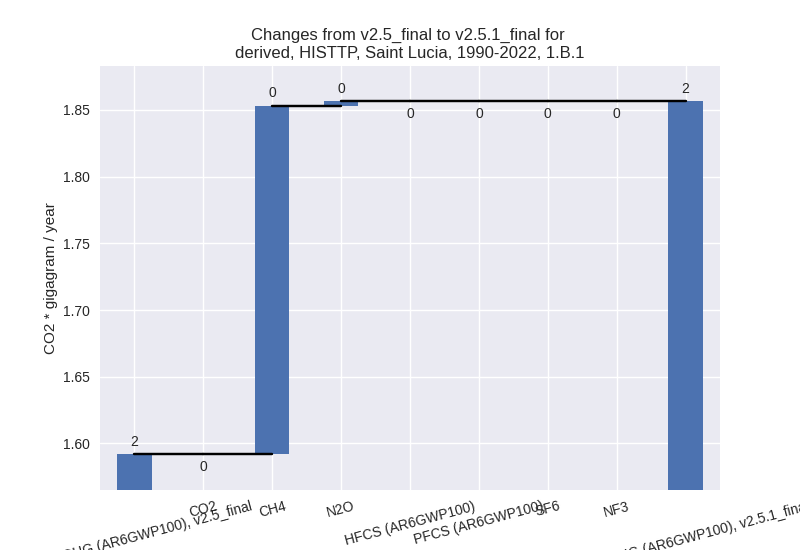
There is no subsector information available in PRIMAP-hist. - 1.B.2: Total sectoral emissions in 2022 are 0.02 Gg
CO2 / year which is 0.0% of category 1 emissions. 2022 Emissions have
changed by -61.3% (-0.03 Gg CO2 /
year). 1990-2022 Emissions have changed by -62.0% (-0.03 Gg CO2 / year). For 2022 the
changes per gas
are:

For 1990-2022 the changes per gas are:
There is no subsector information available in PRIMAP-hist.
- 1.A: Total sectoral emissions in 2022 are 491.06 Gg
CO2 / year which is 99.5% of category 1 emissions. 2022 Emissions have
changed by 39.9% (140.03 Gg CO2 /
year). 1990-2022 Emissions have changed by 22.4% (71.91 Gg CO2 / year). For 2022 the
changes per gas
are:
- 2: Total sectoral emissions in 2022 are 92.01 Gg
CO2 / year which is 13.5% of M.0.EL emissions. 2022 Emissions have
changed by -2.5% (-2.38 Gg CO2 /
year). 1990-2022 Emissions have changed by -3.4% (-1.55 Gg CO2 / year). For 2022 the
changes per gas
are:

For 1990-2022 the changes per gas are: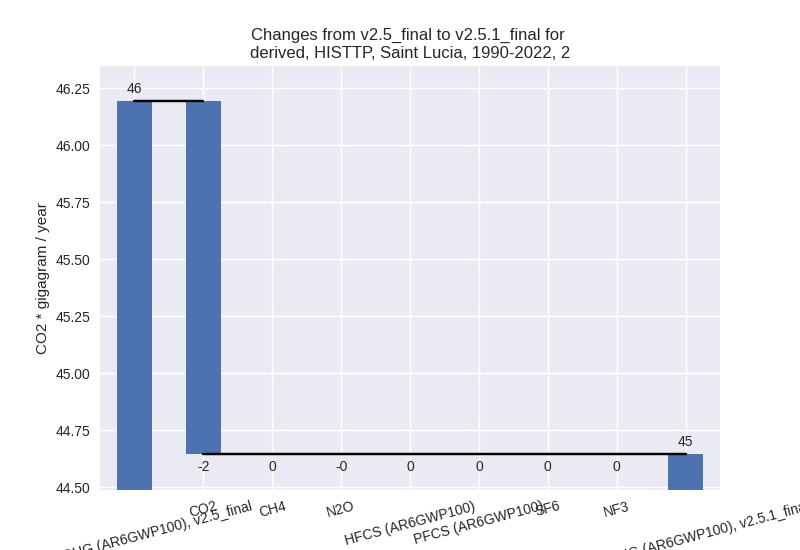
- M.AG: Total sectoral emissions in 2022 are 34.35 Gg
CO2 / year which is 5.0% of M.0.EL emissions. 2022 Emissions have
changed by -4.2% (-1.50 Gg CO2 /
year). 1990-2022 Emissions have changed by -1.6% (-0.63 Gg CO2 / year). For 2022 the
changes per gas
are:

The changes come from the following subsectors:- 3.A: Total sectoral emissions in 2022 are 23.58 Gg
CO2 / year which is 68.6% of category M.AG emissions. 2022 Emissions
have changed by -4.0% (-0.97 Gg CO2
/ year). 1990-2022 Emissions have changed by -0.1% (-0.03 Gg CO2 / year). For 2022 the
changes per gas
are:

There is no subsector information available in PRIMAP-hist. - M.AG.ELV: Total sectoral emissions in 2022 are
10.77 Gg CO2 / year which is 31.4% of category M.AG emissions. 2022
Emissions have changed by -4.7%
(-0.53 Gg CO2 / year). 1990-2022 Emissions have changed by -4.5% (-0.60 Gg CO2 / year). For 2022 the
changes per gas
are:
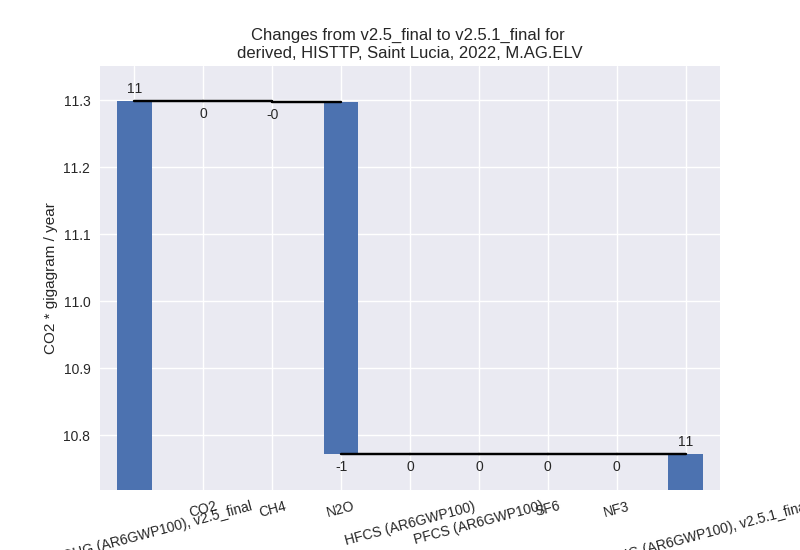
For 1990-2022 the changes per gas are:
There is no subsector information available in PRIMAP-hist.
- 3.A: Total sectoral emissions in 2022 are 23.58 Gg
CO2 / year which is 68.6% of category M.AG emissions. 2022 Emissions
have changed by -4.0% (-0.97 Gg CO2
/ year). 1990-2022 Emissions have changed by -0.1% (-0.03 Gg CO2 / year). For 2022 the
changes per gas
are:
- 4: Total sectoral emissions in 2022 are 52.70 Gg CO2 / year which is 7.7% of M.0.EL emissions. 2022 Emissions have changed by 0.9% (0.45 Gg CO2 / year). 1990-2022 Emissions have changed by 0.0% (0.01 Gg CO2 / year).
- 5: Total sectoral emissions in 2022 are 8.77 Gg CO2
/ year which is 1.3% of M.0.EL emissions. 2022 Emissions have changed by
14.6% (1.12 Gg CO2 / year).
1990-2022 Emissions have changed by 0.6% (0.03 Gg CO2 / year). For 2022 the
changes per gas
are:
