Changes in PRIMAP-hist v2.5.1_final compared to v2.5_final for LDC
2024-02-29
Johannes Gütschow
Change analysis for LDC for PRIMAP-hist v2.5.1_final compared to v2.5_final
Overview over emissions by sector and gas
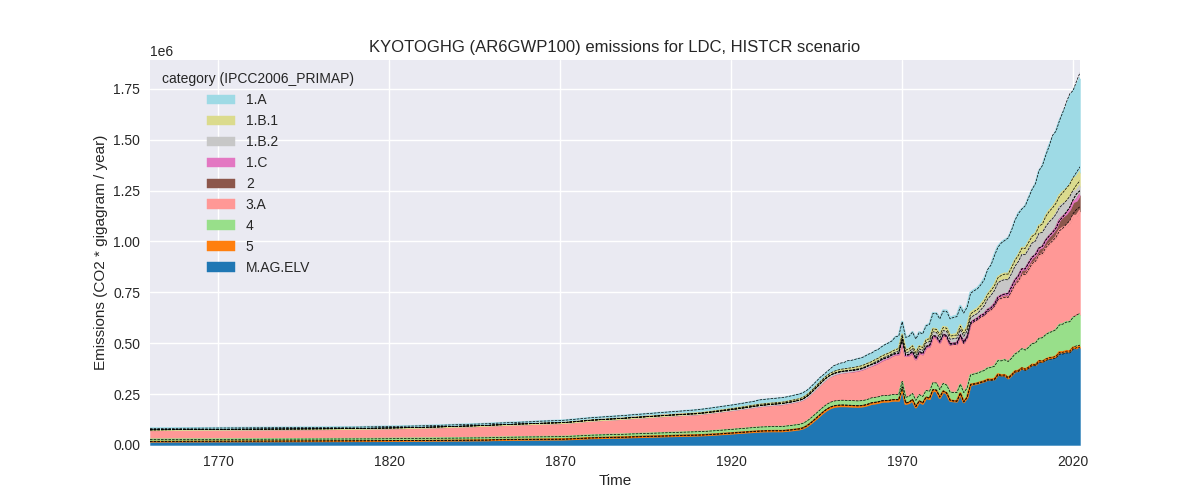
The following figures show the aggregate national total emissions excluding LULUCF AR6GWP100 for the country reported priority scenario. The dotted linesshow the v2.5_final data.


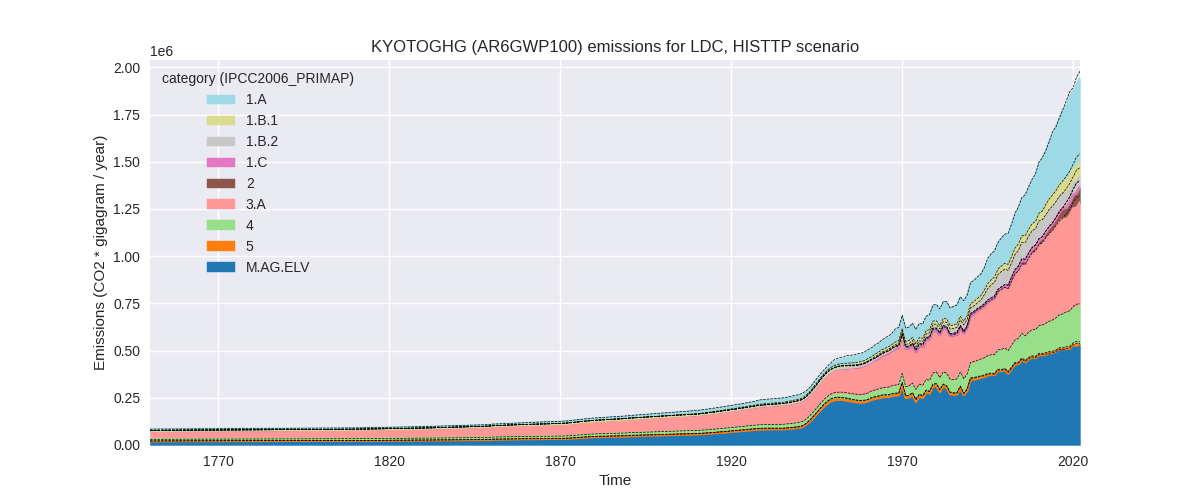
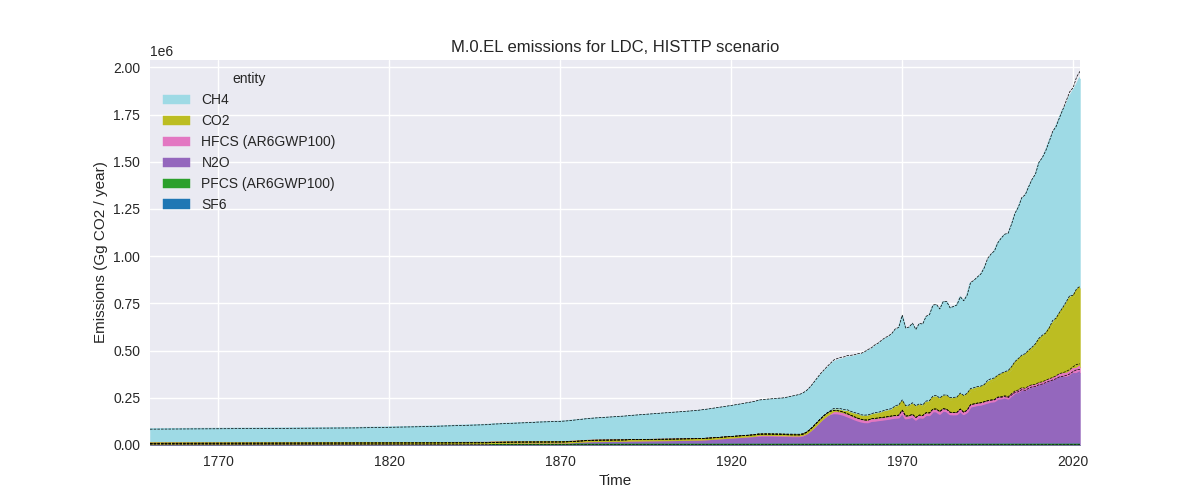
The following figures show the aggregate national total emissions excluding LULUCF AR6GWP100 for the third party priority scenario. The dotted linesshow the v2.5_final data.

Overview over changes
In the country reported priority scenario we have the following changes for aggregate Kyoto GHG and national total emissions excluding LULUCF (M.0.EL):
- Emissions in 2022 have changed by -1.5%% (-27903.10 Gg CO2 / year)
- Emissions in 1990-2022 have changed by -0.2%% (-2805.91 Gg CO2 / year)
In the third party priority scenario we have the following changes for aggregate Kyoto GHG and national total emissions excluding LULUCF (M.0.EL):
- Emissions in 2022 have changed by -1.9%% (-37344.20 Gg CO2 / year)
- Emissions in 1990-2022 have changed by -0.8%% (-10623.37 Gg CO2 / year)
Most important changes per scenario and time frame
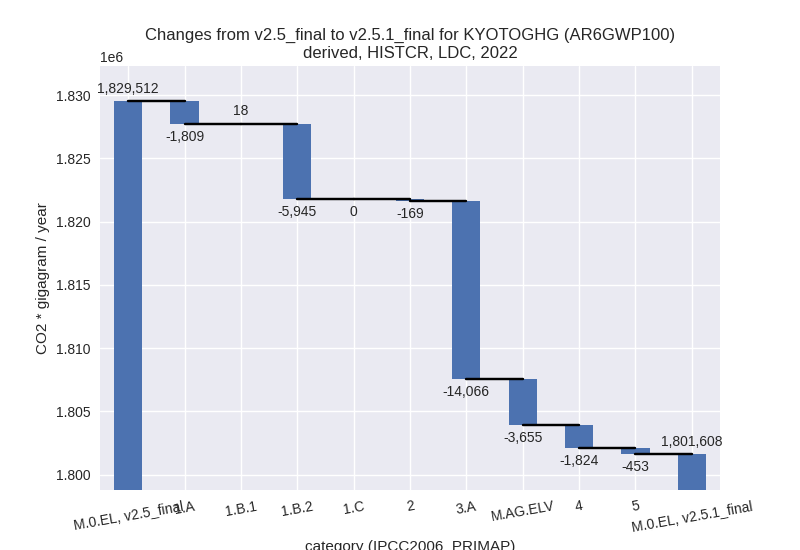
In the country reported priority scenario the following sector-gas combinations have the highest absolute impact on national total KyotoGHG (AR6GWP100) emissions in 2022 (top 5):
- 1: 3.A, CH4 with -13359.22 Gg CO2 / year (-2.7%)
- 2: 1.B.2, CH4 with -5328.75 Gg CO2 / year (-13.2%)
- 3: M.AG.ELV, N2O with -4298.00 Gg CO2 / year (-1.4%)
- 4: 1.A, CH4 with -2913.37 Gg CO2 / year (-4.7%)
- 5: 1.A, CO2 with 1750.16 Gg CO2 / year (0.5%)
In the country reported priority scenario the following sector-gas combinations have the highest absolute impact on national total KyotoGHG (AR6GWP100) emissions in 1990-2022 (top 5):
- 1: 1.B.1, CH4 with 5164.84 Gg CO2 / year (14.0%)
- 2: 1.A, CO2 with -2538.47 Gg CO2 / year (-1.3%)
- 3: M.AG.ELV, N2O with -2093.85 Gg CO2 / year (-1.0%)
- 4: 3.A, CH4 with -1678.62 Gg CO2 / year (-0.5%)
- 5: 1.B.2, CH4 with -889.07 Gg CO2 / year (-1.9%)
In the third party priority scenario the following sector-gas combinations have the highest absolute impact on national total KyotoGHG (AR6GWP100) emissions in 2022 (top 5):
- 1: 3.A, CH4 with -22401.24 Gg CO2 / year (-4.0%)
- 2: M.AG.ELV, N2O with -11762.12 Gg CO2 / year (-3.4%)
- 3: 1.B.2, CH4 with -8598.78 Gg CO2 / year (-14.4%)
- 4: 1.A, CO2 with 8499.73 Gg CO2 / year (2.4%)
- 5: 3.A, N2O with -2861.18 Gg CO2 / year (-22.0%)
In the third party priority scenario the following sector-gas combinations have the highest absolute impact on national total KyotoGHG (AR6GWP100) emissions in 1990-2022 (top 5):
- 1: M.AG.ELV, N2O with -9730.07 Gg CO2 / year (-3.7%)
- 2: 1.B.1, CH4 with 5143.04 Gg CO2 / year (12.5%)
- 3: 3.A, CH4 with -3002.47 Gg CO2 / year (-0.8%)
- 4: 1.B.2, CH4 with -1879.36 Gg CO2 / year (-3.1%)
- 5: 2, CO2 with -562.68 Gg CO2 / year (-3.1%)
Notes on data changes
No country specific notes present for this changelog.
Changes by sector and gas
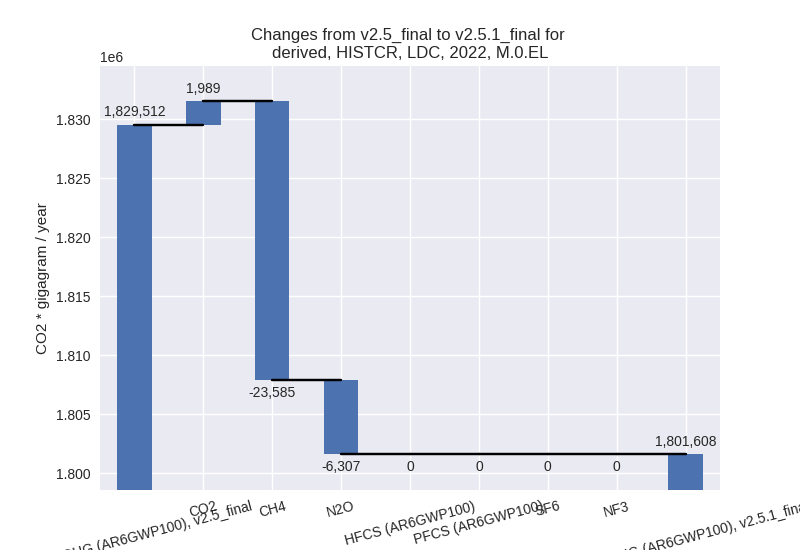
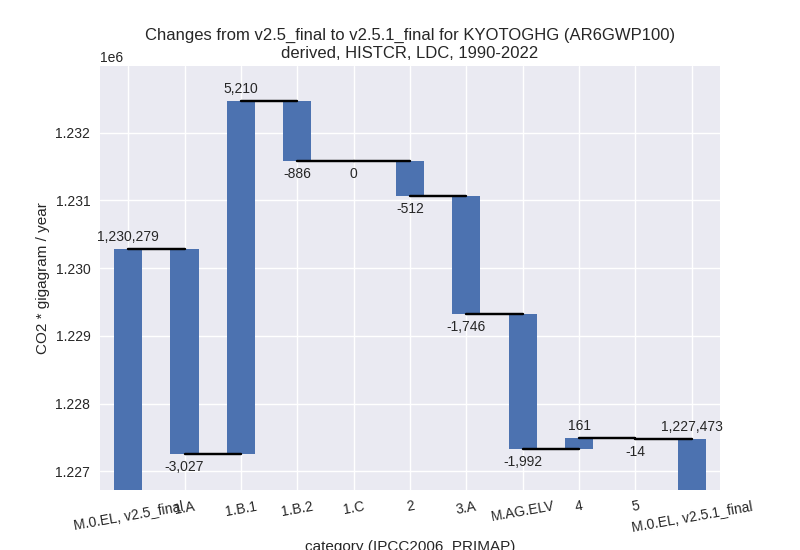
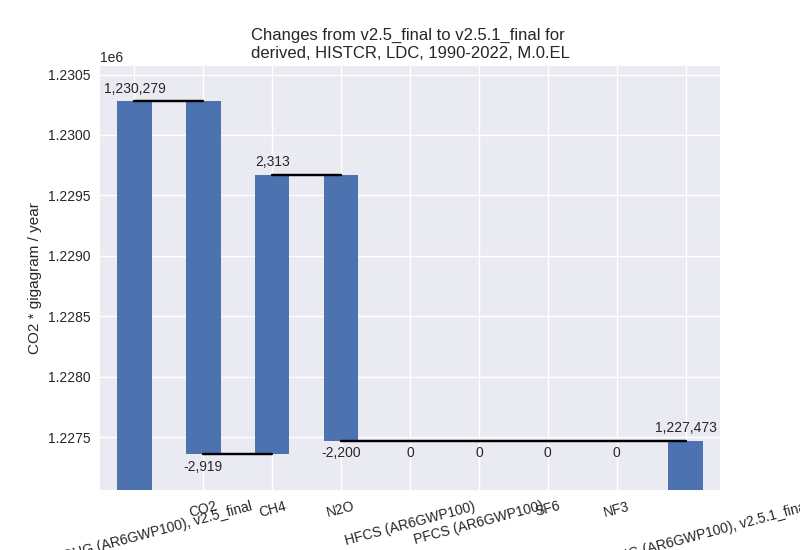
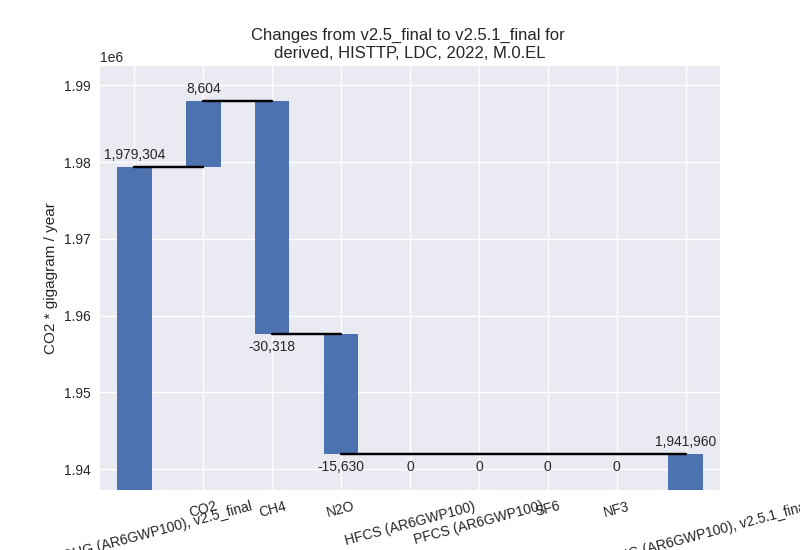
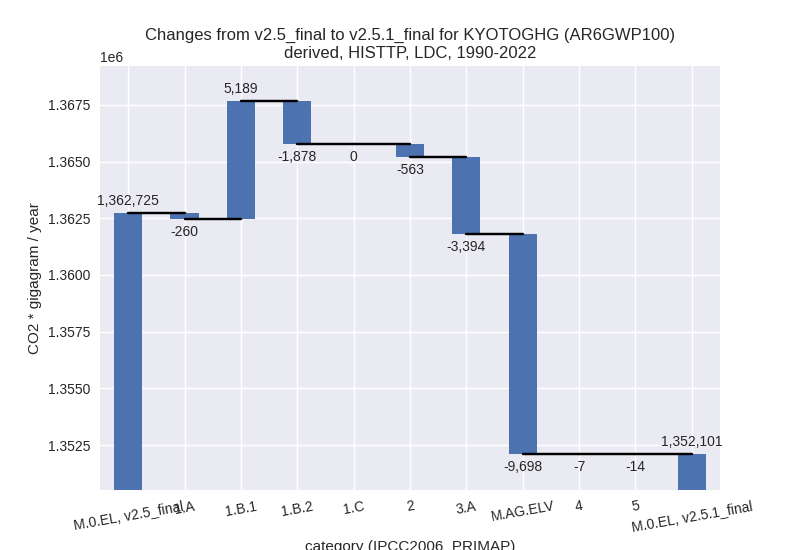
For each scenario and time frame the changes are displayed for all individual sectors and all individual gases. In the sector plot we use aggregate Kyoto GHGs in AR6GWP100. In the gas plot we usenational total emissions without LULUCF. ## country reported scenario
2022
1990-2022
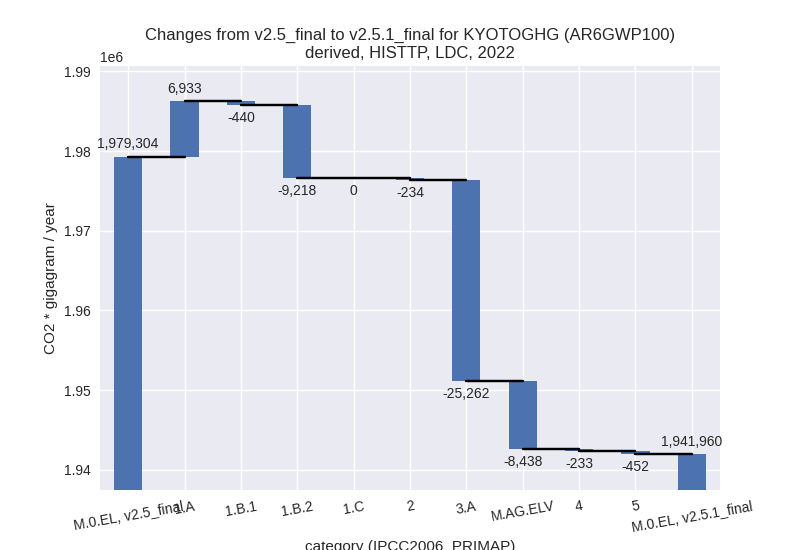
third party scenario
2022
1990-2022

Detailed changes for the scenarios:
country reported scenario (HISTCR):
Most important changes per time frame
For 2022 the following sector-gas combinations have the highest absolute impact on national total KyotoGHG (AR6GWP100) emissions in 2022 (top 5):
- 1: 3.A, CH4 with -13359.22 Gg CO2 / year (-2.7%)
- 2: 1.B.2, CH4 with -5328.75 Gg CO2 / year (-13.2%)
- 3: M.AG.ELV, N2O with -4298.00 Gg CO2 / year (-1.4%)
- 4: 1.A, CH4 with -2913.37 Gg CO2 / year (-4.7%)
- 5: 1.A, CO2 with 1750.16 Gg CO2 / year (0.5%)
For 1990-2022 the following sector-gas combinations have the highest absolute impact on national total KyotoGHG (AR6GWP100) emissions in 1990-2022 (top 5):
- 1: 1.B.1, CH4 with 5164.84 Gg CO2 / year (14.0%)
- 2: 1.A, CO2 with -2538.47 Gg CO2 / year (-1.3%)
- 3: M.AG.ELV, N2O with -2093.85 Gg CO2 / year (-1.0%)
- 4: 3.A, CH4 with -1678.62 Gg CO2 / year (-0.5%)
- 5: 1.B.2, CH4 with -889.07 Gg CO2 / year (-1.9%)
Changes in the main sectors for aggregate KyotoGHG (AR6GWP100) are
- 1: Total sectoral emissions in 2022 are 572392.44 Gg CO2 / year which is 31.8% of M.0.EL emissions. 2022 Emissions have changed by -1.3% (-7736.15 Gg CO2 / year). 1990-2022 Emissions have changed by 0.4% (1296.83 Gg CO2 / year).
- 2: Total sectoral emissions in 2022 are 78137.77 Gg CO2 / year which is 4.3% of M.0.EL emissions. 2022 Emissions have changed by -0.2% (-169.12 Gg CO2 / year). 1990-2022 Emissions have changed by -1.6% (-512.37 Gg CO2 / year).
- M.AG: Total sectoral emissions in 2022 are 986599.02 Gg CO2 / year which is 54.8% of M.0.EL emissions. 2022 Emissions have changed by -1.8% (-17720.98 Gg CO2 / year). 1990-2022 Emissions have changed by -0.5% (-3737.73 Gg CO2 / year).
- 4: Total sectoral emissions in 2022 are 155031.73 Gg CO2 / year which is 8.6% of M.0.EL emissions. 2022 Emissions have changed by -1.2% (-1823.75 Gg CO2 / year). 1990-2022 Emissions have changed by 0.2% (161.09 Gg CO2 / year).
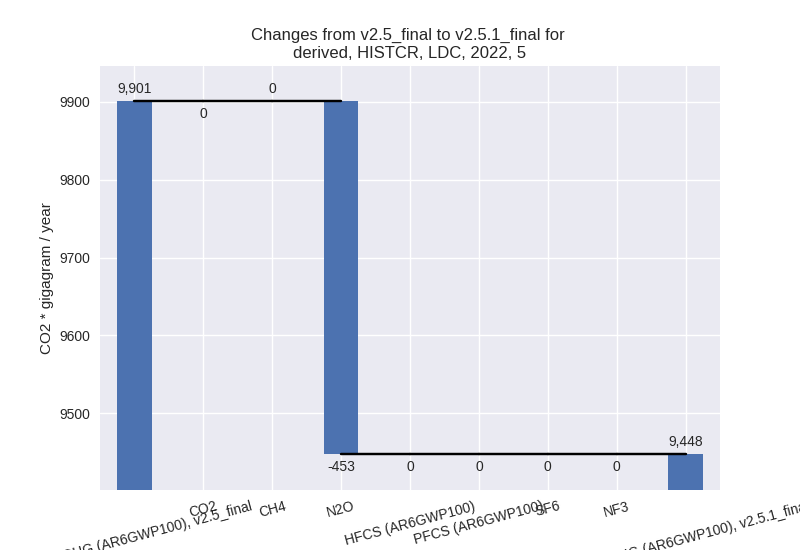
- 5: Total sectoral emissions in 2022 are 9447.54 Gg
CO2 / year which is 0.5% of M.0.EL emissions. 2022 Emissions have
changed by -4.6% (-453.08 Gg CO2 /
year). 1990-2022 Emissions have changed by -0.2% (-13.73 Gg CO2 / year). For 2022 the
changes per gas
are:
third party scenario (HISTTP):
Most important changes per time frame
For 2022 the following sector-gas combinations have the highest absolute impact on national total KyotoGHG (AR6GWP100) emissions in 2022 (top 5):
- 1: 3.A, CH4 with -22401.24 Gg CO2 / year (-4.0%)
- 2: M.AG.ELV, N2O with -11762.12 Gg CO2 / year (-3.4%)
- 3: 1.B.2, CH4 with -8598.78 Gg CO2 / year (-14.4%)
- 4: 1.A, CO2 with 8499.73 Gg CO2 / year (2.4%)
- 5: 3.A, N2O with -2861.18 Gg CO2 / year (-22.0%)
For 1990-2022 the following sector-gas combinations have the highest absolute impact on national total KyotoGHG (AR6GWP100) emissions in 1990-2022 (top 5):
- 1: M.AG.ELV, N2O with -9730.07 Gg CO2 / year (-3.7%)
- 2: 1.B.1, CH4 with 5143.04 Gg CO2 / year (12.5%)
- 3: 3.A, CH4 with -3002.47 Gg CO2 / year (-0.8%)
- 4: 1.B.2, CH4 with -1879.36 Gg CO2 / year (-3.1%)
- 5: 2, CO2 with -562.68 Gg CO2 / year (-3.1%)
Changes in the main sectors for aggregate KyotoGHG (AR6GWP100) are
- 1: Total sectoral emissions in 2022 are 576050.72 Gg CO2 / year which is 29.7% of M.0.EL emissions. 2022 Emissions have changed by -0.5% (-2724.63 Gg CO2 / year). 1990-2022 Emissions have changed by 0.9% (3051.79 Gg CO2 / year).
- 2: Total sectoral emissions in 2022 are 79742.10 Gg CO2 / year which is 4.1% of M.0.EL emissions. 2022 Emissions have changed by -0.3% (-234.00 Gg CO2 / year). 1990-2022 Emissions have changed by -1.8% (-563.20 Gg CO2 / year).
- M.AG: Total sectoral emissions in 2022 are
1074557.60 Gg CO2 / year which is 55.3% of M.0.EL emissions. 2022
Emissions have changed by -3.0%
(-33700.00 Gg CO2 / year). 1990-2022 Emissions have changed by -1.6% (-13091.27 Gg CO2 / year). For 2022
the changes per gas
are:

The changes come from the following subsectors:- 3.A: Total sectoral emissions in 2022 are 547051.44
Gg CO2 / year which is 50.9% of category M.AG emissions. 2022 Emissions
have changed by -4.4% (-25262.42 Gg
CO2 / year). 1990-2022 Emissions have changed by -0.9% (-3393.52 Gg CO2 / year). For 2022
the changes per gas
are:

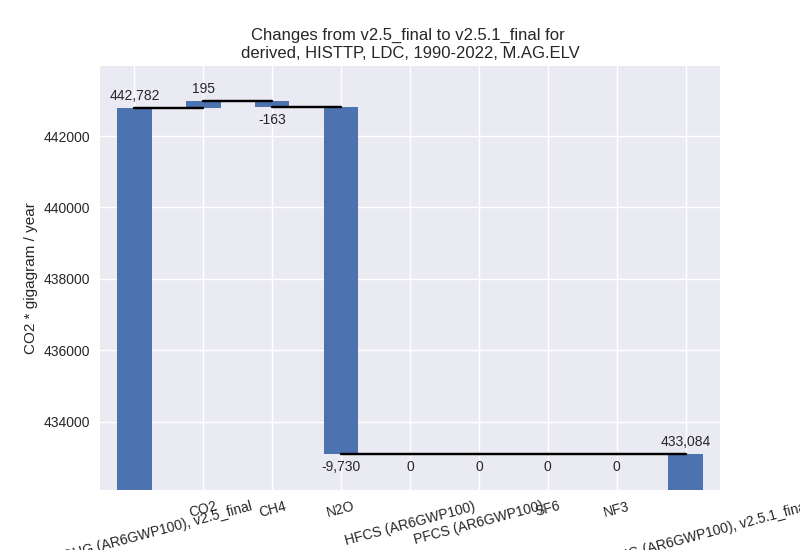
There is no subsector information available in PRIMAP-hist. - M.AG.ELV: Total sectoral emissions in 2022 are
527506.12 Gg CO2 / year which is 49.1% of category M.AG emissions. 2022
Emissions have changed by -1.6%
(-8437.63 Gg CO2 / year). 1990-2022 Emissions have changed by -2.2% (-9697.75 Gg CO2 / year). For
1990-2022 the changes per gas
are:
There is no subsector information available in PRIMAP-hist.
- 3.A: Total sectoral emissions in 2022 are 547051.44
Gg CO2 / year which is 50.9% of category M.AG emissions. 2022 Emissions
have changed by -4.4% (-25262.42 Gg
CO2 / year). 1990-2022 Emissions have changed by -0.9% (-3393.52 Gg CO2 / year). For 2022
the changes per gas
are:
- 4: Total sectoral emissions in 2022 are 201783.61 Gg CO2 / year which is 10.4% of M.0.EL emissions. 2022 Emissions have changed by -0.1% (-233.44 Gg CO2 / year). 1990-2022 Emissions have changed by -0.0% (-6.99 Gg CO2 / year).
- 5: Total sectoral emissions in 2022 are 9825.91 Gg
CO2 / year which is 0.5% of M.0.EL emissions. 2022 Emissions have
changed by -4.4% (-452.11 Gg CO2 /
year). 1990-2022 Emissions have changed by -0.2% (-13.70 Gg CO2 / year). For 2022 the
changes per gas
are:
