Changes in PRIMAP-hist v2.5.1_final compared to v2.5_final for Lesotho
2024-02-29
Johannes Gütschow
Change analysis for Lesotho for PRIMAP-hist v2.5.1_final compared to v2.5_final
Overview over emissions by sector and gas
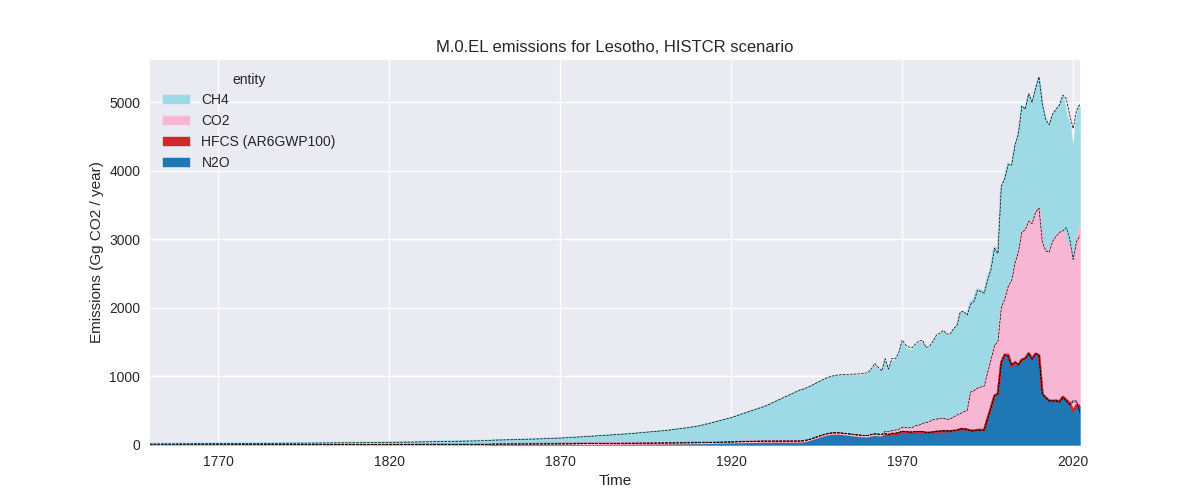
The following figures show the aggregate national total emissions excluding LULUCF AR6GWP100 for the country reported priority scenario. The dotted linesshow the v2.5_final data.


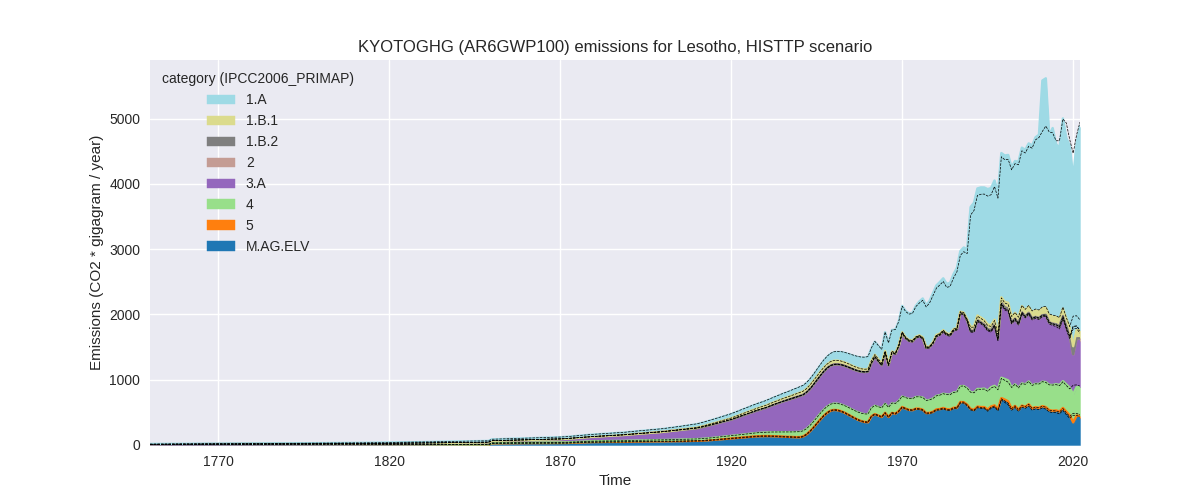
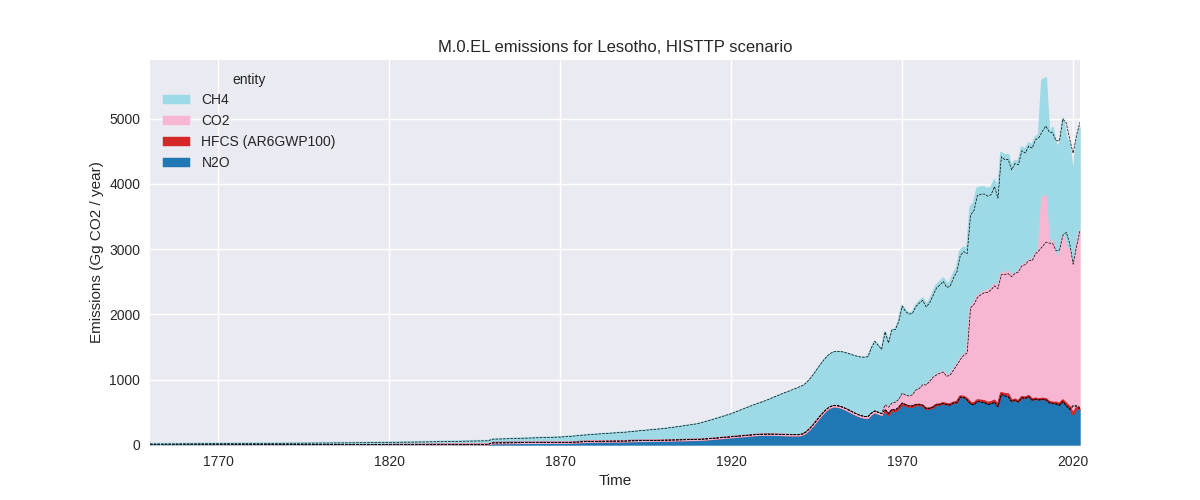
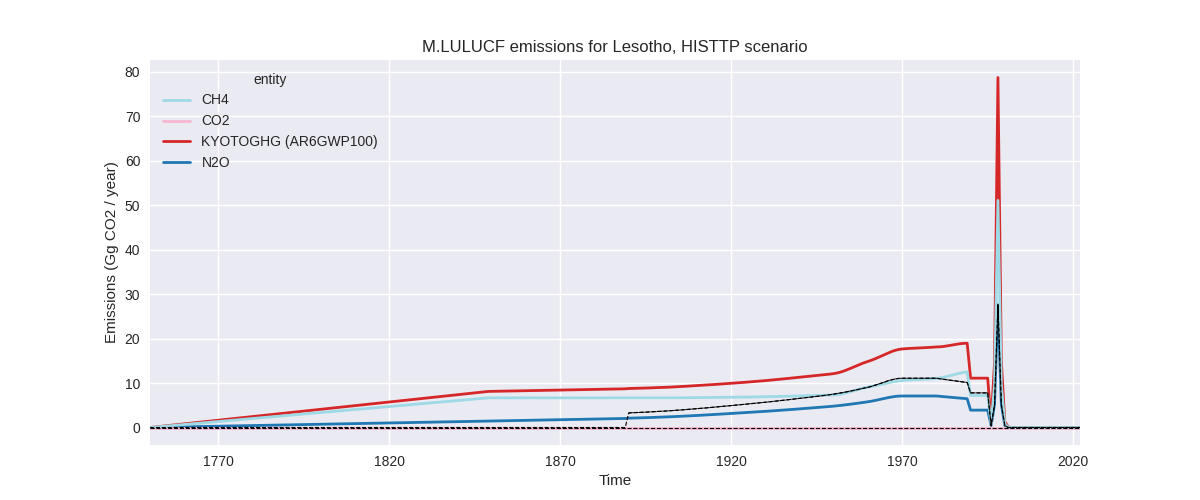
The following figures show the aggregate national total emissions excluding LULUCF AR6GWP100 for the third party priority scenario. The dotted linesshow the v2.5_final data.
Overview over changes
In the country reported priority scenario we have the following changes for aggregate Kyoto GHG and national total emissions excluding LULUCF (M.0.EL):
- Emissions in 2022 have changed by -0.6%% (-30.44 Gg CO2 / year)
- Emissions in 1990-2022 have changed by -0.9%% (-37.06 Gg CO2 / year)
In the third party priority scenario we have the following changes for aggregate Kyoto GHG and national total emissions excluding LULUCF (M.0.EL):
- Emissions in 2022 have changed by -1.4%% (-66.91 Gg CO2 / year)
- Emissions in 1990-2022 have changed by 1.4%% (60.20 Gg CO2 / year)
Most important changes per scenario and time frame
In the country reported priority scenario the following sector-gas combinations have the highest absolute impact on national total KyotoGHG (AR6GWP100) emissions in 2022 (top 5):
- 1: 3.A, CH4 with -91.00 Gg CO2 / year (-11.9%)
- 2: M.AG.ELV, N2O with 64.55 Gg CO2 / year (20.9%)
- 3: 1.A, CO2 with 48.73 Gg CO2 / year (1.9%)
- 4: 3.A, N2O with 37.66 Gg CO2 / year (inf%)
- 5: 1.B.1, CH4 with -37.10 Gg CO2 / year (-23.2%)
In the country reported priority scenario the following sector-gas combinations have the highest absolute impact on national total KyotoGHG (AR6GWP100) emissions in 1990-2022 (top 5):
- 1: 3.A, CH4 with -15.46 Gg CO2 / year (-1.6%)
- 2: 1.B.1, CH4 with -11.91 Gg CO2 / year (-11.2%)
- 3: 1.A, CO2 with -6.30 Gg CO2 / year (-0.4%)
- 4: M.AG.ELV, N2O with -4.13 Gg CO2 / year (-0.7%)
- 5: 1.A, CH4 with 1.85 Gg CO2 / year (0.5%)
In the third party priority scenario the following sector-gas combinations have the highest absolute impact on national total KyotoGHG (AR6GWP100) emissions in 2022 (top 5):
- 1: 3.A, CH4 with -105.90 Gg CO2 / year (-13.2%)
- 2: 1.A, CH4 with 45.98 Gg CO2 / year (16.2%)
- 3: 1.B.1, CH4 with -37.10 Gg CO2 / year (-23.2%)
- 4: 1.A, CO2 with 35.30 Gg CO2 / year (1.3%)
- 5: M.AG.ELV, N2O with -25.78 Gg CO2 / year (-6.1%)
In the third party priority scenario the following sector-gas combinations have the highest absolute impact on national total KyotoGHG (AR6GWP100) emissions in 1990-2022 (top 5):
- 1: 1.A, CH4 with 57.21 Gg CO2 / year (22.6%)
- 2: 1.A, CO2 with 25.80 Gg CO2 / year (1.2%)
- 3: 3.A, CH4 with -16.35 Gg CO2 / year (-1.7%)
- 4: 1.B.1, CH4 with -11.91 Gg CO2 / year (-11.2%)
- 5: 1.A, N2O with 6.98 Gg CO2 / year (9.1%)
Notes on data changes
Here we list notes explaining important emissions changes for the country. ’' means that the following text only applies to the TP time series, while means that it only applies to the CR scenario. Otherwise the note applies to both scenarios.
- 1.A, CO2: Higher emissions in 2011 and 2012 come from the updated CDIAC data.
Changes by sector and gas
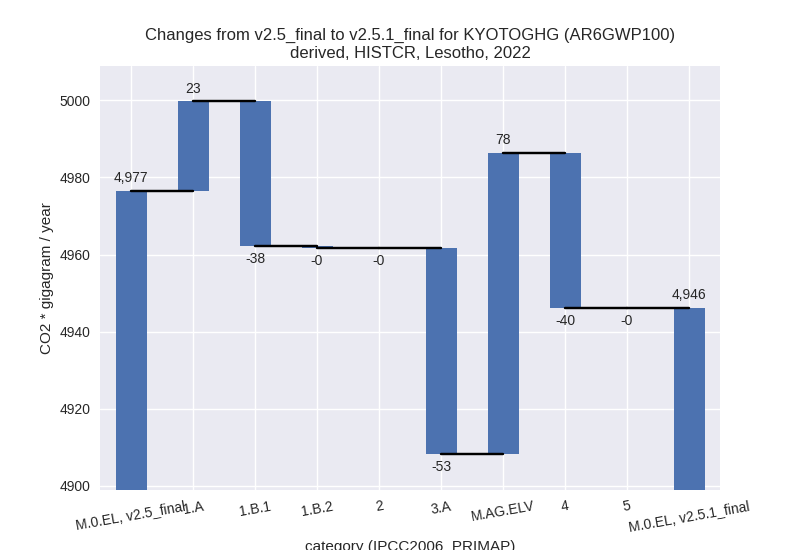
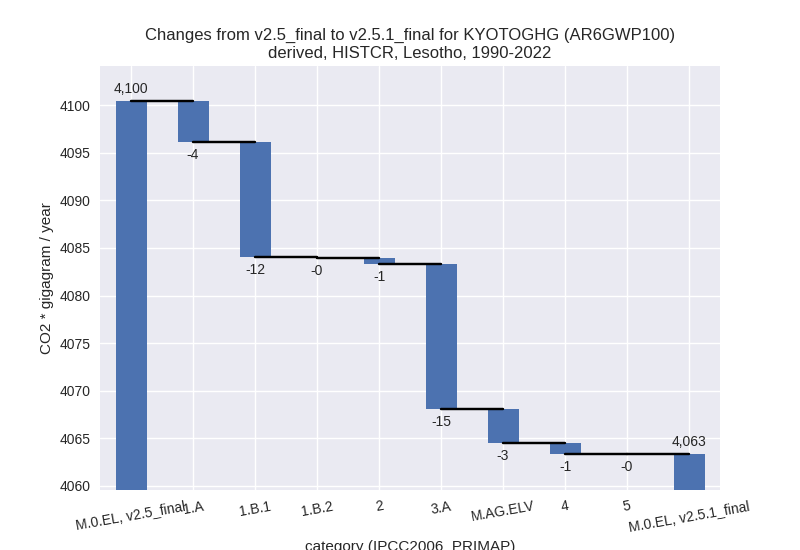
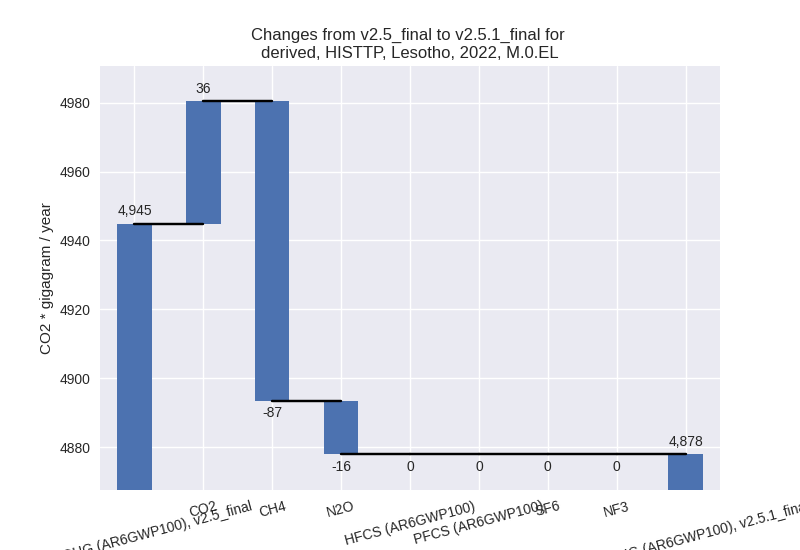
For each scenario and time frame the changes are displayed for all individual sectors and all individual gases. In the sector plot we use aggregate Kyoto GHGs in AR6GWP100. In the gas plot we usenational total emissions without LULUCF. ## country reported scenario
2022

1990-2022

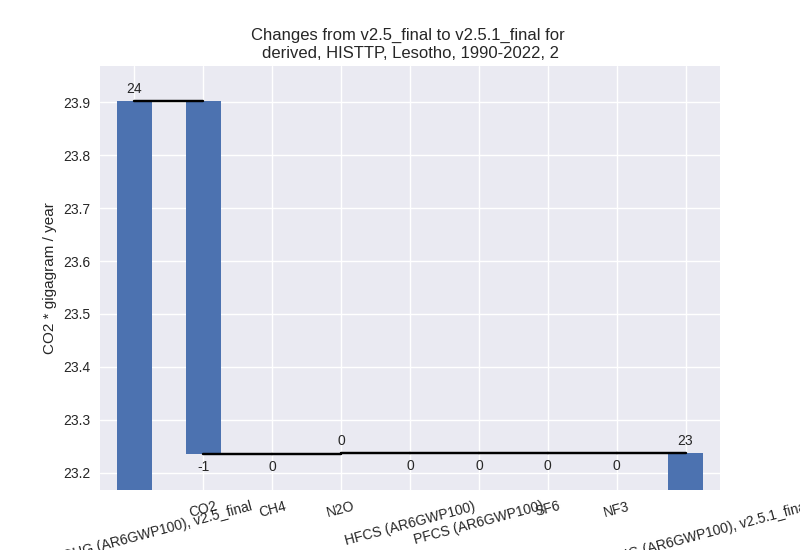
third party scenario
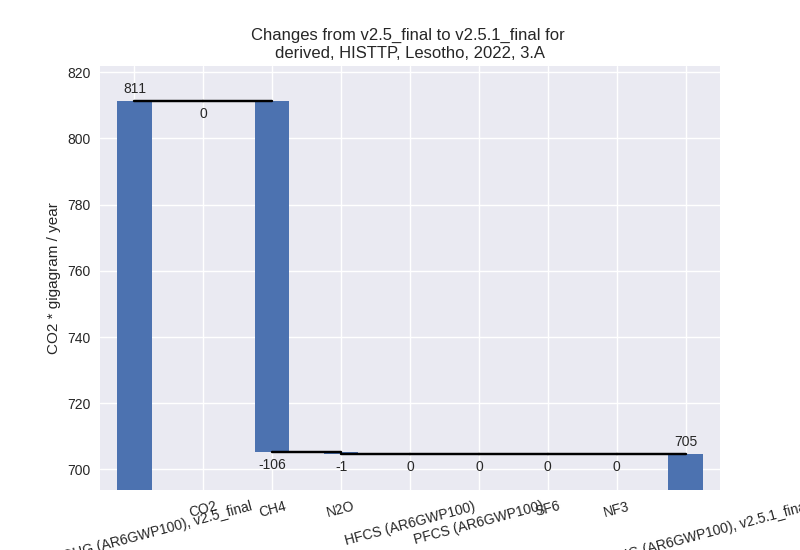
2022

1990-2022


Detailed changes for the scenarios:
country reported scenario (HISTCR):
Most important changes per time frame
For 2022 the following sector-gas combinations have the highest absolute impact on national total KyotoGHG (AR6GWP100) emissions in 2022 (top 5):
- 1: 3.A, CH4 with -91.00 Gg CO2 / year (-11.9%)
- 2: M.AG.ELV, N2O with 64.55 Gg CO2 / year (20.9%)
- 3: 1.A, CO2 with 48.73 Gg CO2 / year (1.9%)
- 4: 3.A, N2O with 37.66 Gg CO2 / year (inf%)
- 5: 1.B.1, CH4 with -37.10 Gg CO2 / year (-23.2%)
For 1990-2022 the following sector-gas combinations have the highest absolute impact on national total KyotoGHG (AR6GWP100) emissions in 1990-2022 (top 5):
- 1: 3.A, CH4 with -15.46 Gg CO2 / year (-1.6%)
- 2: 1.B.1, CH4 with -11.91 Gg CO2 / year (-11.2%)
- 3: 1.A, CO2 with -6.30 Gg CO2 / year (-0.4%)
- 4: M.AG.ELV, N2O with -4.13 Gg CO2 / year (-0.7%)
- 5: 1.A, CH4 with 1.85 Gg CO2 / year (0.5%)
Changes in the main sectors for aggregate KyotoGHG (AR6GWP100) are
- 1: Total sectoral emissions in 2022 are 3265.31 Gg CO2 / year which is 66.0% of M.0.EL emissions. 2022 Emissions have changed by -0.5% (-14.89 Gg CO2 / year). 1990-2022 Emissions have changed by -0.8% (-16.45 Gg CO2 / year).
- 2: Total sectoral emissions in 2022 are 41.46 Gg
CO2 / year which is 0.8% of M.0.EL emissions. 2022 Emissions have
changed by -0.3% (-0.14 Gg CO2 /
year). 1990-2022 Emissions have changed by -2.6% (-0.65 Gg CO2 / year). For 1990-2022
the changes per gas
are:

- M.AG: Total sectoral emissions in 2022 are 1100.88
Gg CO2 / year which is 22.3% of M.0.EL emissions. 2022 Emissions have
changed by 2.3% (24.78 Gg CO2 /
year). 1990-2022 Emissions have changed by -1.1% (-18.74 Gg CO2 / year). For 2022 the
changes per gas
are:

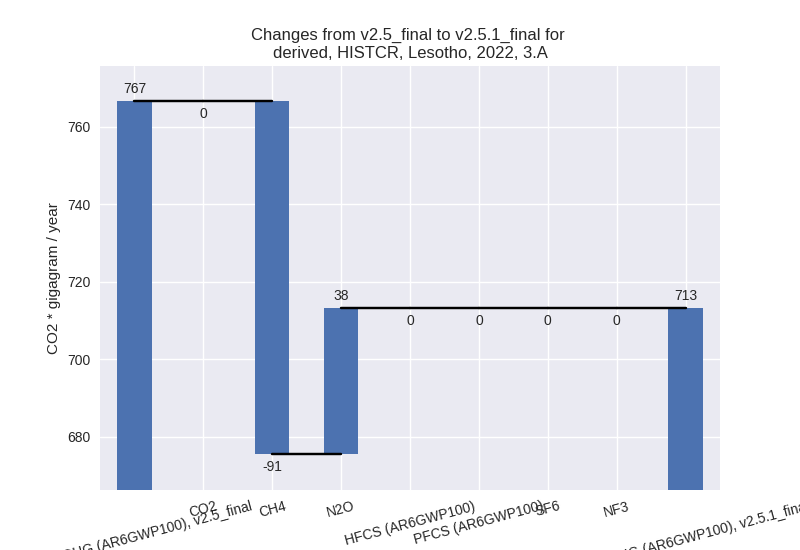
The changes come from the following subsectors:- 3.A: Total sectoral emissions in 2022 are 713.17 Gg
CO2 / year which is 64.8% of category M.AG emissions. 2022 Emissions
have changed by -7.0% (-53.34 Gg CO2
/ year). 1990-2022 Emissions have changed by -1.4% (-15.25 Gg CO2 / year). For 2022 the
changes per gas
are:
There is no subsector information available in PRIMAP-hist. - M.AG.ELV: Total sectoral emissions in 2022 are
387.71 Gg CO2 / year which is 35.2% of category M.AG emissions. 2022
Emissions have changed by 25.2%
(78.12 Gg CO2 / year). 1990-2022 Emissions have changed by -0.6% (-3.50 Gg CO2 / year). For 2022 the
changes per gas
are:
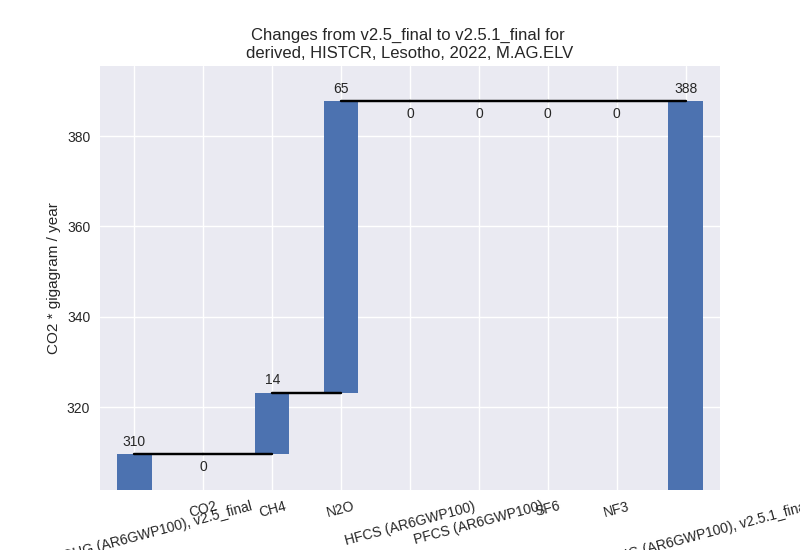
There is no subsector information available in PRIMAP-hist.
- 3.A: Total sectoral emissions in 2022 are 713.17 Gg
CO2 / year which is 64.8% of category M.AG emissions. 2022 Emissions
have changed by -7.0% (-53.34 Gg CO2
/ year). 1990-2022 Emissions have changed by -1.4% (-15.25 Gg CO2 / year). For 2022 the
changes per gas
are:
- 4: Total sectoral emissions in 2022 are 507.98 Gg
CO2 / year which is 10.3% of M.0.EL emissions. 2022 Emissions have
changed by -7.3% (-40.16 Gg CO2 /
year). 1990-2022 Emissions have changed by -0.4% (-1.22 Gg CO2 / year). For 2022 the
changes per gas
are:
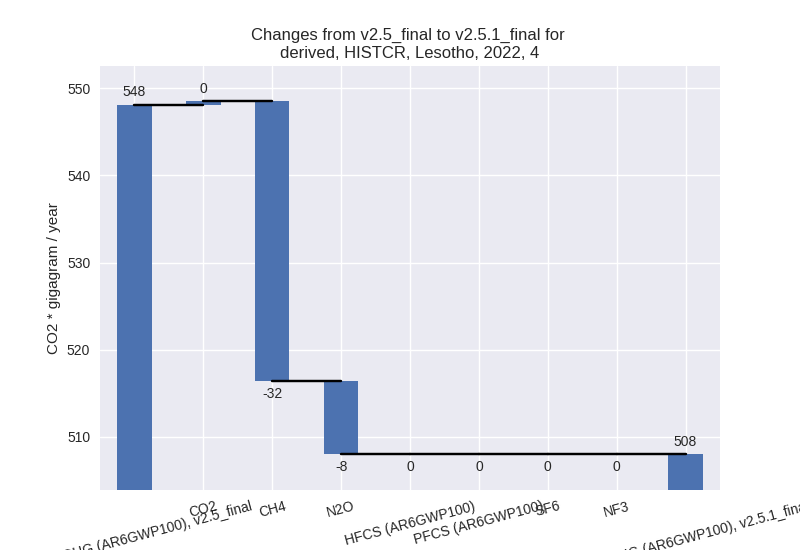
- 5: Total sectoral emissions in 2022 are 30.54 Gg CO2 / year which is 0.6% of M.0.EL emissions. 2022 Emissions have changed by -0.1% (-0.03 Gg CO2 / year). 1990-2022 Emissions have changed by -0.0% (-0.00 Gg CO2 / year).
third party scenario (HISTTP):
Most important changes per time frame
For 2022 the following sector-gas combinations have the highest absolute impact on national total KyotoGHG (AR6GWP100) emissions in 2022 (top 5):
- 1: 3.A, CH4 with -105.90 Gg CO2 / year (-13.2%)
- 2: 1.A, CH4 with 45.98 Gg CO2 / year (16.2%)
- 3: 1.B.1, CH4 with -37.10 Gg CO2 / year (-23.2%)
- 4: 1.A, CO2 with 35.30 Gg CO2 / year (1.3%)
- 5: M.AG.ELV, N2O with -25.78 Gg CO2 / year (-6.1%)
For 1990-2022 the following sector-gas combinations have the highest absolute impact on national total KyotoGHG (AR6GWP100) emissions in 1990-2022 (top 5):
- 1: 1.A, CH4 with 57.21 Gg CO2 / year (22.6%)
- 2: 1.A, CO2 with 25.80 Gg CO2 / year (1.2%)
- 3: 3.A, CH4 with -16.35 Gg CO2 / year (-1.7%)
- 4: 1.B.1, CH4 with -11.91 Gg CO2 / year (-11.2%)
- 5: 1.A, N2O with 6.98 Gg CO2 / year (9.1%)
Changes in the main sectors for aggregate KyotoGHG (AR6GWP100) are
- 1: Total sectoral emissions in 2022 are 3245.10 Gg
CO2 / year which is 66.5% of M.0.EL emissions. 2022 Emissions have
changed by 1.7% (54.03 Gg CO2 /
year). 1990-2022 Emissions have changed by 3.1% (77.83 Gg CO2 / year). For 1990-2022
the changes per gas
are:

The changes come from the following subsectors:- 1.A: Total sectoral emissions in 2022 are 3120.95
Gg CO2 / year which is 96.2% of category 1 emissions. 2022 Emissions
have changed by 3.0% (92.04 Gg CO2 /
year). 1990-2022 Emissions have changed by 3.8% (89.99 Gg CO2 / year). For 2022 the
changes per gas
are:

For 1990-2022 the changes per gas are:
There is no subsector information available in PRIMAP-hist. - 1.B.1: Total sectoral emissions in 2022 are 124.15
Gg CO2 / year which is 3.8% of category 1 emissions. 2022 Emissions have
changed by -23.2% (-37.59 Gg CO2 /
year). 1990-2022 Emissions have changed by -11.2% (-12.07 Gg CO2 / year). For 2022
the changes per gas
are:

For 1990-2022 the changes per gas are:
There is no subsector information available in PRIMAP-hist. - 1.B.2: Total sectoral emissions in 2022 are 0.00 Gg
CO2 / year which is 0.0% of category 1 emissions. 2022 Emissions have
changed by -99.6% (-0.42 Gg CO2 /
year). 1990-2022 Emissions have changed by -98.3% (-0.09 Gg CO2 / year). For 2022 the
changes per gas
are:
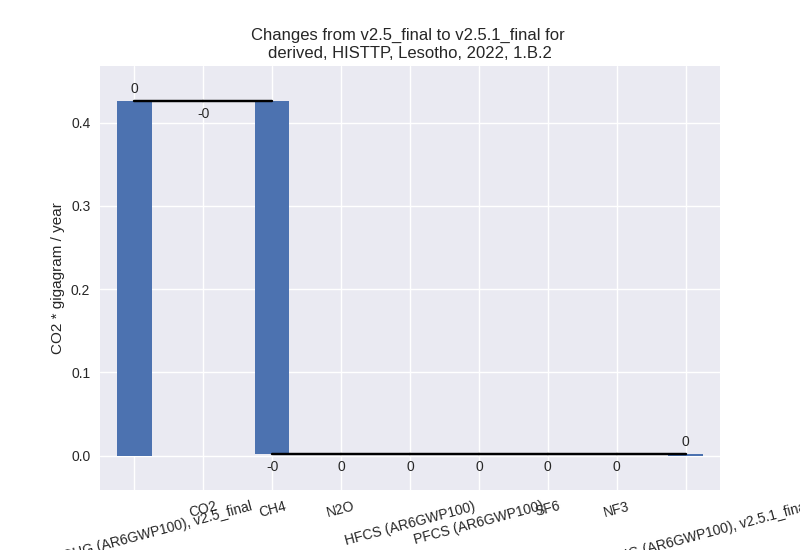
For 1990-2022 the changes per gas are: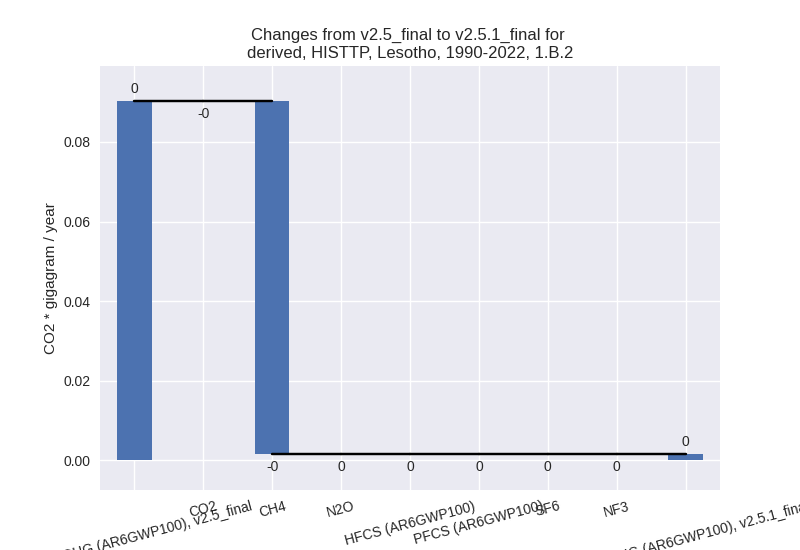
There is no subsector information available in PRIMAP-hist.
- 1.A: Total sectoral emissions in 2022 are 3120.95
Gg CO2 / year which is 96.2% of category 1 emissions. 2022 Emissions
have changed by 3.0% (92.04 Gg CO2 /
year). 1990-2022 Emissions have changed by 3.8% (89.99 Gg CO2 / year). For 2022 the
changes per gas
are:
- 2: Total sectoral emissions in 2022 are 40.31 Gg
CO2 / year which is 0.8% of M.0.EL emissions. 2022 Emissions have
changed by -0.2% (-0.07 Gg CO2 /
year). 1990-2022 Emissions have changed by -2.8% (-0.67 Gg CO2 / year). For 1990-2022
the changes per gas
are:
- M.AG: Total sectoral emissions in 2022 are 1119.21
Gg CO2 / year which is 22.9% of M.0.EL emissions. 2022 Emissions have
changed by -9.8% (-121.23 Gg CO2 /
year). 1990-2022 Emissions have changed by -1.1% (-16.98 Gg CO2 / year). For 2022 the
changes per gas
are:
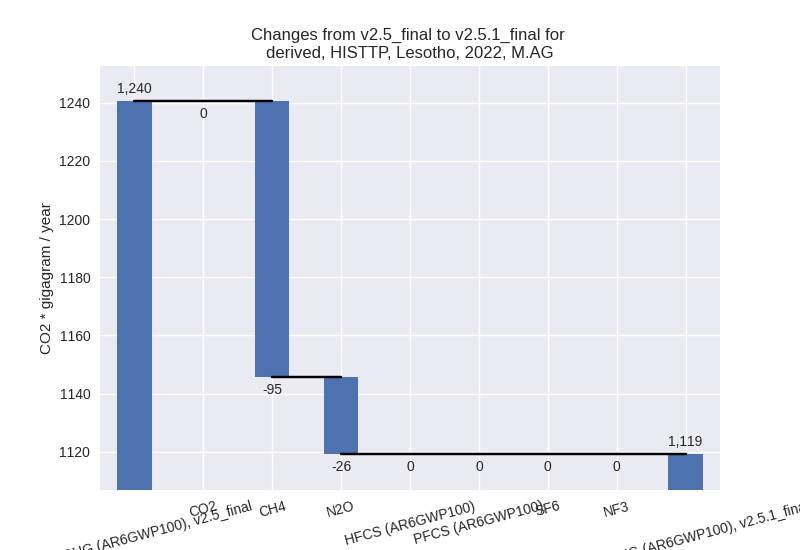
The changes come from the following subsectors:- 3.A: Total sectoral emissions in 2022 are 704.61 Gg
CO2 / year which is 63.0% of category M.AG emissions. 2022 Emissions
have changed by -13.1% (-106.61 Gg
CO2 / year). 1990-2022 Emissions have changed by -1.7% (-16.52 Gg CO2 / year). For 2022 the
changes per gas
are:
There is no subsector information available in PRIMAP-hist. - M.AG.ELV: Total sectoral emissions in 2022 are
414.60 Gg CO2 / year which is 37.0% of category M.AG emissions. 2022
Emissions have changed by -3.4%
(-14.61 Gg CO2 / year). 1990-2022 Emissions have changed by -0.1% (-0.46 Gg CO2 / year). For 2022 the
changes per gas
are:

There is no subsector information available in PRIMAP-hist.
- 3.A: Total sectoral emissions in 2022 are 704.61 Gg
CO2 / year which is 63.0% of category M.AG emissions. 2022 Emissions
have changed by -13.1% (-106.61 Gg
CO2 / year). 1990-2022 Emissions have changed by -1.7% (-16.52 Gg CO2 / year). For 2022 the
changes per gas
are:
- 4: Total sectoral emissions in 2022 are 442.77 Gg CO2 / year which is 9.1% of M.0.EL emissions. 2022 Emissions have changed by 0.1% (0.38 Gg CO2 / year). 1990-2022 Emissions have changed by 0.0% (0.01 Gg CO2 / year).
- 5: Total sectoral emissions in 2022 are 30.54 Gg CO2 / year which is 0.6% of M.0.EL emissions. 2022 Emissions have changed by -0.1% (-0.03 Gg CO2 / year). 1990-2022 Emissions have changed by -0.0% (-0.00 Gg CO2 / year).