Changes in PRIMAP-hist v2.5.1_final compared to v2.5_final for Lithuania
2024-02-29
Johannes Gütschow
Change analysis for Lithuania for PRIMAP-hist v2.5.1_final compared to v2.5_final
Overview over emissions by sector and gas
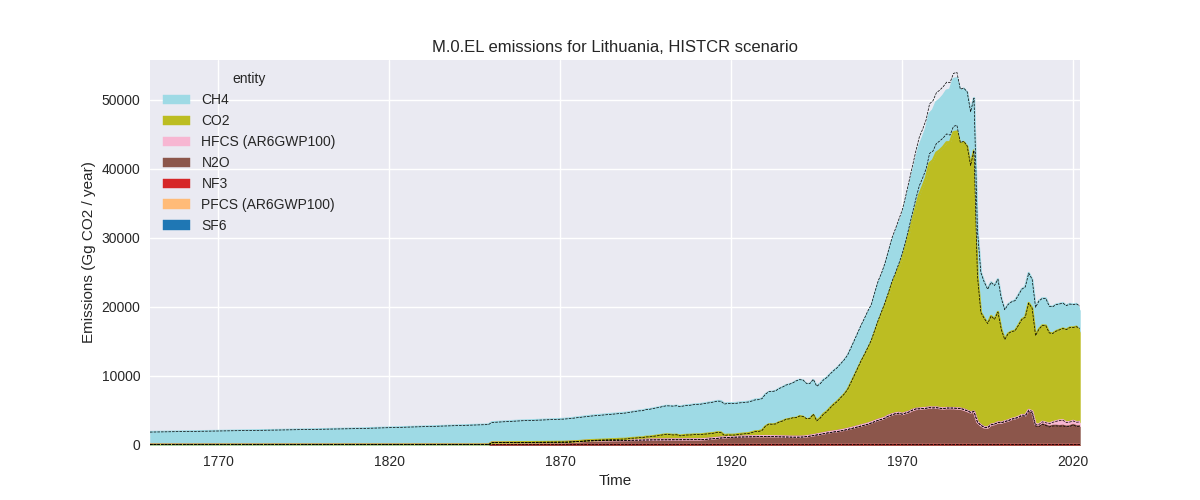
The following figures show the aggregate national total emissions excluding LULUCF AR6GWP100 for the country reported priority scenario. The dotted linesshow the v2.5_final data.


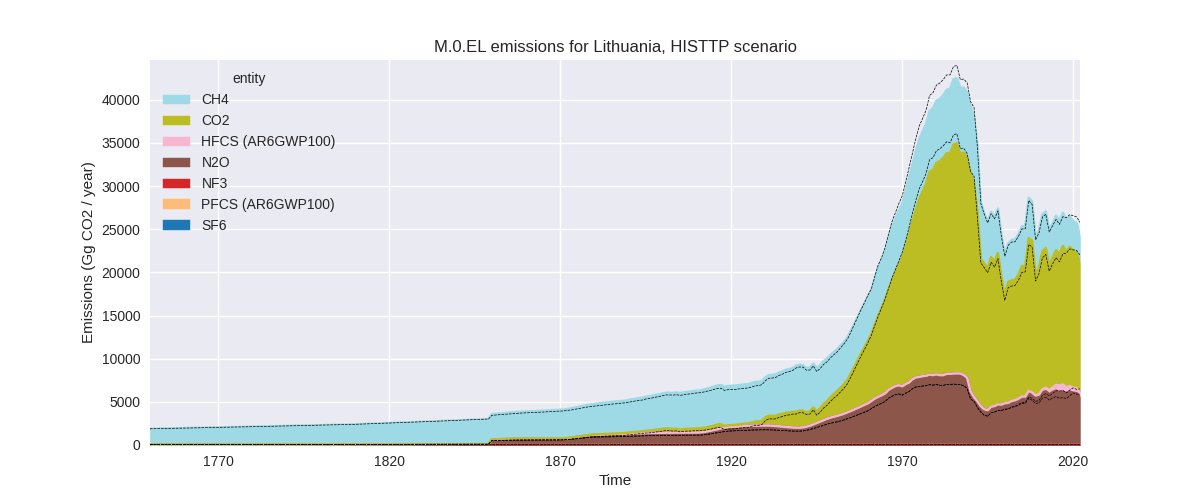
The following figures show the aggregate national total emissions excluding LULUCF AR6GWP100 for the third party priority scenario. The dotted linesshow the v2.5_final data.

Overview over changes
In the country reported priority scenario we have the following changes for aggregate Kyoto GHG and national total emissions excluding LULUCF (M.0.EL):
- Emissions in 2022 have changed by -3.3%% (-655.47 Gg CO2 / year)
- Emissions in 1990-2022 have changed by -0.1%% (-19.86 Gg CO2 / year)
In the third party priority scenario we have the following changes for aggregate Kyoto GHG and national total emissions excluding LULUCF (M.0.EL):
- Emissions in 2022 have changed by -5.9%% (-1516.51 Gg CO2 / year)
- Emissions in 1990-2022 have changed by 0.3%% (72.03 Gg CO2 / year)
Most important changes per scenario and time frame
In the country reported priority scenario the following sector-gas combinations have the highest absolute impact on national total KyotoGHG (AR6GWP100) emissions in 2022 (top 5):
- 1: 2, CO2 with -435.22 Gg CO2 / year (-18.5%)
- 2: M.AG.ELV, N2O with -128.16 Gg CO2 / year (-5.4%)
- 3: 2, N2O with 114.61 Gg CO2 / year (inf%)
- 4: 4, CH4 with -89.77 Gg CO2 / year (-11.7%)
- 5: 1.B.2, CO2 with -68.47 Gg CO2 / year (-27.4%)
In the country reported priority scenario the following sector-gas combinations have the highest absolute impact on national total KyotoGHG (AR6GWP100) emissions in 1990-2022 (top 5):
- 1: 2, CO2 with -13.19 Gg CO2 / year (-0.7%)
- 2: M.AG.ELV, N2O with -3.88 Gg CO2 / year (-0.2%)
- 3: 2, N2O with 3.47 Gg CO2 / year (0.4%)
- 4: 4, CH4 with -2.72 Gg CO2 / year (-0.2%)
- 5: 1.B.2, CO2 with -2.07 Gg CO2 / year (-1.4%)
In the third party priority scenario the following sector-gas combinations have the highest absolute impact on national total KyotoGHG (AR6GWP100) emissions in 2022 (top 5):
- 1: 2, N2O with -924.79 Gg CO2 / year (-37.5%)
- 2: 2, CO2 with -703.60 Gg CO2 / year (-24.8%)
- 3: M.AG.ELV, N2O with 688.10 Gg CO2 / year (23.0%)
- 4: 1.B.2, CH4 with -482.44 Gg CO2 / year (-76.1%)
- 5: M.AG.ELV, CO2 with 443.14 Gg CO2 / year (1282.9%)
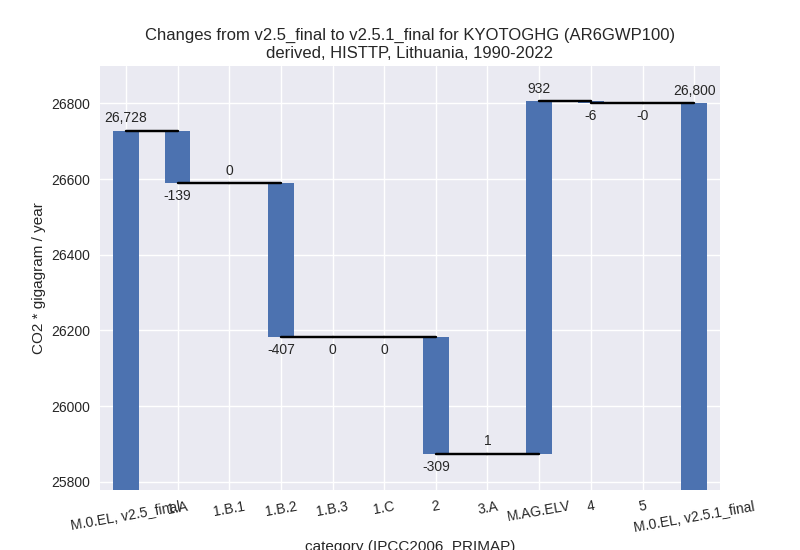
In the third party priority scenario the following sector-gas combinations have the highest absolute impact on national total KyotoGHG (AR6GWP100) emissions in 1990-2022 (top 5):
- 1: M.AG.ELV, N2O with 678.64 Gg CO2 / year (25.1%)
- 2: 1.B.2, CH4 with -407.26 Gg CO2 / year (-71.5%)
- 3: M.AG.ELV, CO2 with 252.76 Gg CO2 / year (565.0%)
- 4: 2, CO2 with -239.89 Gg CO2 / year (-11.2%)
- 5: 1.A, CO2 with -141.45 Gg CO2 / year (-1.0%)
Notes on data changes
Here we list notes explaining important emissions changes for the country. ’' means that the following text only applies to the TP time series, while means that it only applies to the CR scenario. Otherwise the note applies to both scenarios.
- 2, N2O: EDGAR 8.0 emissions in 2.B (chemical industry) are much lower than in EDGAR 7.0 for 2019 and the following years.
- M.AG.ELV, N2O: FAO 2023 emissions are much higher than FAO 2022 for all years.
Changes by sector and gas
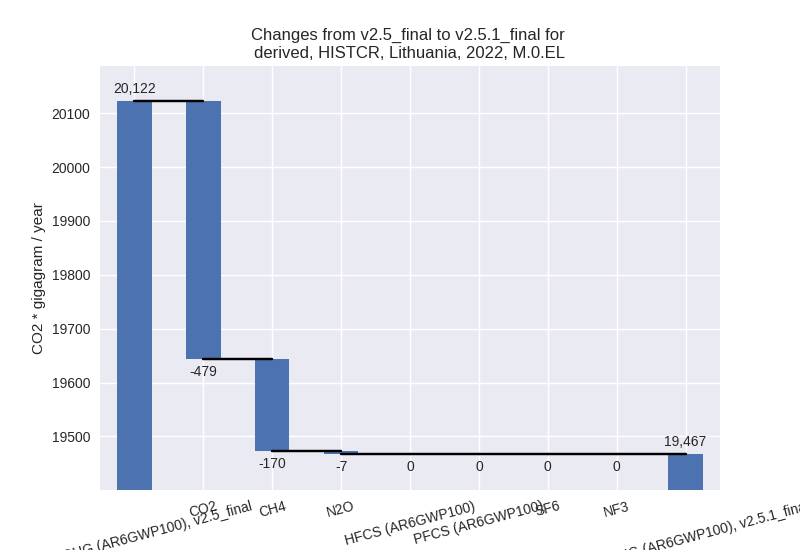
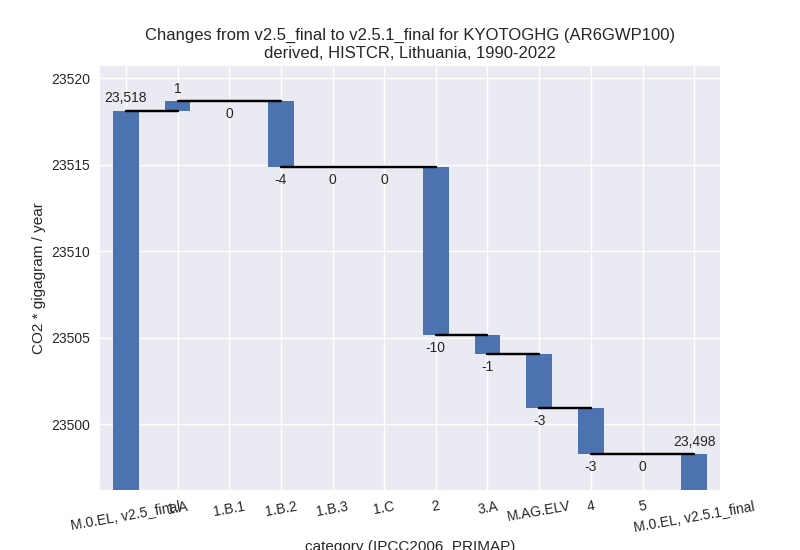
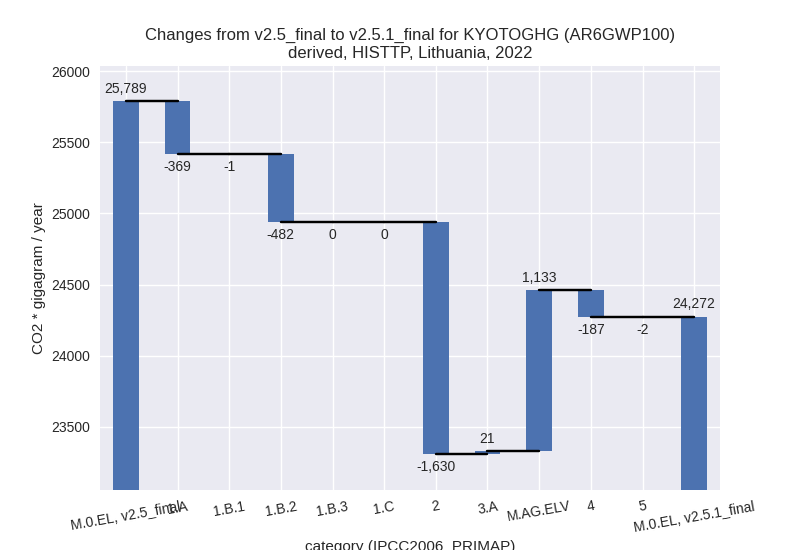
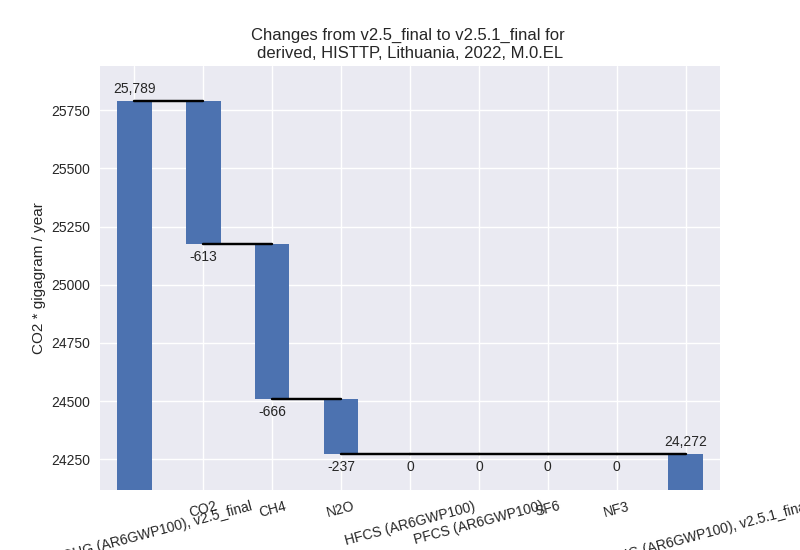
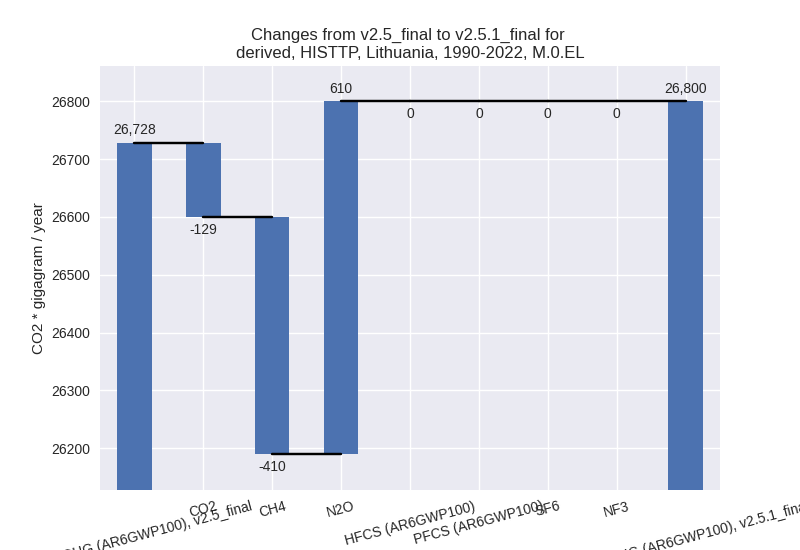
For each scenario and time frame the changes are displayed for all individual sectors and all individual gases. In the sector plot we use aggregate Kyoto GHGs in AR6GWP100. In the gas plot we usenational total emissions without LULUCF. ## country reported scenario
2022

1990-2022

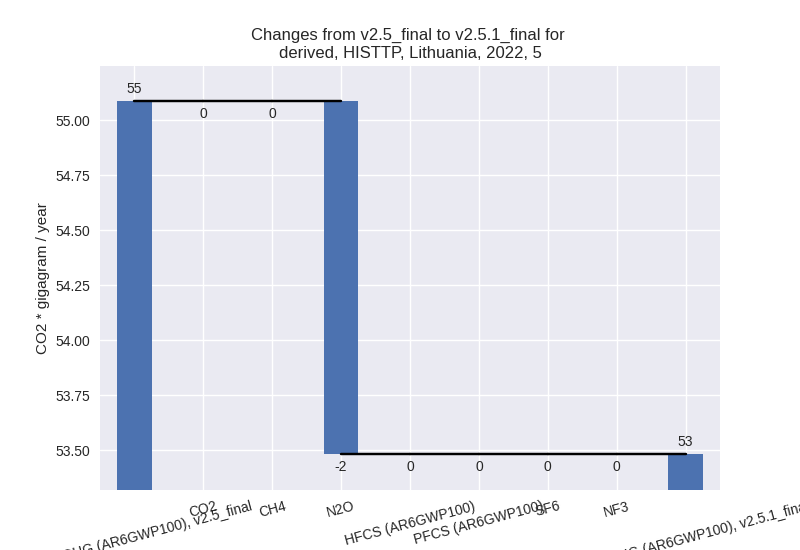
third party scenario
2022
1990-2022
Detailed changes for the scenarios:
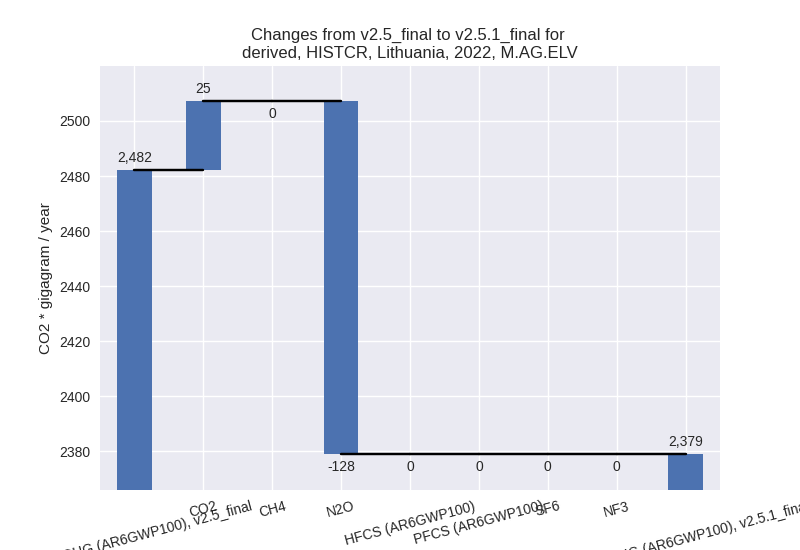
country reported scenario (HISTCR):
Most important changes per time frame
For 2022 the following sector-gas combinations have the highest absolute impact on national total KyotoGHG (AR6GWP100) emissions in 2022 (top 5):
- 1: 2, CO2 with -435.22 Gg CO2 / year (-18.5%)
- 2: M.AG.ELV, N2O with -128.16 Gg CO2 / year (-5.4%)
- 3: 2, N2O with 114.61 Gg CO2 / year (inf%)
- 4: 4, CH4 with -89.77 Gg CO2 / year (-11.7%)
- 5: 1.B.2, CO2 with -68.47 Gg CO2 / year (-27.4%)
For 1990-2022 the following sector-gas combinations have the highest absolute impact on national total KyotoGHG (AR6GWP100) emissions in 1990-2022 (top 5):
- 1: 2, CO2 with -13.19 Gg CO2 / year (-0.7%)
- 2: M.AG.ELV, N2O with -3.88 Gg CO2 / year (-0.2%)
- 3: 2, N2O with 3.47 Gg CO2 / year (0.4%)
- 4: 4, CH4 with -2.72 Gg CO2 / year (-0.2%)
- 5: 1.B.2, CO2 with -2.07 Gg CO2 / year (-1.4%)
Changes in the main sectors for aggregate KyotoGHG (AR6GWP100) are
- 1: Total sectoral emissions in 2022 are 11678.91 Gg CO2 / year which is 60.0% of M.0.EL emissions. 2022 Emissions have changed by -0.9% (-107.36 Gg CO2 / year). 1990-2022 Emissions have changed by -0.0% (-3.25 Gg CO2 / year).
- 2: Total sectoral emissions in 2022 are 2670.78 Gg
CO2 / year which is 13.7% of M.0.EL emissions. 2022 Emissions have
changed by -10.7% (-320.61 Gg CO2 /
year). 1990-2022 Emissions have changed by -0.3% (-9.72 Gg CO2 / year). For 2022 the
changes per gas
are:

- M.AG: Total sectoral emissions in 2022 are 4368.34
Gg CO2 / year which is 22.4% of M.0.EL emissions. 2022 Emissions have
changed by -3.1% (-138.45 Gg CO2 /
year). 1990-2022 Emissions have changed by -0.1% (-4.20 Gg CO2 / year). For 2022 the
changes per gas
are:

The changes come from the following subsectors:- 3.A: Total sectoral emissions in 2022 are 1989.34 Gg CO2 / year which is 45.5% of category M.AG emissions. 2022 Emissions have changed by -1.7% (-35.37 Gg CO2 / year). 1990-2022 Emissions have changed by -0.0% (-1.07 Gg CO2 / year).
- M.AG.ELV: Total sectoral emissions in 2022 are
2379.00 Gg CO2 / year which is 54.5% of category M.AG emissions. 2022
Emissions have changed by -4.2%
(-103.09 Gg CO2 / year). 1990-2022 Emissions have changed by -0.2% (-3.12 Gg CO2 / year). For 2022 the
changes per gas
are:
There is no subsector information available in PRIMAP-hist.
- 4: Total sectoral emissions in 2022 are 748.83 Gg
CO2 / year which is 3.8% of M.0.EL emissions. 2022 Emissions have
changed by -10.6% (-89.04 Gg CO2 /
year). 1990-2022 Emissions have changed by -0.2% (-2.70 Gg CO2 / year). For 2022 the
changes per gas
are:

- 5: No data
third party scenario (HISTTP):
Most important changes per time frame
For 2022 the following sector-gas combinations have the highest absolute impact on national total KyotoGHG (AR6GWP100) emissions in 2022 (top 5):
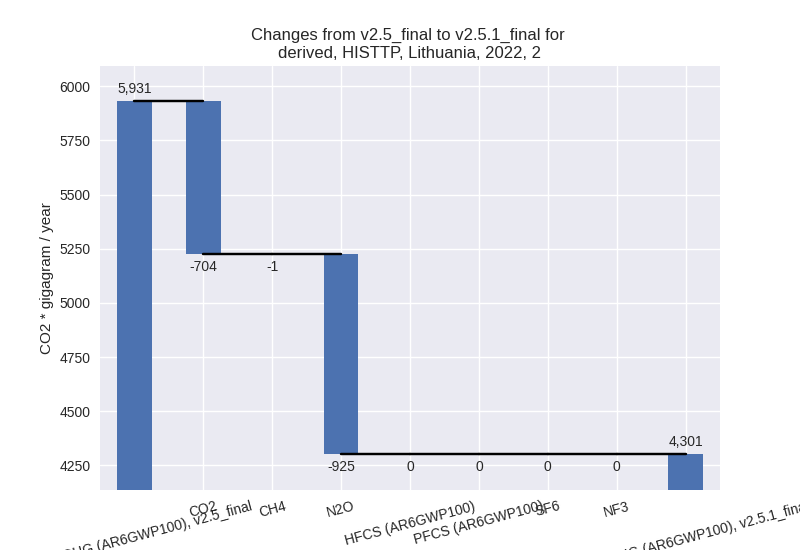
- 1: 2, N2O with -924.79 Gg CO2 / year (-37.5%)
- 2: 2, CO2 with -703.60 Gg CO2 / year (-24.8%)
- 3: M.AG.ELV, N2O with 688.10 Gg CO2 / year (23.0%)
- 4: 1.B.2, CH4 with -482.44 Gg CO2 / year (-76.1%)
- 5: M.AG.ELV, CO2 with 443.14 Gg CO2 / year (1282.9%)
For 1990-2022 the following sector-gas combinations have the highest absolute impact on national total KyotoGHG (AR6GWP100) emissions in 1990-2022 (top 5):
- 1: M.AG.ELV, N2O with 678.64 Gg CO2 / year (25.1%)
- 2: 1.B.2, CH4 with -407.26 Gg CO2 / year (-71.5%)
- 3: M.AG.ELV, CO2 with 252.76 Gg CO2 / year (565.0%)
- 4: 2, CO2 with -239.89 Gg CO2 / year (-11.2%)
- 5: 1.A, CO2 with -141.45 Gg CO2 / year (-1.0%)
Changes in the main sectors for aggregate KyotoGHG (AR6GWP100) are
- 1: Total sectoral emissions in 2022 are 12818.86 Gg
CO2 / year which is 52.8% of M.0.EL emissions. 2022 Emissions have
changed by -6.2% (-852.40 Gg CO2 /
year). 1990-2022 Emissions have changed by -3.6% (-546.39 Gg CO2 / year). For 2022
the changes per gas
are:

For 1990-2022 the changes per gas are: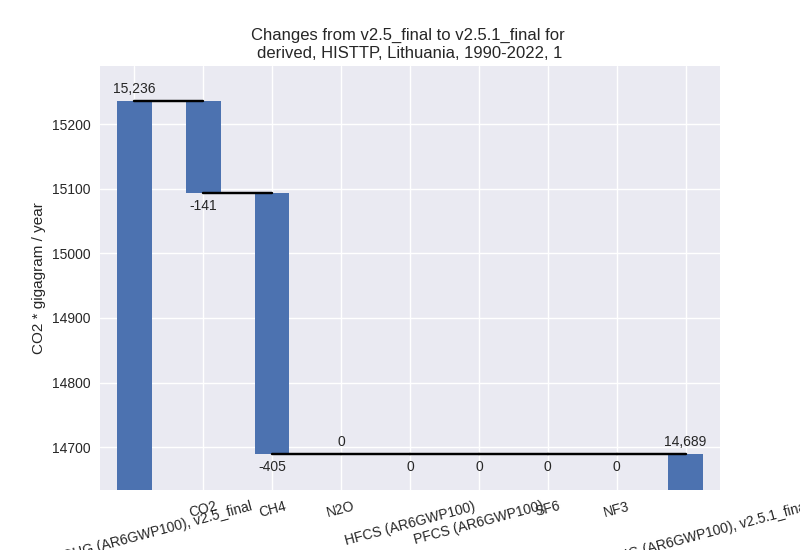
The changes come from the following subsectors:- 1.A: Total sectoral emissions in 2022 are 12665.88
Gg CO2 / year which is 98.8% of category 1 emissions. 2022 Emissions
have changed by -2.8% (-369.26 Gg
CO2 / year). 1990-2022 Emissions have changed by -1.0% (-139.45 Gg CO2 / year). For 2022
the changes per gas
are:

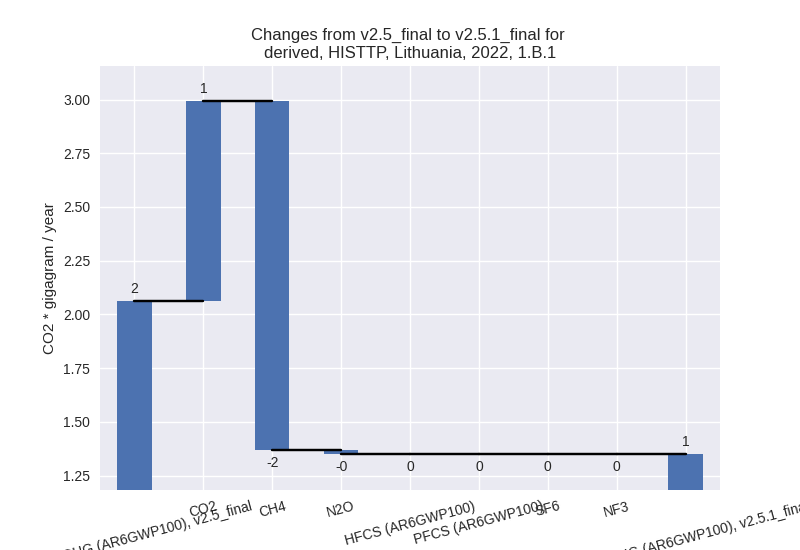
There is no subsector information available in PRIMAP-hist. - 1.B.1: Total sectoral emissions in 2022 are 1.35 Gg
CO2 / year which is 0.0% of category 1 emissions. 2022 Emissions have
changed by -34.5% (-0.71 Gg CO2 /
year). 1990-2022 Emissions have changed by 4.8% (0.32 Gg CO2 / year). For 2022 the
changes per gas
are:
For 1990-2022 the changes per gas are: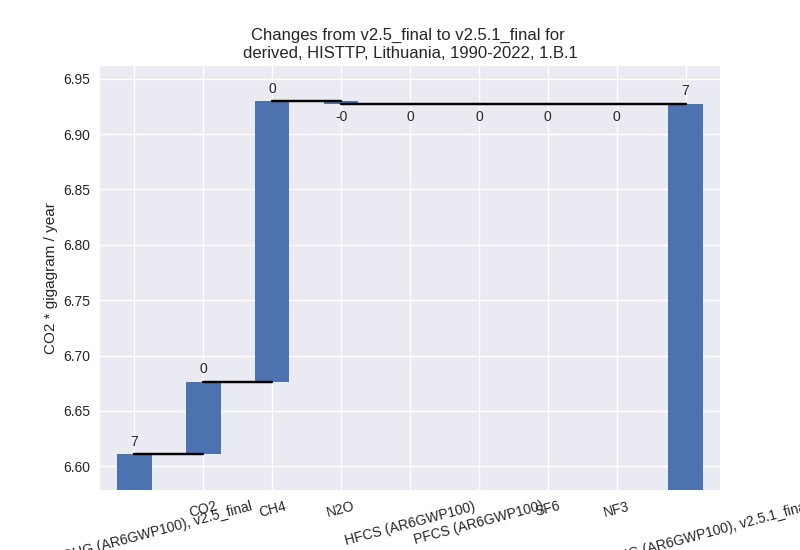
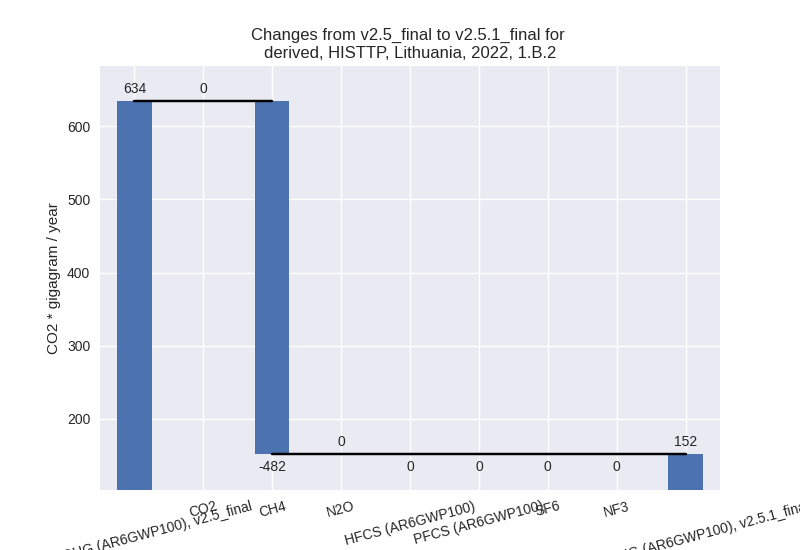
There is no subsector information available in PRIMAP-hist. - 1.B.2: Total sectoral emissions in 2022 are 151.63
Gg CO2 / year which is 1.2% of category 1 emissions. 2022 Emissions have
changed by -76.1% (-482.42 Gg CO2 /
year). 1990-2022 Emissions have changed by -70.5% (-407.26 Gg CO2 / year). For 2022
the changes per gas
are:
For 1990-2022 the changes per gas are:
There is no subsector information available in PRIMAP-hist.
- 1.A: Total sectoral emissions in 2022 are 12665.88
Gg CO2 / year which is 98.8% of category 1 emissions. 2022 Emissions
have changed by -2.8% (-369.26 Gg
CO2 / year). 1990-2022 Emissions have changed by -1.0% (-139.45 Gg CO2 / year). For 2022
the changes per gas
are:
- 2: Total sectoral emissions in 2022 are 4301.17 Gg
CO2 / year which is 17.7% of M.0.EL emissions. 2022 Emissions have
changed by -27.5% (-1629.64 Gg CO2 /
year). 1990-2022 Emissions have changed by -7.7% (-308.64 Gg CO2 / year). For 2022
the changes per gas
are:
For 1990-2022 the changes per gas are:
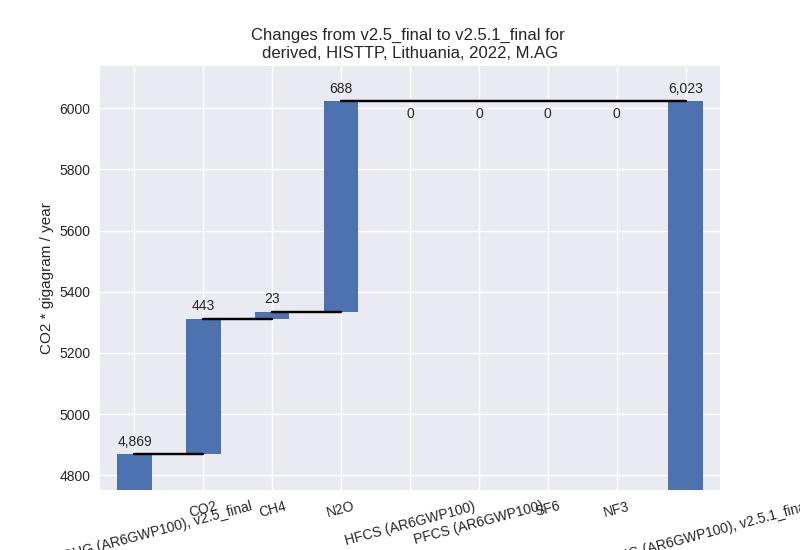
- M.AG: Total sectoral emissions in 2022 are 6023.04
Gg CO2 / year which is 24.8% of M.0.EL emissions. 2022 Emissions have
changed by 23.7% (1154.49 Gg CO2 /
year). 1990-2022 Emissions have changed by 15.9% (932.79 Gg CO2 / year). For 2022 the
changes per gas
are:
For 1990-2022 the changes per gas are:
The changes come from the following subsectors:- 3.A: Total sectoral emissions in 2022 are 1830.44 Gg CO2 / year which is 30.4% of category M.AG emissions. 2022 Emissions have changed by 1.2% (21.14 Gg CO2 / year). 1990-2022 Emissions have changed by 0.0% (1.15 Gg CO2 / year).
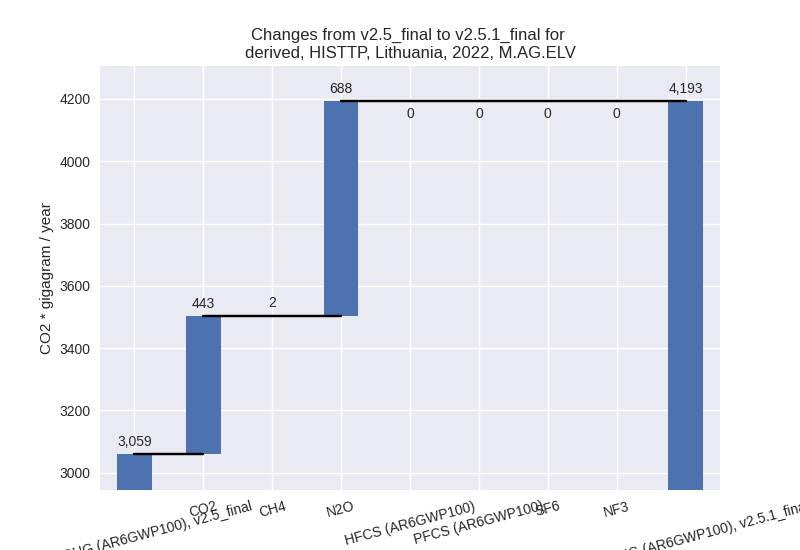
- M.AG.ELV: Total sectoral emissions in 2022 are
4192.60 Gg CO2 / year which is 69.6% of category M.AG emissions. 2022
Emissions have changed by 37.0%
(1133.35 Gg CO2 / year). 1990-2022 Emissions have changed by 33.7% (931.64 Gg CO2 / year). For 2022 the
changes per gas
are:
For 1990-2022 the changes per gas are:
There is no subsector information available in PRIMAP-hist.
- 4: Total sectoral emissions in 2022 are 1075.48 Gg
CO2 / year which is 4.4% of M.0.EL emissions. 2022 Emissions have
changed by -14.8% (-187.34 Gg CO2 /
year). 1990-2022 Emissions have changed by -0.4% (-5.68 Gg CO2 / year). For 2022 the
changes per gas
are:

- 5: Total sectoral emissions in 2022 are 53.48 Gg
CO2 / year which is 0.2% of M.0.EL emissions. 2022 Emissions have
changed by -2.9% (-1.61 Gg CO2 /
year). 1990-2022 Emissions have changed by -0.1% (-0.05 Gg CO2 / year). For 2022 the
changes per gas
are: