Changes in PRIMAP-hist v2.5.1_final compared to v2.5_final for Latvia
2024-02-29
Johannes Gütschow
Change analysis for Latvia for PRIMAP-hist v2.5.1_final compared to v2.5_final
Overview over emissions by sector and gas
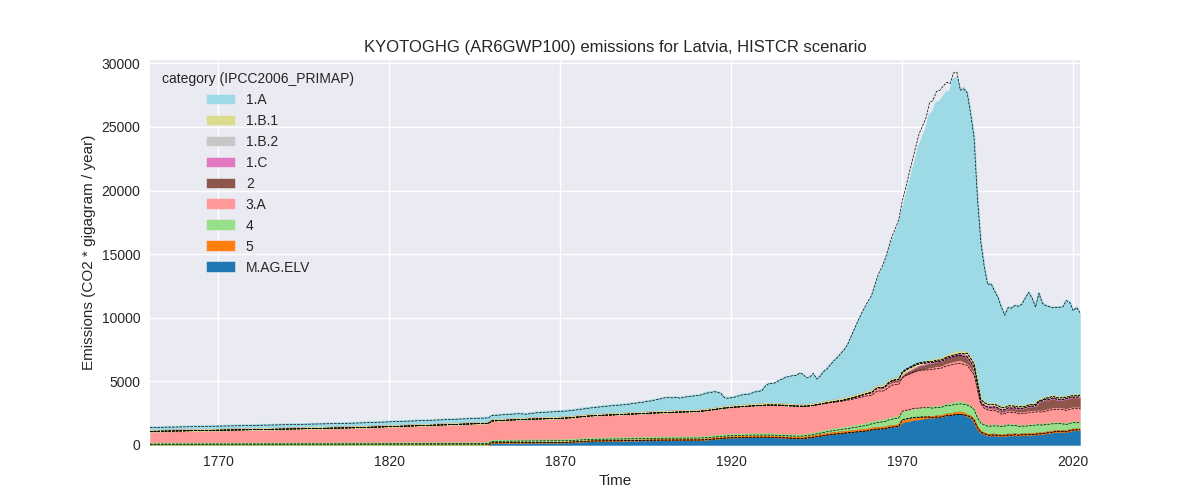
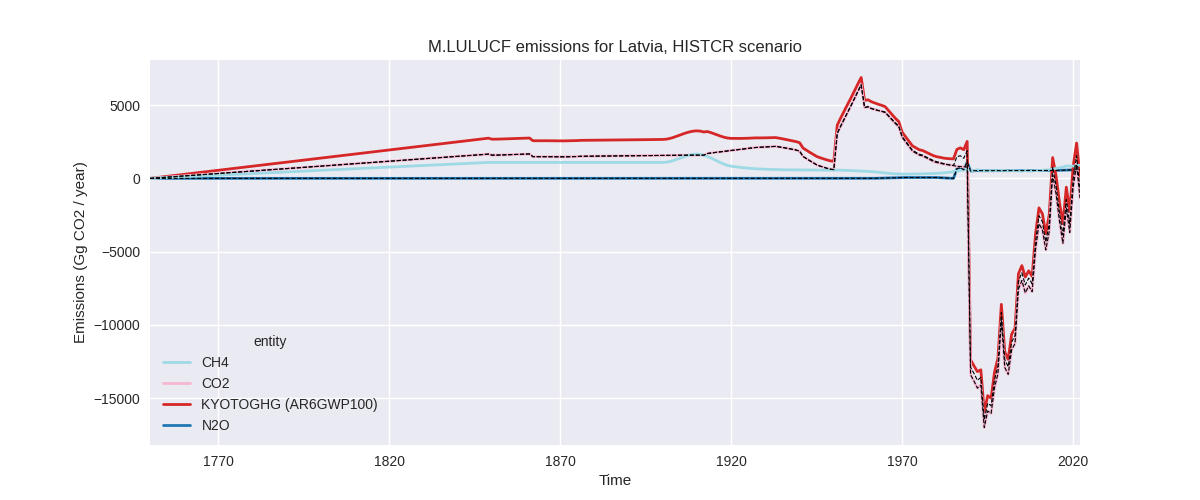
The following figures show the aggregate national total emissions excluding LULUCF AR6GWP100 for the country reported priority scenario. The dotted linesshow the v2.5_final data.

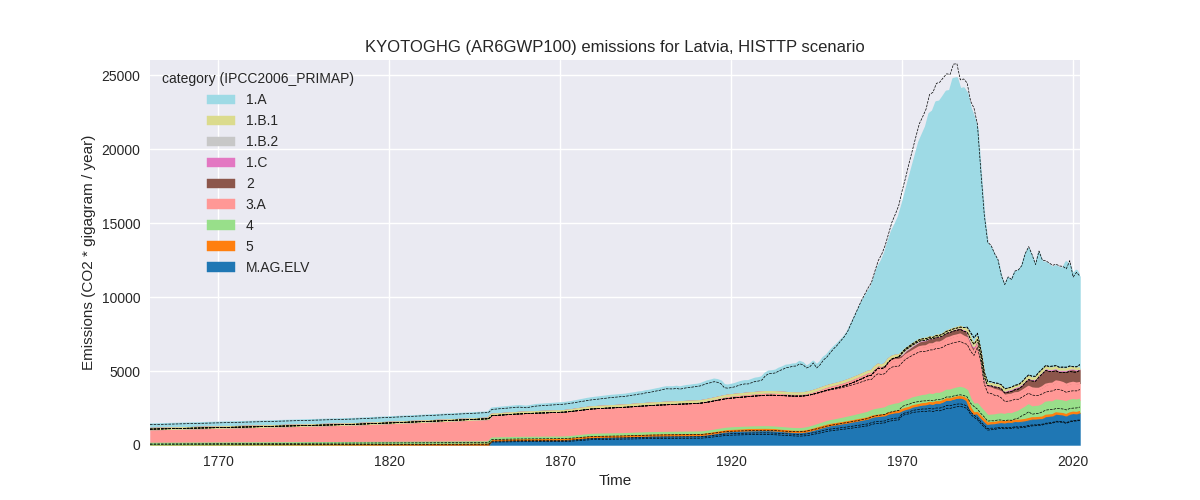
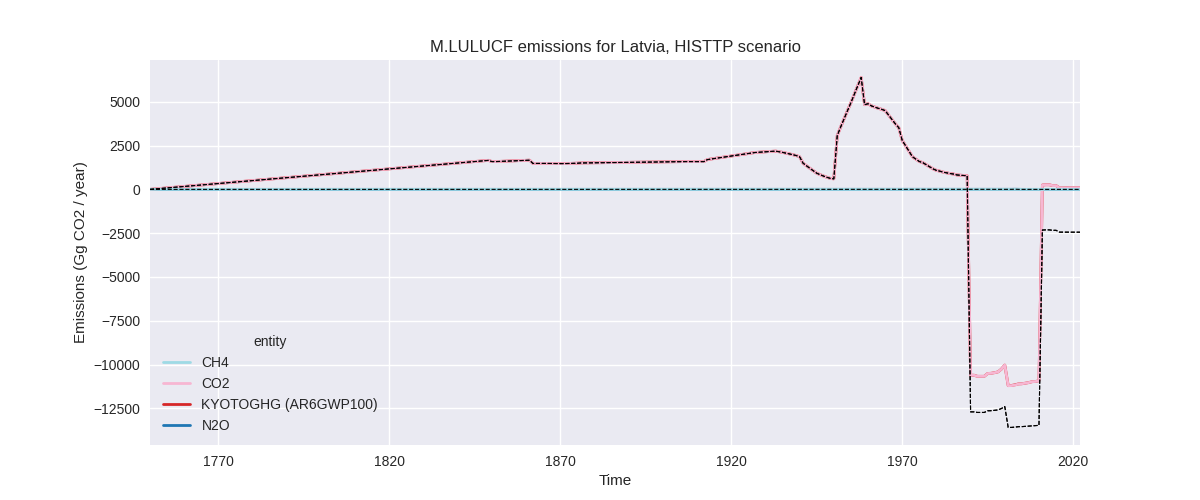
The following figures show the aggregate national total emissions excluding LULUCF AR6GWP100 for the third party priority scenario. The dotted linesshow the v2.5_final data.

Overview over changes
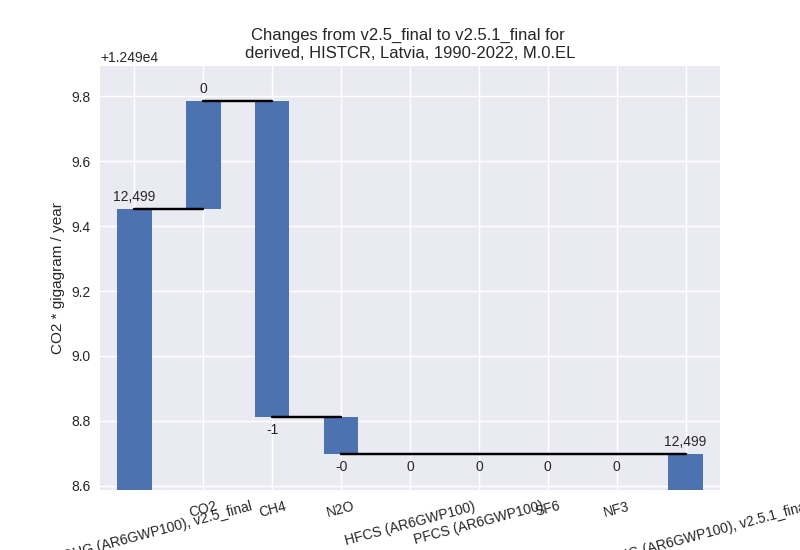
In the country reported priority scenario we have the following changes for aggregate Kyoto GHG and national total emissions excluding LULUCF (M.0.EL):
- Emissions in 2022 have changed by -0.2%% (-24.90 Gg CO2 / year)
- Emissions in 1990-2022 have changed by -0.0%% (-0.75 Gg CO2 / year)
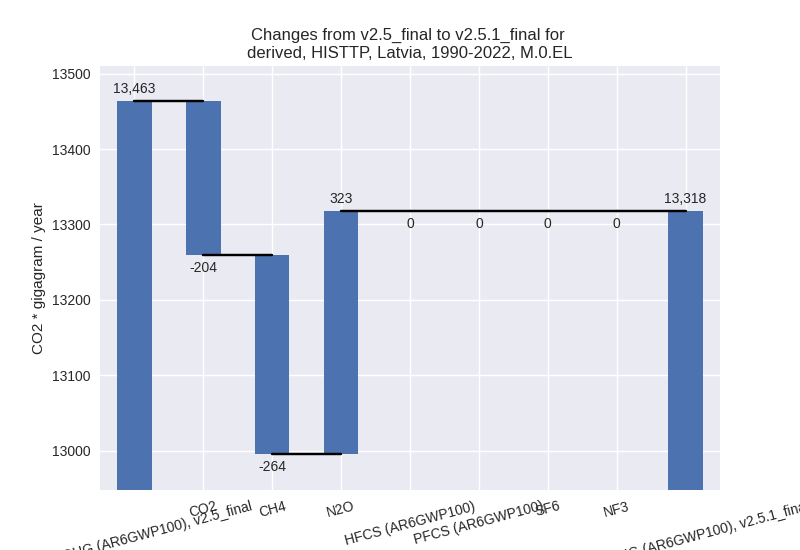
In the third party priority scenario we have the following changes for aggregate Kyoto GHG and national total emissions excluding LULUCF (M.0.EL):
- Emissions in 2022 have changed by -0.1%% (-15.69 Gg CO2 / year)
- Emissions in 1990-2022 have changed by -1.1%% (-145.70 Gg CO2 / year)
Most important changes per scenario and time frame
In the country reported priority scenario the following sector-gas combinations have the highest absolute impact on national total KyotoGHG (AR6GWP100) emissions in 2022 (top 5):
- 1: 3.A, CH4 with -55.15 Gg CO2 / year (-5.1%)
- 2: 1.A, CH4 with 23.04 Gg CO2 / year (12.9%)
- 3: 4, CH4 with 14.11 Gg CO2 / year (2.8%)
- 4: 1.B.2, CH4 with -14.11 Gg CO2 / year (-11.3%)
- 5: M.AG.ELV, CO2 with 13.81 Gg CO2 / year (19.8%)
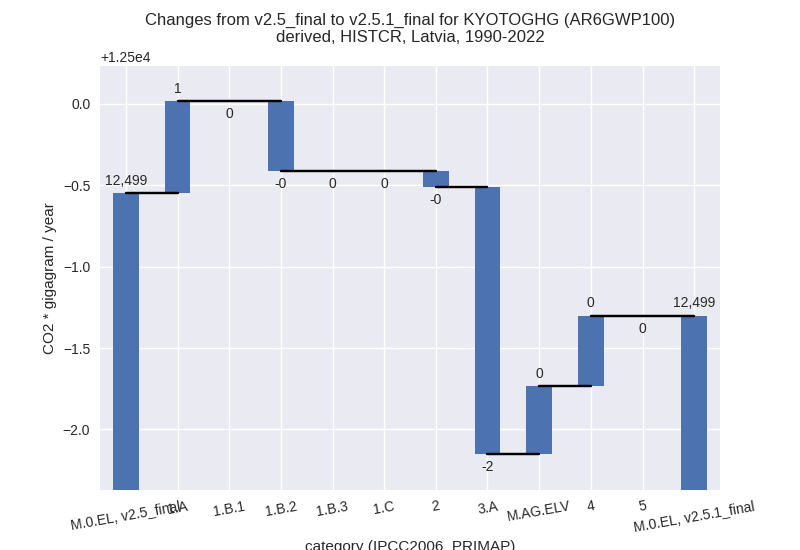
In the country reported priority scenario the following sector-gas combinations have the highest absolute impact on national total KyotoGHG (AR6GWP100) emissions in 1990-2022 (top 5):
- 1: 3.A, CH4 with -1.67 Gg CO2 / year (-0.1%)
- 2: 1.A, CH4 with 0.70 Gg CO2 / year (0.2%)
- 3: 4, CH4 with 0.43 Gg CO2 / year (0.1%)
- 4: 1.B.2, CH4 with -0.43 Gg CO2 / year (-0.3%)
- 5: M.AG.ELV, CO2 with 0.42 Gg CO2 / year (1.1%)
In the third party priority scenario the following sector-gas combinations have the highest absolute impact on national total KyotoGHG (AR6GWP100) emissions in 2022 (top 5):
- 1: 2, CO2 with -382.89 Gg CO2 / year (-37.9%)
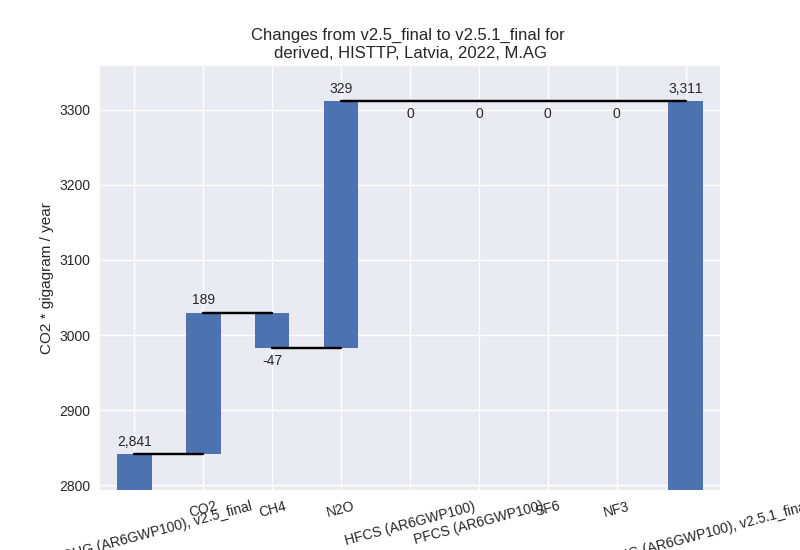
- 2: M.AG.ELV, N2O with 331.27 Gg CO2 / year (20.5%)
- 3: 1.B.2, CH4 with -309.25 Gg CO2 / year (-85.5%)
- 4: 1.A, CO2 with 237.69 Gg CO2 / year (4.3%)
- 5: M.AG.ELV, CO2 with 188.51 Gg CO2 / year (720.1%)
In the third party priority scenario the following sector-gas combinations have the highest absolute impact on national total KyotoGHG (AR6GWP100) emissions in 1990-2022 (top 5):
- 1: 2, CO2 with -323.78 Gg CO2 / year (-43.1%)
- 2: M.AG.ELV, N2O with 322.03 Gg CO2 / year (24.1%)
- 3: 1.B.2, CH4 with -263.69 Gg CO2 / year (-81.5%)
- 4: M.AG.ELV, CO2 with 89.21 Gg CO2 / year (409.2%)
- 5: 1.A, CO2 with 30.29 Gg CO2 / year (0.4%)
Notes on data changes
Here we list notes explaining important emissions changes for the country. ’' means that the following text only applies to the TP time series, while means that it only applies to the CR scenario. Otherwise the note applies to both scenarios.
- M.AG.ELV, N2O: Emissions in FAO 2023 are higher than in FAO 2022.
- 1.B.2, CH4: Emissions in EDGAR 8.0 are much lower than in EDGAR 7.0.
- 1.A, CO2: A change in downscaling of CDIAC data for the former Soviet Union to its member states has lowered pre-1990 emissions. The shares are now calculated based on the shares in the first year with data for the individual states instead of a multi year average. This is more realistic as the rapid emissions decline after 1990 differs by country.
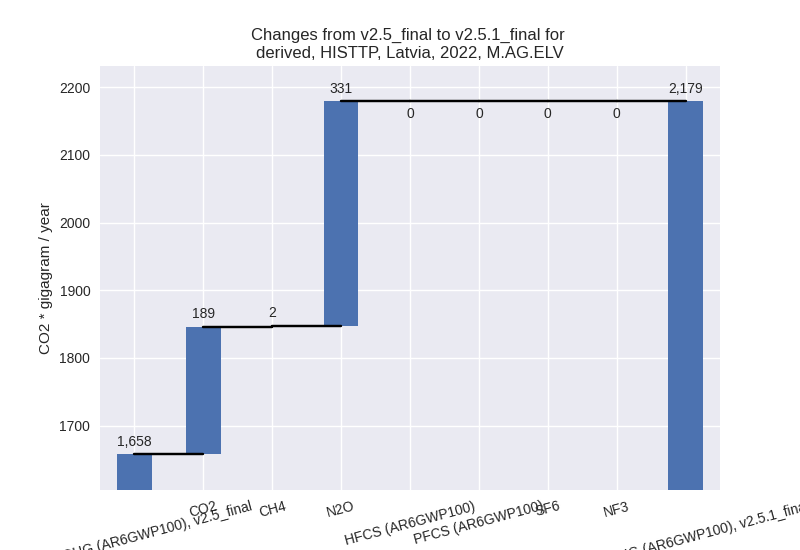
Changes by sector and gas
For each scenario and time frame the changes are displayed for all individual sectors and all individual gases. In the sector plot we use aggregate Kyoto GHGs in AR6GWP100. In the gas plot we usenational total emissions without LULUCF. ## country reported scenario
2022


1990-2022
third party scenario
2022

1990-2022

Detailed changes for the scenarios:
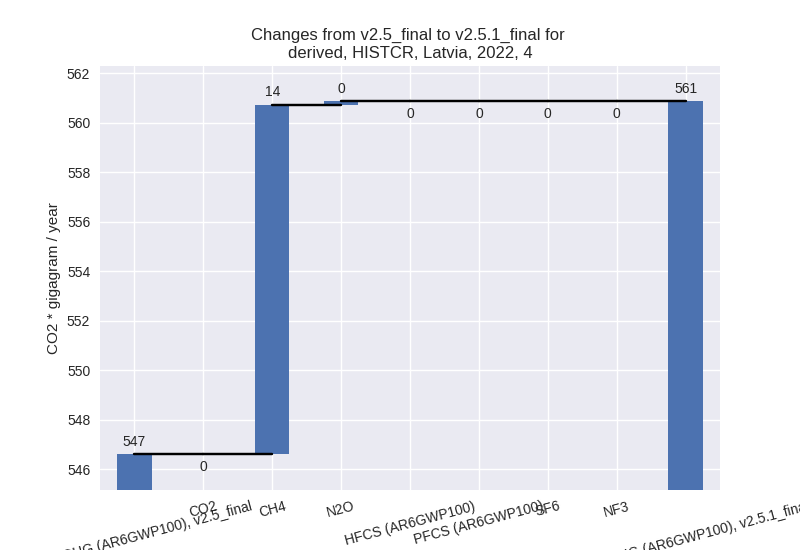
country reported scenario (HISTCR):
Most important changes per time frame
For 2022 the following sector-gas combinations have the highest absolute impact on national total KyotoGHG (AR6GWP100) emissions in 2022 (top 5):
- 1: 3.A, CH4 with -55.15 Gg CO2 / year (-5.1%)
- 2: 1.A, CH4 with 23.04 Gg CO2 / year (12.9%)
- 3: 4, CH4 with 14.11 Gg CO2 / year (2.8%)
- 4: 1.B.2, CH4 with -14.11 Gg CO2 / year (-11.3%)
- 5: M.AG.ELV, CO2 with 13.81 Gg CO2 / year (19.8%)
For 1990-2022 the following sector-gas combinations have the highest absolute impact on national total KyotoGHG (AR6GWP100) emissions in 1990-2022 (top 5):
- 1: 3.A, CH4 with -1.67 Gg CO2 / year (-0.1%)
- 2: 1.A, CH4 with 0.70 Gg CO2 / year (0.2%)
- 3: 4, CH4 with 0.43 Gg CO2 / year (0.1%)
- 4: 1.B.2, CH4 with -0.43 Gg CO2 / year (-0.3%)
- 5: M.AG.ELV, CO2 with 0.42 Gg CO2 / year (1.1%)
Changes in the main sectors for aggregate KyotoGHG (AR6GWP100) are
- 1: Total sectoral emissions in 2022 are 6605.95 Gg CO2 / year which is 63.7% of M.0.EL emissions. 2022 Emissions have changed by 0.1% (4.48 Gg CO2 / year). 1990-2022 Emissions have changed by 0.0% (0.14 Gg CO2 / year).
- 2: Total sectoral emissions in 2022 are 911.24 Gg CO2 / year which is 8.8% of M.0.EL emissions. 2022 Emissions have changed by -0.3% (-3.20 Gg CO2 / year). 1990-2022 Emissions have changed by -0.0% (-0.10 Gg CO2 / year).
- M.AG: Total sectoral emissions in 2022 are 2298.95 Gg CO2 / year which is 22.2% of M.0.EL emissions. 2022 Emissions have changed by -1.7% (-40.44 Gg CO2 / year). 1990-2022 Emissions have changed by -0.1% (-1.23 Gg CO2 / year).
- 4: Total sectoral emissions in 2022 are 560.86 Gg
CO2 / year which is 5.4% of M.0.EL emissions. 2022 Emissions have
changed by 2.6% (14.26 Gg CO2 /
year). 1990-2022 Emissions have changed by 0.1% (0.43 Gg CO2 / year). For 2022 the
changes per gas
are:
- 5: No data
third party scenario (HISTTP):
Most important changes per time frame
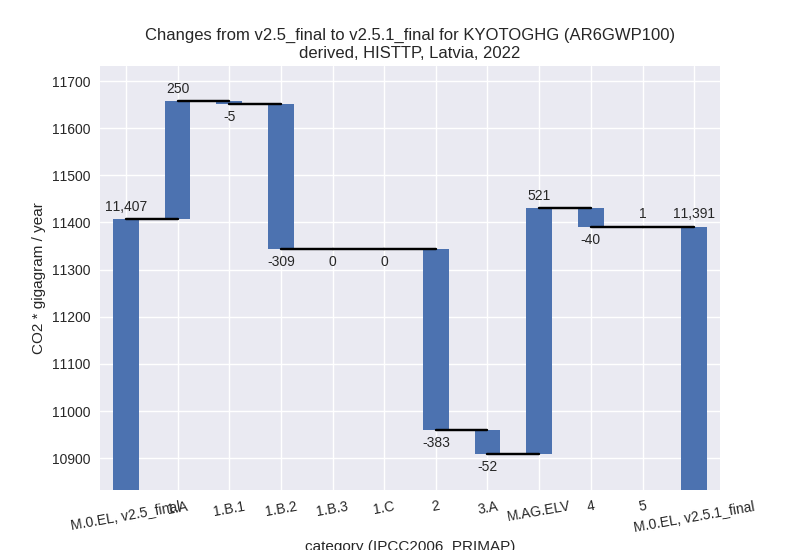
For 2022 the following sector-gas combinations have the highest absolute impact on national total KyotoGHG (AR6GWP100) emissions in 2022 (top 5):
- 1: 2, CO2 with -382.89 Gg CO2 / year (-37.9%)
- 2: M.AG.ELV, N2O with 331.27 Gg CO2 / year (20.5%)
- 3: 1.B.2, CH4 with -309.25 Gg CO2 / year (-85.5%)
- 4: 1.A, CO2 with 237.69 Gg CO2 / year (4.3%)
- 5: M.AG.ELV, CO2 with 188.51 Gg CO2 / year (720.1%)
For 1990-2022 the following sector-gas combinations have the highest absolute impact on national total KyotoGHG (AR6GWP100) emissions in 1990-2022 (top 5):
- 1: 2, CO2 with -323.78 Gg CO2 / year (-43.1%)
- 2: M.AG.ELV, N2O with 322.03 Gg CO2 / year (24.1%)
- 3: 1.B.2, CH4 with -263.69 Gg CO2 / year (-81.5%)
- 4: M.AG.ELV, CO2 with 89.21 Gg CO2 / year (409.2%)
- 5: 1.A, CO2 with 30.29 Gg CO2 / year (0.4%)
Changes in the main sectors for aggregate KyotoGHG (AR6GWP100) are
- 1: Total sectoral emissions in 2022 are 6282.12 Gg
CO2 / year which is 55.1% of M.0.EL emissions. 2022 Emissions have
changed by -1.0% (-63.88 Gg CO2 /
year). 1990-2022 Emissions have changed by -2.6% (-230.62 Gg CO2 / year). For
1990-2022 the changes per gas
are:

The changes come from the following subsectors:- 1.A: Total sectoral emissions in 2022 are 6208.02
Gg CO2 / year which is 98.8% of category 1 emissions. 2022 Emissions
have changed by 4.2% (250.47 Gg CO2
/ year). 1990-2022 Emissions have changed by 0.4% (33.18 Gg CO2 / year). For 2022 the
changes per gas
are:

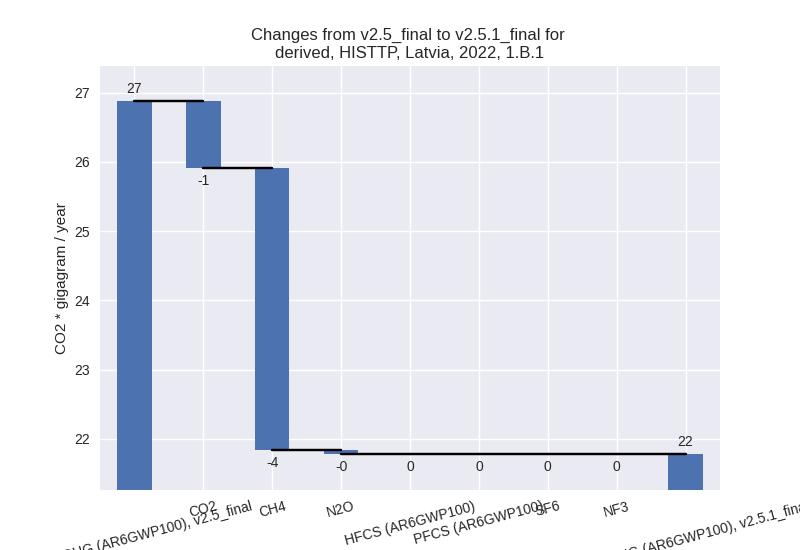
There is no subsector information available in PRIMAP-hist. - 1.B.1: Total sectoral emissions in 2022 are 21.78
Gg CO2 / year which is 0.3% of category 1 emissions. 2022 Emissions have
changed by -19.0% (-5.10 Gg CO2 /
year). 1990-2022 Emissions have changed by -0.5% (-0.11 Gg CO2 / year). For 2022 the
changes per gas
are:
There is no subsector information available in PRIMAP-hist. - 1.B.2: Total sectoral emissions in 2022 are 52.32
Gg CO2 / year which is 0.8% of category 1 emissions. 2022 Emissions have
changed by -85.5% (-309.25 Gg CO2 /
year). 1990-2022 Emissions have changed by -81.5% (-263.69 Gg CO2 / year). For 2022
the changes per gas
are:

For 1990-2022 the changes per gas are: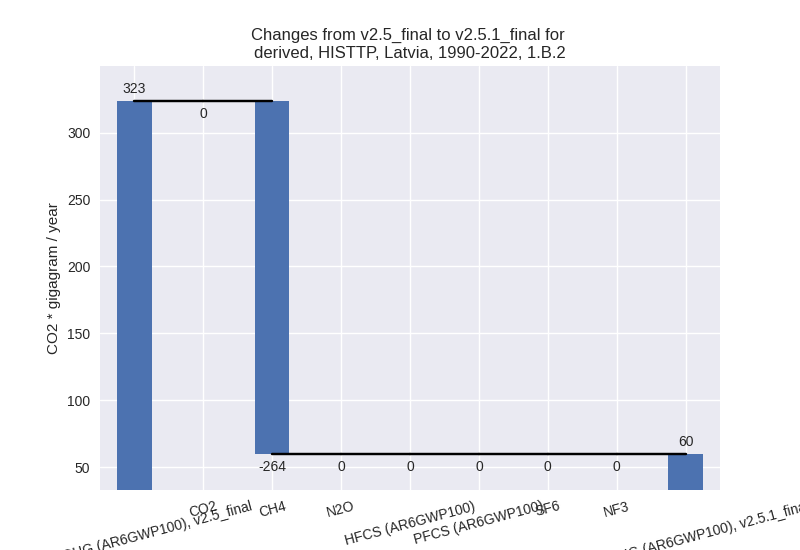
There is no subsector information available in PRIMAP-hist.
- 1.A: Total sectoral emissions in 2022 are 6208.02
Gg CO2 / year which is 98.8% of category 1 emissions. 2022 Emissions
have changed by 4.2% (250.47 Gg CO2
/ year). 1990-2022 Emissions have changed by 0.4% (33.18 Gg CO2 / year). For 2022 the
changes per gas
are:
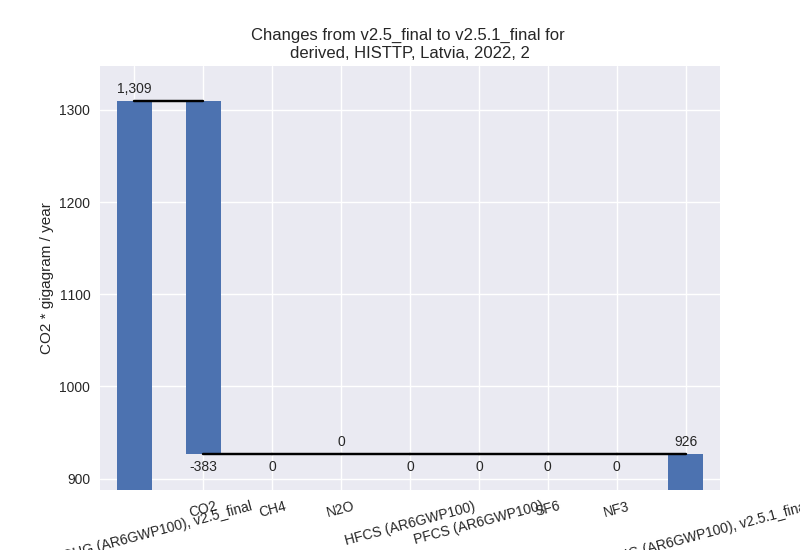
- 2: Total sectoral emissions in 2022 are 926.38 Gg
CO2 / year which is 8.1% of M.0.EL emissions. 2022 Emissions have
changed by -29.2% (-382.89 Gg CO2 /
year). 1990-2022 Emissions have changed by -35.4% (-323.78 Gg CO2 / year). For 2022
the changes per gas
are:
For 1990-2022 the changes per gas are: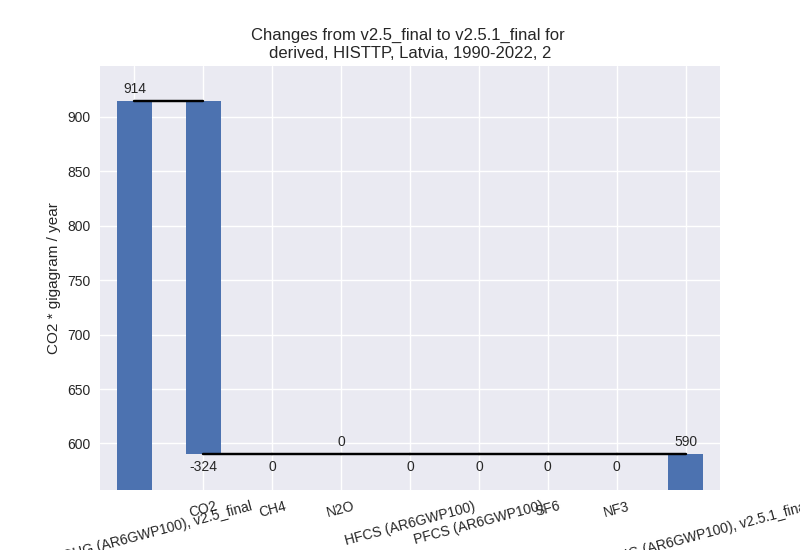
- M.AG: Total sectoral emissions in 2022 are 3311.22
Gg CO2 / year which is 29.1% of M.0.EL emissions. 2022 Emissions have
changed by 16.5% (469.83 Gg CO2 /
year). 1990-2022 Emissions have changed by 13.6% (409.88 Gg CO2 / year). For 2022 the
changes per gas
are:
For 1990-2022 the changes per gas are: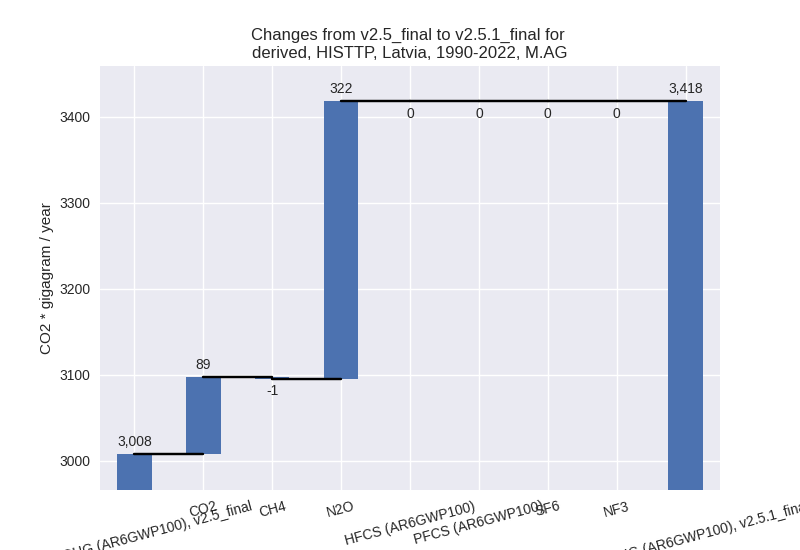
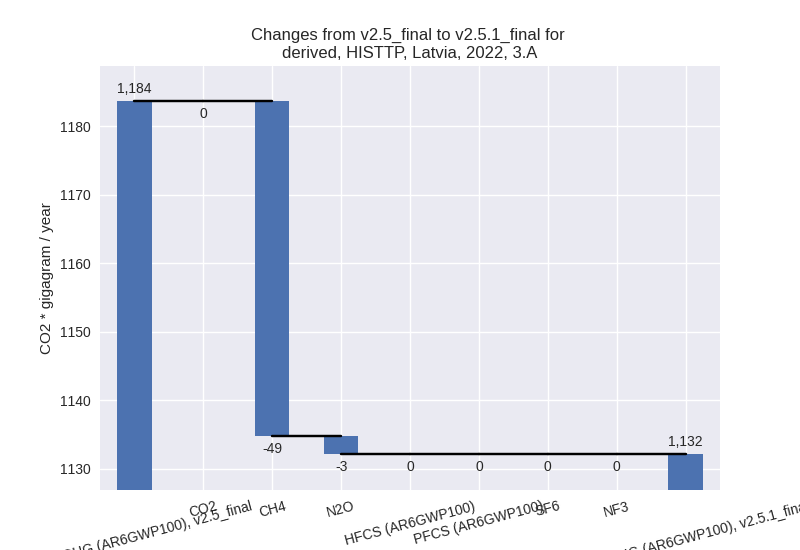
The changes come from the following subsectors:- 3.A: Total sectoral emissions in 2022 are 1132.16
Gg CO2 / year which is 34.2% of category M.AG emissions. 2022 Emissions
have changed by -4.4% (-51.51 Gg CO2
/ year). 1990-2022 Emissions have changed by -0.1% (-1.50 Gg CO2 / year). For 2022 the
changes per gas
are:
There is no subsector information available in PRIMAP-hist. - M.AG.ELV: Total sectoral emissions in 2022 are
2179.07 Gg CO2 / year which is 65.8% of category M.AG emissions. 2022
Emissions have changed by 31.4%
(521.34 Gg CO2 / year). 1990-2022 Emissions have changed by 30.1% (411.37 Gg CO2 / year). For 2022 the
changes per gas
are:
For 1990-2022 the changes per gas are:
There is no subsector information available in PRIMAP-hist.
- 3.A: Total sectoral emissions in 2022 are 1132.16
Gg CO2 / year which is 34.2% of category M.AG emissions. 2022 Emissions
have changed by -4.4% (-51.51 Gg CO2
/ year). 1990-2022 Emissions have changed by -0.1% (-1.50 Gg CO2 / year). For 2022 the
changes per gas
are:
- 4: Total sectoral emissions in 2022 are 832.56 Gg
CO2 / year which is 7.3% of M.0.EL emissions. 2022 Emissions have
changed by -4.5% (-39.52 Gg CO2 /
year). 1990-2022 Emissions have changed by -0.2% (-1.20 Gg CO2 / year). For 2022 the
changes per gas
are:

- 5: Total sectoral emissions in 2022 are 38.71 Gg
CO2 / year which is 0.3% of M.0.EL emissions. 2022 Emissions have
changed by 2.0% (0.77 Gg CO2 /
year). 1990-2022 Emissions have changed by 0.0% (0.02 Gg CO2 / year). For 2022 the
changes per gas
are:
