Changes in PRIMAP-hist v2.5.1_final compared to v2.5_final for Morocco
2024-02-29
Johannes Gütschow
Change analysis for Morocco for PRIMAP-hist v2.5.1_final compared to v2.5_final
Overview over emissions by sector and gas
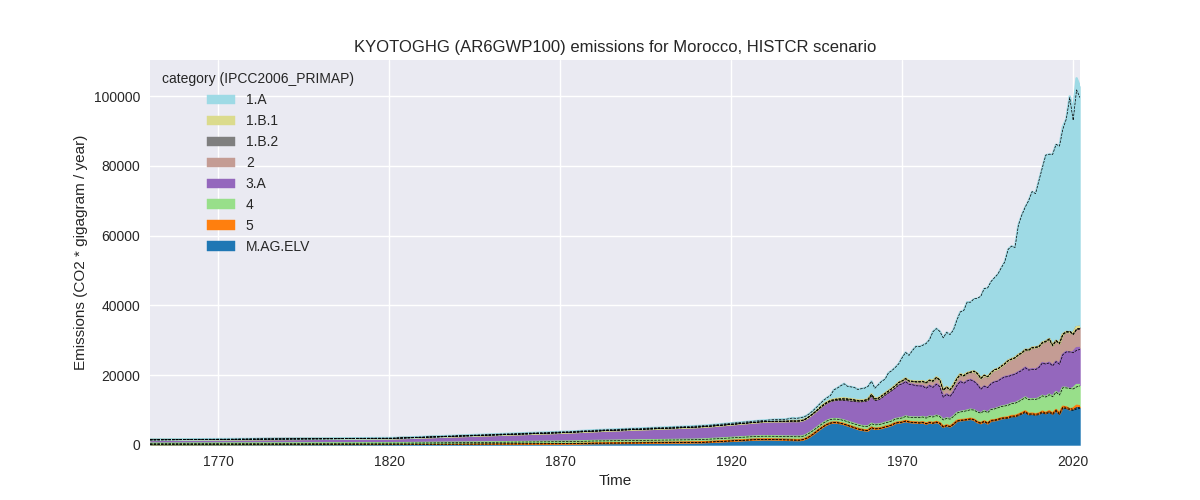
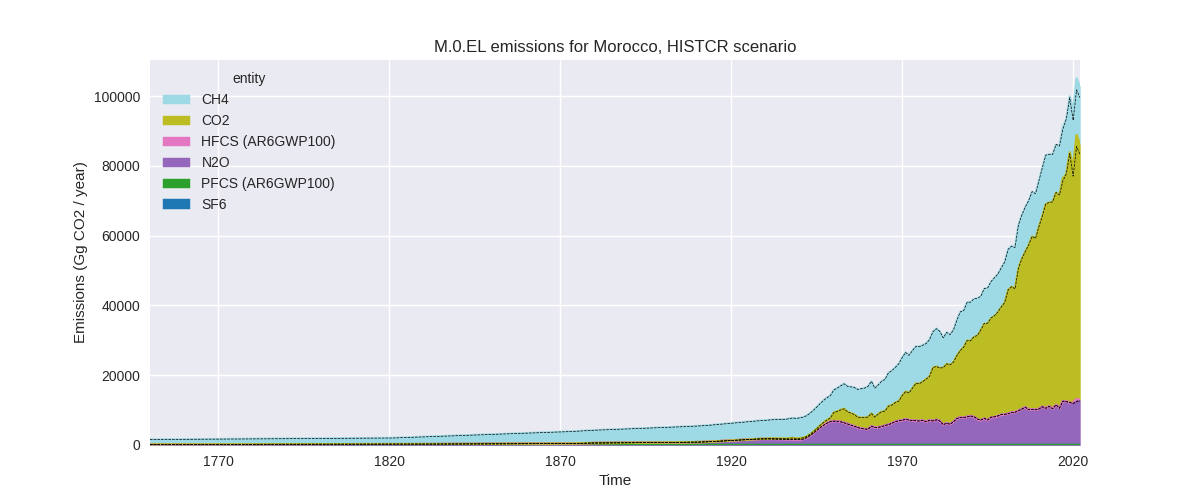
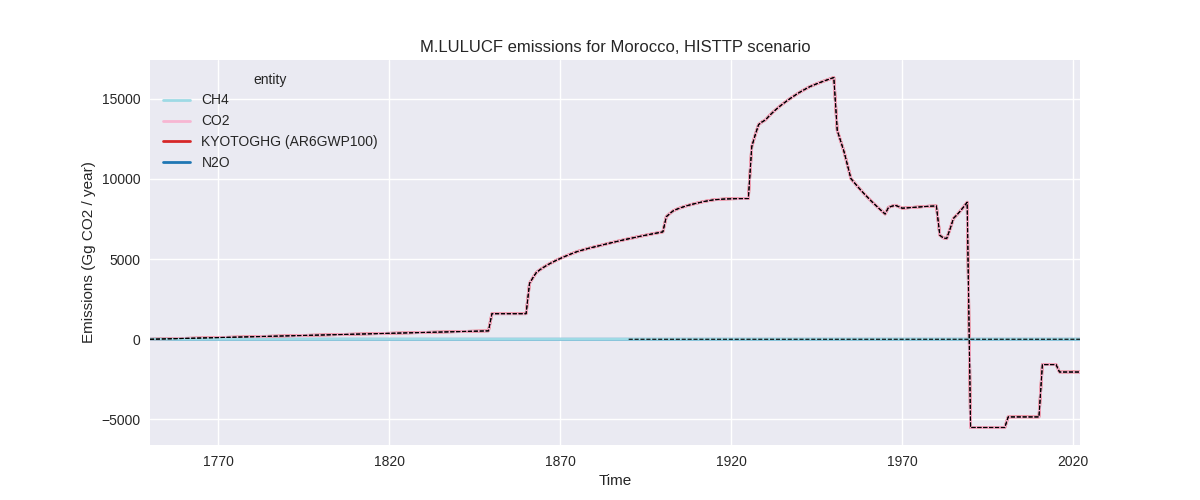
The following figures show the aggregate national total emissions excluding LULUCF AR6GWP100 for the country reported priority scenario. The dotted linesshow the v2.5_final data.
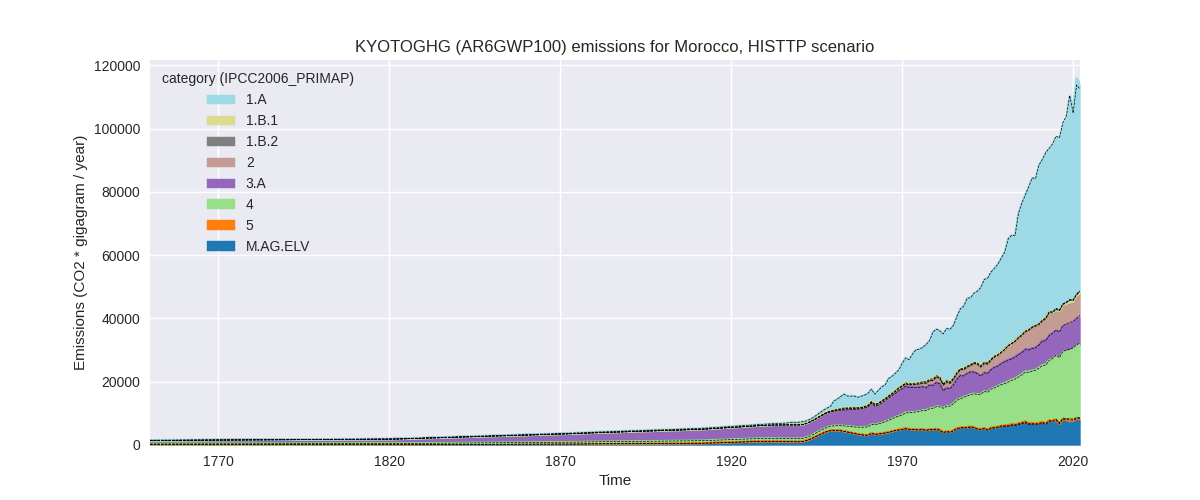
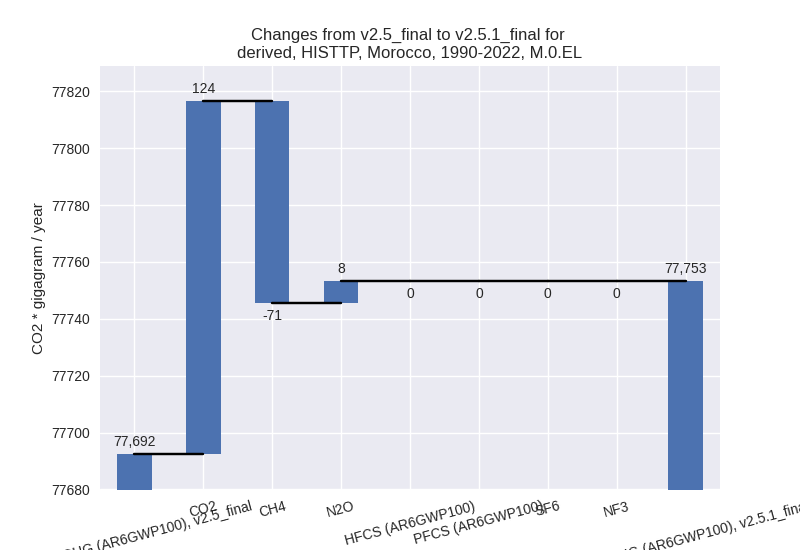
The following figures show the aggregate national total emissions excluding LULUCF AR6GWP100 for the third party priority scenario. The dotted linesshow the v2.5_final data.

Overview over changes
In the country reported priority scenario we have the following changes for aggregate Kyoto GHG and national total emissions excluding LULUCF (M.0.EL):
- Emissions in 2022 have changed by 3.1%% (3112.02 Gg CO2 / year)
- Emissions in 1990-2022 have changed by 0.4%% (243.09 Gg CO2 / year)
In the third party priority scenario we have the following changes for aggregate Kyoto GHG and national total emissions excluding LULUCF (M.0.EL):
- Emissions in 2022 have changed by 1.4%% (1580.18 Gg CO2 / year)
- Emissions in 1990-2022 have changed by 0.1%% (60.76 Gg CO2 / year)
Most important changes per scenario and time frame
In the country reported priority scenario the following sector-gas combinations have the highest absolute impact on national total KyotoGHG (AR6GWP100) emissions in 2022 (top 5):
- 1: 1.A, CO2 with 2666.71 Gg CO2 / year (4.1%)
- 2: M.AG.ELV, N2O with 261.92 Gg CO2 / year (2.5%)
- 3: 3.A, CH4 with 186.80 Gg CO2 / year (1.9%)
- 4: 1.A, CH4 with 35.49 Gg CO2 / year (7.4%)
- 5: 2, CO2 with -30.43 Gg CO2 / year (-0.5%)
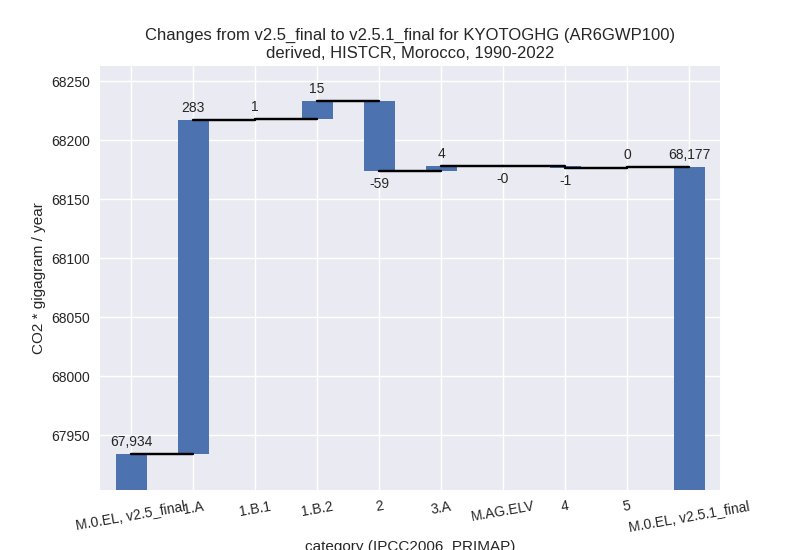
In the country reported priority scenario the following sector-gas combinations have the highest absolute impact on national total KyotoGHG (AR6GWP100) emissions in 1990-2022 (top 5):
- 1: 1.A, CO2 with 282.63 Gg CO2 / year (0.7%)
- 2: 2, CO2 with -58.98 Gg CO2 / year (-1.3%)
- 3: 1.B.2, CH4 with 15.07 Gg CO2 / year (10.9%)
- 4: 3.A, CH4 with 7.40 Gg CO2 / year (0.1%)
- 5: 3.A, N2O with -3.63 Gg CO2 / year (-0.9%)
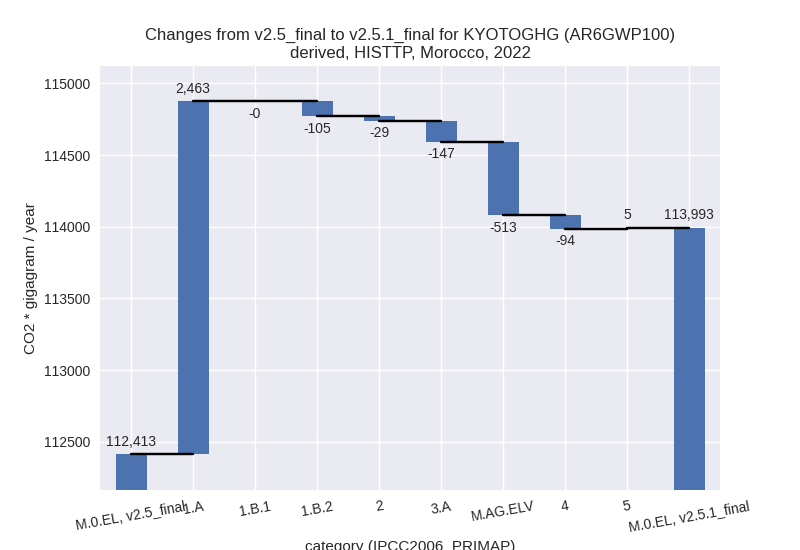
In the third party priority scenario the following sector-gas combinations have the highest absolute impact on national total KyotoGHG (AR6GWP100) emissions in 2022 (top 5):
- 1: 1.A, CO2 with 2433.31 Gg CO2 / year (3.9%)
- 2: M.AG.ELV, CO2 with -699.90 Gg CO2 / year (-53.4%)
- 3: M.AG.ELV, N2O with 232.00 Gg CO2 / year (3.4%)
- 4: 3.A, CH4 with -146.00 Gg CO2 / year (-1.7%)
- 5: 1.B.2, CH4 with -105.27 Gg CO2 / year (-50.2%)
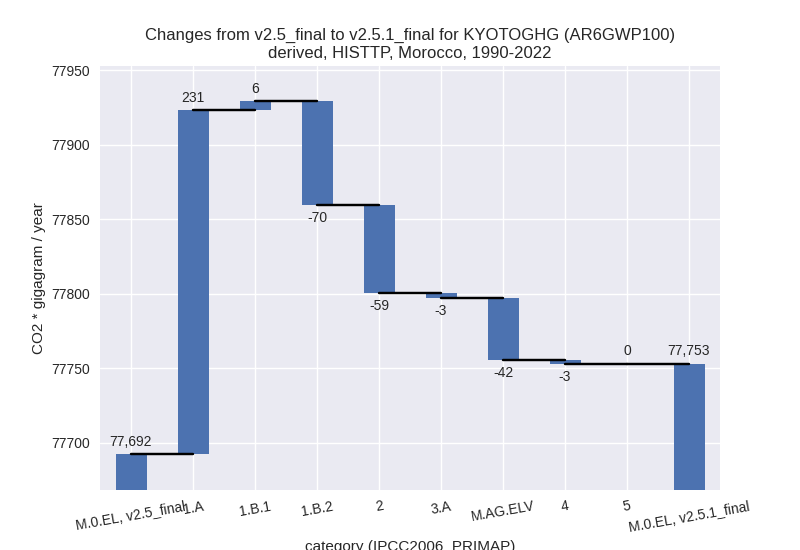
In the third party priority scenario the following sector-gas combinations have the highest absolute impact on national total KyotoGHG (AR6GWP100) emissions in 1990-2022 (top 5):
- 1: 1.A, CO2 with 230.76 Gg CO2 / year (0.6%)
- 2: 1.B.2, CH4 with -69.66 Gg CO2 / year (-41.7%)
- 3: 2, CO2 with -58.98 Gg CO2 / year (-1.3%)
- 4: M.AG.ELV, CO2 with -47.10 Gg CO2 / year (-9.8%)
- 5: M.AG.ELV, N2O with 7.82 Gg CO2 / year (0.1%)
Notes on data changes
No country specific notes present for this changelog.
Changes by sector and gas
For each scenario and time frame the changes are displayed for all individual sectors and all individual gases. In the sector plot we use aggregate Kyoto GHGs in AR6GWP100. In the gas plot we usenational total emissions without LULUCF. ## country reported scenario
2022


1990-2022

third party scenario
2022

1990-2022
Detailed changes for the scenarios:
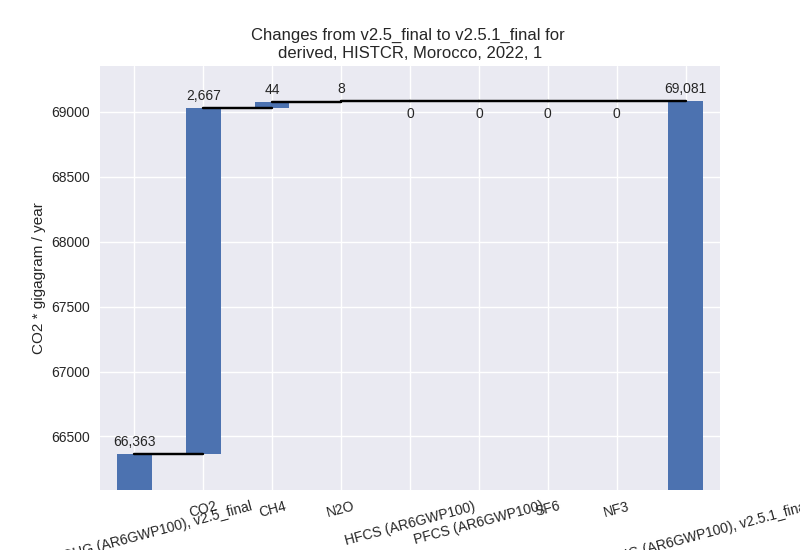
country reported scenario (HISTCR):
Most important changes per time frame
For 2022 the following sector-gas combinations have the highest absolute impact on national total KyotoGHG (AR6GWP100) emissions in 2022 (top 5):
- 1: 1.A, CO2 with 2666.71 Gg CO2 / year (4.1%)
- 2: M.AG.ELV, N2O with 261.92 Gg CO2 / year (2.5%)
- 3: 3.A, CH4 with 186.80 Gg CO2 / year (1.9%)
- 4: 1.A, CH4 with 35.49 Gg CO2 / year (7.4%)
- 5: 2, CO2 with -30.43 Gg CO2 / year (-0.5%)
For 1990-2022 the following sector-gas combinations have the highest absolute impact on national total KyotoGHG (AR6GWP100) emissions in 1990-2022 (top 5):
- 1: 1.A, CO2 with 282.63 Gg CO2 / year (0.7%)
- 2: 2, CO2 with -58.98 Gg CO2 / year (-1.3%)
- 3: 1.B.2, CH4 with 15.07 Gg CO2 / year (10.9%)
- 4: 3.A, CH4 with 7.40 Gg CO2 / year (0.1%)
- 5: 3.A, N2O with -3.63 Gg CO2 / year (-0.9%)
Changes in the main sectors for aggregate KyotoGHG (AR6GWP100) are
- 1: Total sectoral emissions in 2022 are 69081.39 Gg
CO2 / year which is 67.3% of M.0.EL emissions. 2022 Emissions have
changed by 4.1% (2718.22 Gg CO2 /
year). 1990-2022 Emissions have changed by 0.7% (299.09 Gg CO2 / year). For 2022 the
changes per gas
are:
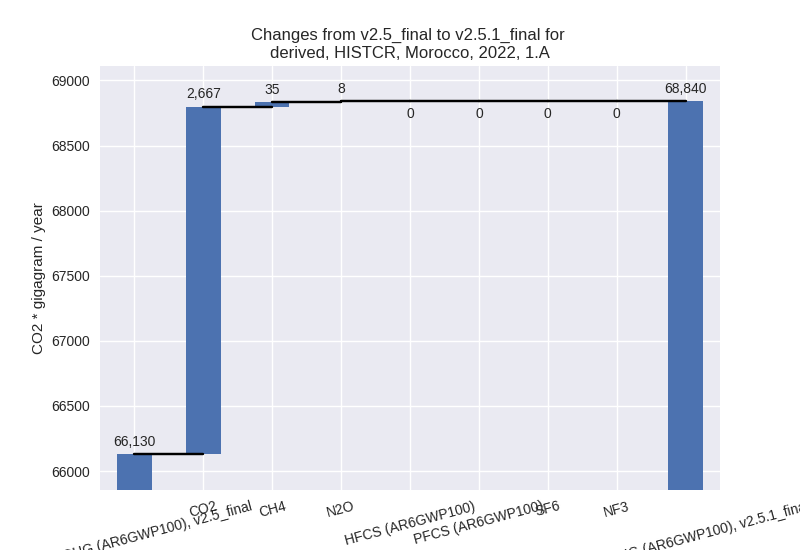
The changes come from the following subsectors:- 1.A: Total sectoral emissions in 2022 are 68839.70
Gg CO2 / year which is 99.7% of category 1 emissions. 2022 Emissions
have changed by 4.1% (2709.97 Gg CO2
/ year). 1990-2022 Emissions have changed by 0.7% (283.20 Gg CO2 / year). For 2022 the
changes per gas
are:
There is no subsector information available in PRIMAP-hist. - 1.B.1: Total sectoral emissions in 2022 are 9.52 Gg
CO2 / year which is 0.0% of category 1 emissions. 2022 Emissions have
changed by 3.9% (0.36 Gg CO2 /
year). 1990-2022 Emissions have changed by 3.5% (0.83 Gg CO2 / year). For 2022 the
changes per gas
are:

For 1990-2022 the changes per gas are: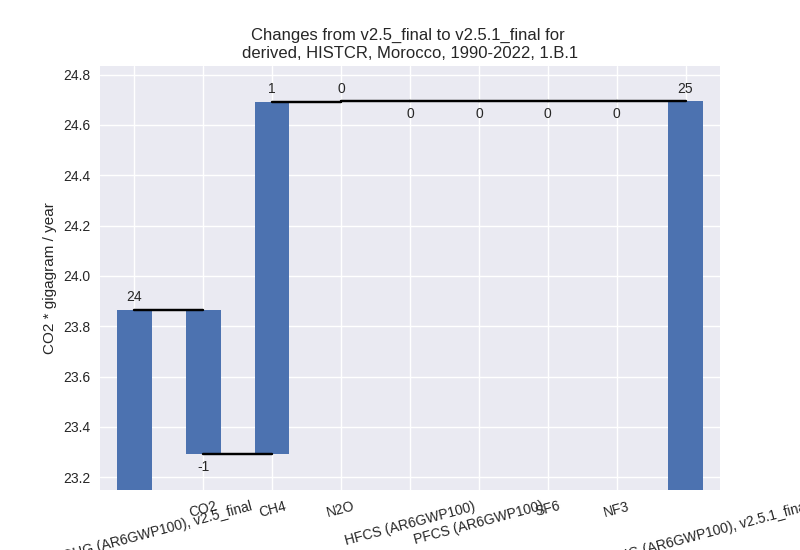
There is no subsector information available in PRIMAP-hist. - 1.B.2: Total sectoral emissions in 2022 are 232.17
Gg CO2 / year which is 0.3% of category 1 emissions. 2022 Emissions have
changed by 3.5% (7.88 Gg CO2 /
year). 1990-2022 Emissions have changed by 10.8% (15.07 Gg CO2 / year). For 2022 the
changes per gas
are:
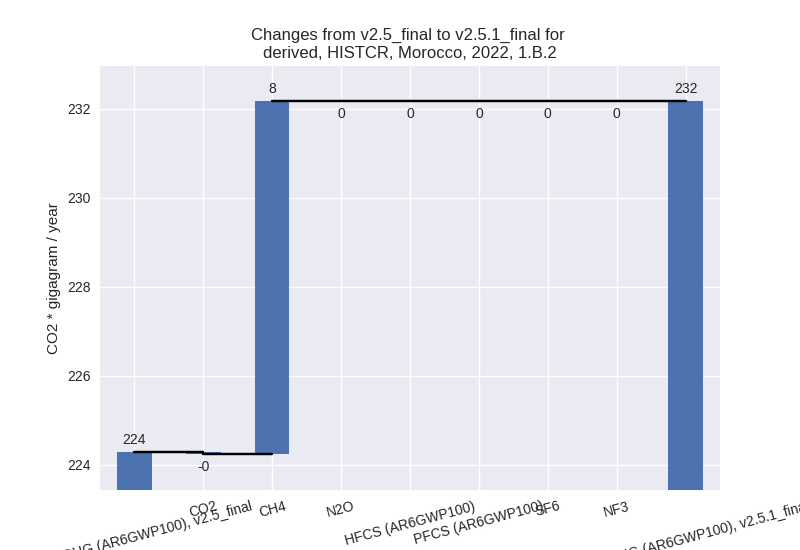
For 1990-2022 the changes per gas are:
There is no subsector information available in PRIMAP-hist.
- 1.A: Total sectoral emissions in 2022 are 68839.70
Gg CO2 / year which is 99.7% of category 1 emissions. 2022 Emissions
have changed by 4.1% (2709.97 Gg CO2
/ year). 1990-2022 Emissions have changed by 0.7% (283.20 Gg CO2 / year). For 2022 the
changes per gas
are:
- 2: Total sectoral emissions in 2022 are 5809.45 Gg CO2 / year which is 5.7% of M.0.EL emissions. 2022 Emissions have changed by -0.5% (-28.96 Gg CO2 / year). 1990-2022 Emissions have changed by -1.2% (-58.75 Gg CO2 / year).
- M.AG: Total sectoral emissions in 2022 are 21369.64
Gg CO2 / year which is 20.8% of M.0.EL emissions. 2022 Emissions have
changed by 2.1% (448.15 Gg CO2 /
year). 1990-2022 Emissions have changed by 0.0% (3.52 Gg CO2 / year). For 2022 the
changes per gas
are:

The changes come from the following subsectors:- 3.A: Total sectoral emissions in 2022 are 10645.88 Gg CO2 / year which is 49.8% of category M.AG emissions. 2022 Emissions have changed by 1.9% (193.43 Gg CO2 / year). 1990-2022 Emissions have changed by 0.0% (3.78 Gg CO2 / year).
- M.AG.ELV: Total sectoral emissions in 2022 are
10723.76 Gg CO2 / year which is 50.2% of category M.AG emissions. 2022
Emissions have changed by 2.4%
(254.72 Gg CO2 / year). 1990-2022 Emissions have changed by -0.0% (-0.26 Gg CO2 / year). For 2022 the
changes per gas
are:
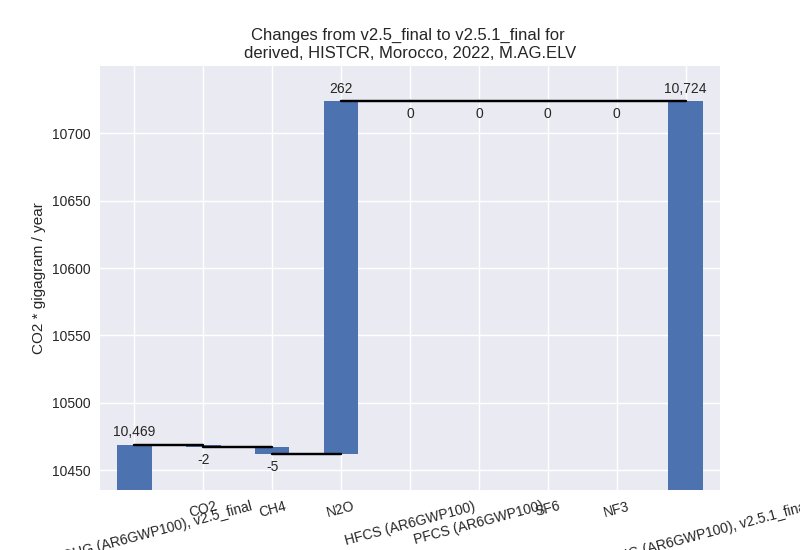
There is no subsector information available in PRIMAP-hist.
- 4: Total sectoral emissions in 2022 are 6074.57 Gg CO2 / year which is 5.9% of M.0.EL emissions. 2022 Emissions have changed by -0.5% (-30.80 Gg CO2 / year). 1990-2022 Emissions have changed by -0.0% (-0.93 Gg CO2 / year).
- 5: Total sectoral emissions in 2022 are 371.41 Gg CO2 / year which is 0.4% of M.0.EL emissions. 2022 Emissions have changed by 1.5% (5.43 Gg CO2 / year). 1990-2022 Emissions have changed by 0.1% (0.16 Gg CO2 / year).
third party scenario (HISTTP):
Most important changes per time frame
For 2022 the following sector-gas combinations have the highest absolute impact on national total KyotoGHG (AR6GWP100) emissions in 2022 (top 5):
- 1: 1.A, CO2 with 2433.31 Gg CO2 / year (3.9%)
- 2: M.AG.ELV, CO2 with -699.90 Gg CO2 / year (-53.4%)
- 3: M.AG.ELV, N2O with 232.00 Gg CO2 / year (3.4%)
- 4: 3.A, CH4 with -146.00 Gg CO2 / year (-1.7%)
- 5: 1.B.2, CH4 with -105.27 Gg CO2 / year (-50.2%)
For 1990-2022 the following sector-gas combinations have the highest absolute impact on national total KyotoGHG (AR6GWP100) emissions in 1990-2022 (top 5):
- 1: 1.A, CO2 with 230.76 Gg CO2 / year (0.6%)
- 2: 1.B.2, CH4 with -69.66 Gg CO2 / year (-41.7%)
- 3: 2, CO2 with -58.98 Gg CO2 / year (-1.3%)
- 4: M.AG.ELV, CO2 with -47.10 Gg CO2 / year (-9.8%)
- 5: M.AG.ELV, N2O with 7.82 Gg CO2 / year (0.1%)
Changes in the main sectors for aggregate KyotoGHG (AR6GWP100) are
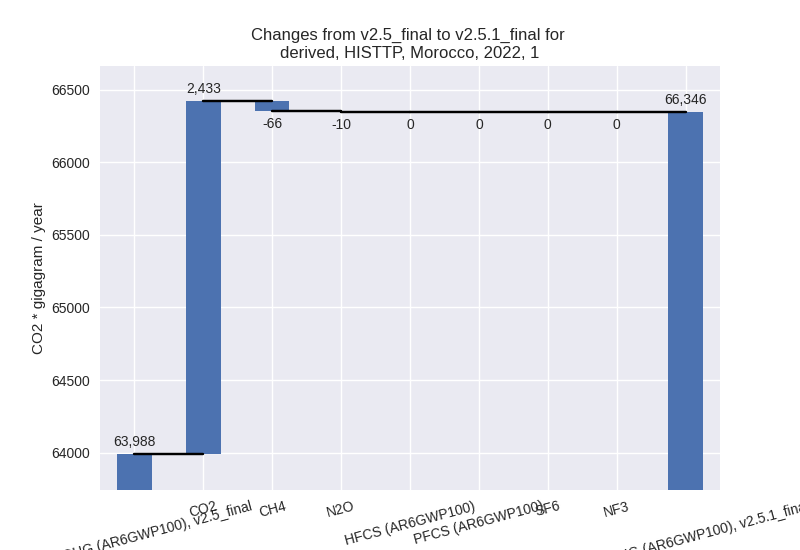
- 1: Total sectoral emissions in 2022 are 66345.93 Gg
CO2 / year which is 58.2% of M.0.EL emissions. 2022 Emissions have
changed by 3.7% (2357.48 Gg CO2 /
year). 1990-2022 Emissions have changed by 0.4% (167.11 Gg CO2 / year). For 2022 the
changes per gas
are:
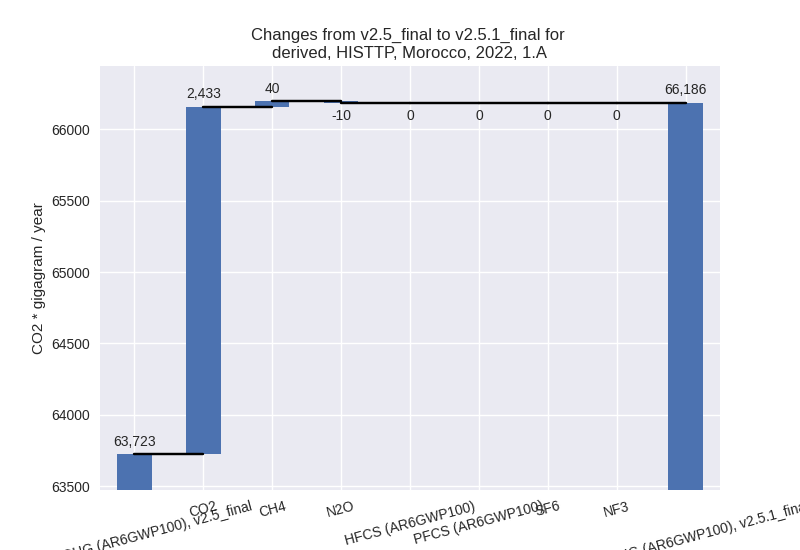
The changes come from the following subsectors:- 1.A: Total sectoral emissions in 2022 are 66186.38
Gg CO2 / year which is 99.8% of category 1 emissions. 2022 Emissions
have changed by 3.9% (2462.90 Gg CO2
/ year). 1990-2022 Emissions have changed by 0.5% (230.91 Gg CO2 / year). For 2022 the
changes per gas
are:
There is no subsector information available in PRIMAP-hist. - 1.B.1: Total sectoral emissions in 2022 are 55.25
Gg CO2 / year which is 0.1% of category 1 emissions. 2022 Emissions have
changed by -0.3% (-0.14 Gg CO2 /
year). 1990-2022 Emissions have changed by 5.6% (5.87 Gg CO2 / year). For 1990-2022
the changes per gas
are:

There is no subsector information available in PRIMAP-hist. - 1.B.2: Total sectoral emissions in 2022 are 104.31
Gg CO2 / year which is 0.2% of category 1 emissions. 2022 Emissions have
changed by -50.2% (-105.27 Gg CO2 /
year). 1990-2022 Emissions have changed by -41.7% (-69.66 Gg CO2 / year). For 2022
the changes per gas
are:
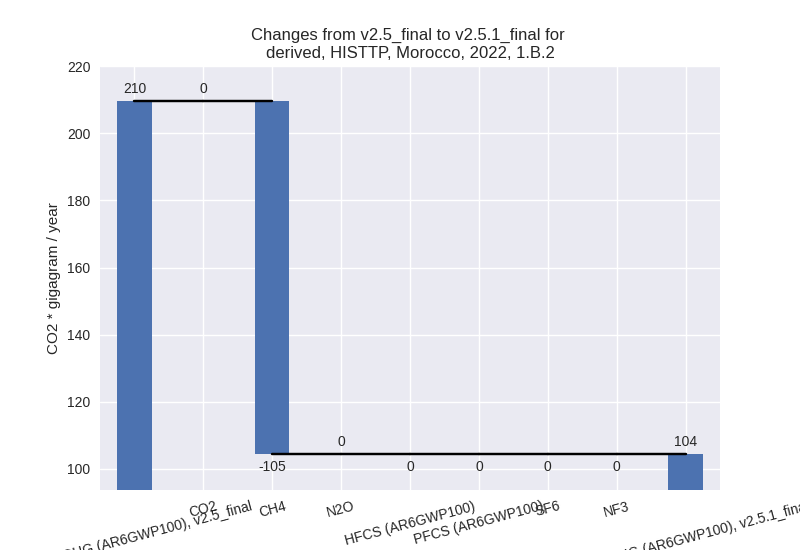
For 1990-2022 the changes per gas are:
There is no subsector information available in PRIMAP-hist.
- 1.A: Total sectoral emissions in 2022 are 66186.38
Gg CO2 / year which is 99.8% of category 1 emissions. 2022 Emissions
have changed by 3.9% (2462.90 Gg CO2
/ year). 1990-2022 Emissions have changed by 0.5% (230.91 Gg CO2 / year). For 2022 the
changes per gas
are:
- 2: Total sectoral emissions in 2022 are 7410.19 Gg CO2 / year which is 6.5% of M.0.EL emissions. 2022 Emissions have changed by -0.4% (-28.96 Gg CO2 / year). 1990-2022 Emissions have changed by -1.1% (-58.75 Gg CO2 / year).
- M.AG: Total sectoral emissions in 2022 are 16432.08
Gg CO2 / year which is 14.4% of M.0.EL emissions. 2022 Emissions have
changed by -3.9% (-659.95 Gg CO2 /
year). 1990-2022 Emissions have changed by -0.3% (-44.92 Gg CO2 / year). For 2022 the
changes per gas
are:
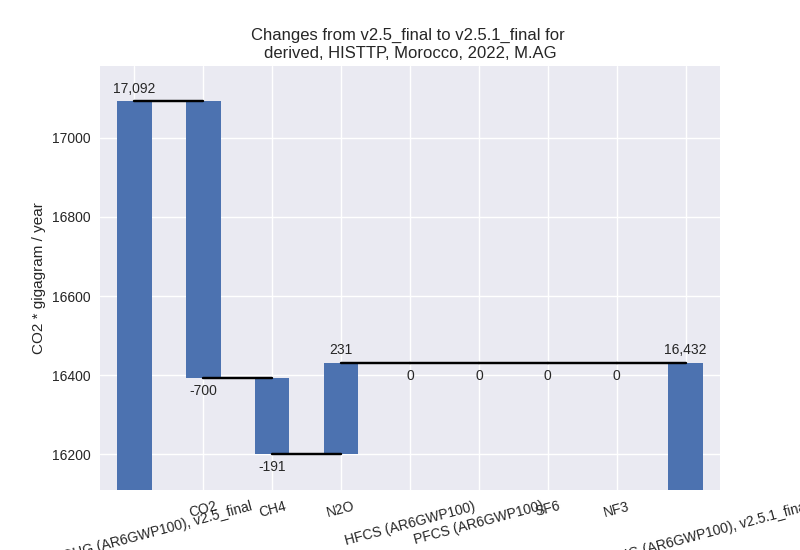
The changes come from the following subsectors:- 3.A: Total sectoral emissions in 2022 are 8571.03 Gg CO2 / year which is 52.2% of category M.AG emissions. 2022 Emissions have changed by -1.7% (-146.61 Gg CO2 / year). 1990-2022 Emissions have changed by -0.0% (-3.28 Gg CO2 / year).
- M.AG.ELV: Total sectoral emissions in 2022 are
7861.05 Gg CO2 / year which is 47.8% of category M.AG emissions. 2022
Emissions have changed by -6.1%
(-513.34 Gg CO2 / year). 1990-2022 Emissions have changed by -0.6% (-41.65 Gg CO2 / year). For 2022 the
changes per gas
are:

There is no subsector information available in PRIMAP-hist.
- 4: Total sectoral emissions in 2022 are 23433.08 Gg CO2 / year which is 20.6% of M.0.EL emissions. 2022 Emissions have changed by -0.4% (-93.81 Gg CO2 / year). 1990-2022 Emissions have changed by -0.0% (-2.84 Gg CO2 / year).
- 5: Total sectoral emissions in 2022 are 371.41 Gg CO2 / year which is 0.3% of M.0.EL emissions. 2022 Emissions have changed by 1.5% (5.43 Gg CO2 / year). 1990-2022 Emissions have changed by 0.1% (0.16 Gg CO2 / year).