Changes in PRIMAP-hist v2.5.1_final compared to v2.5_final for Moldova, Republic of
2024-02-29
Johannes Gütschow
Change analysis for Moldova, Republic of for PRIMAP-hist v2.5.1_final compared to v2.5_final
Overview over emissions by sector and gas
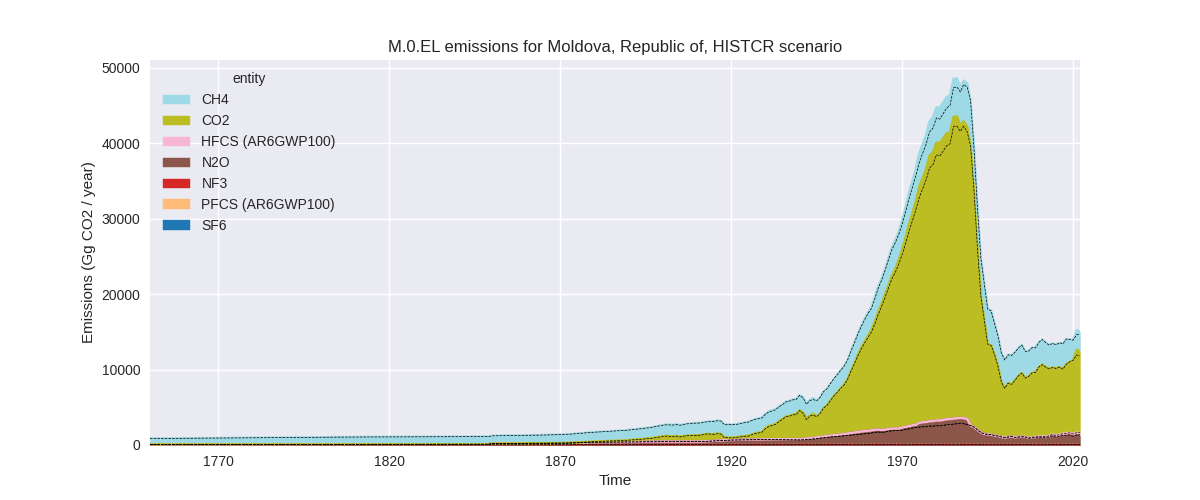
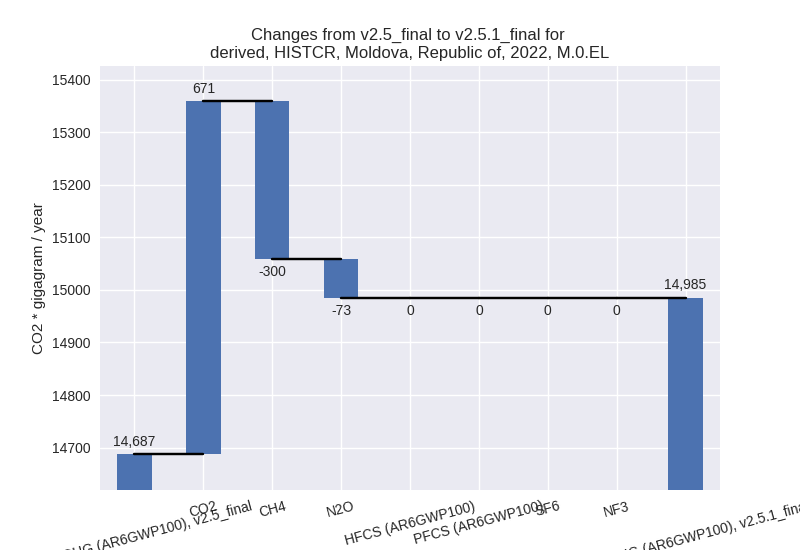
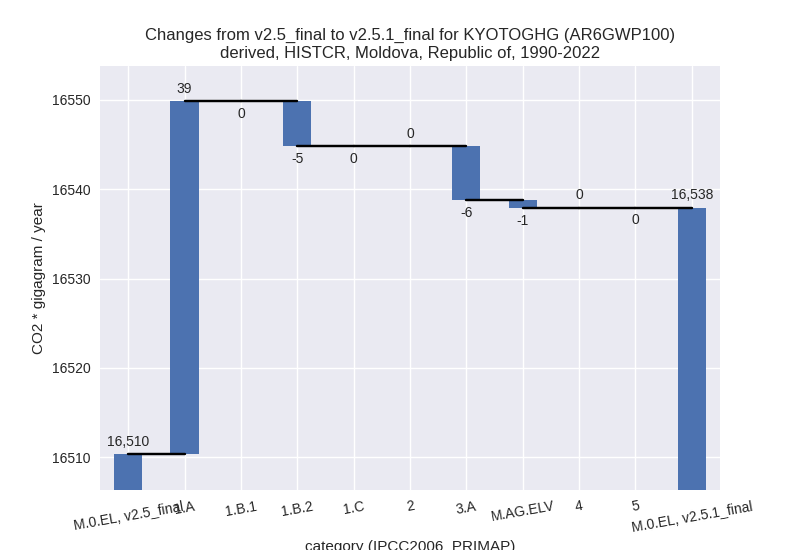
The following figures show the aggregate national total emissions excluding LULUCF AR6GWP100 for the country reported priority scenario. The dotted linesshow the v2.5_final data.

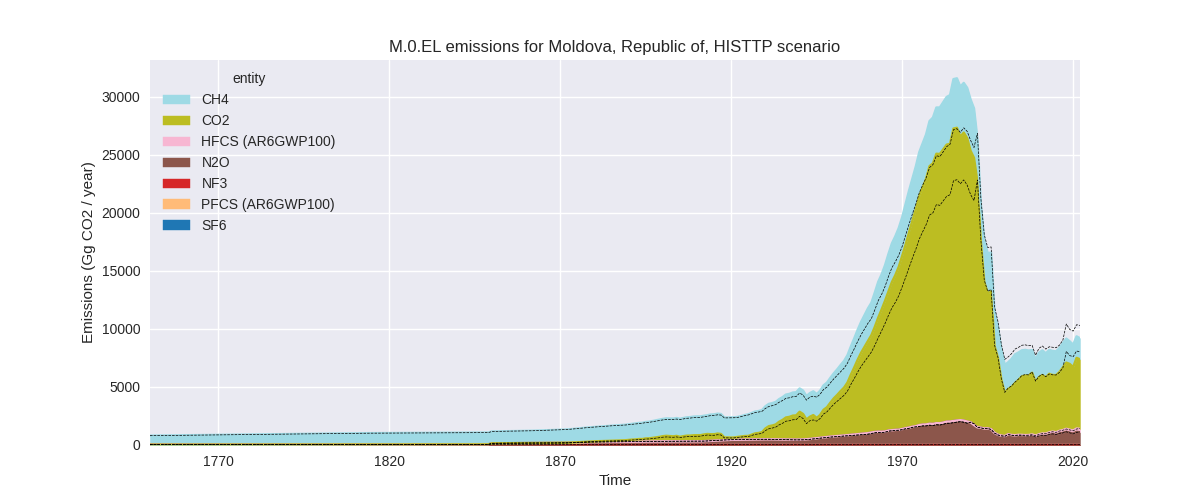
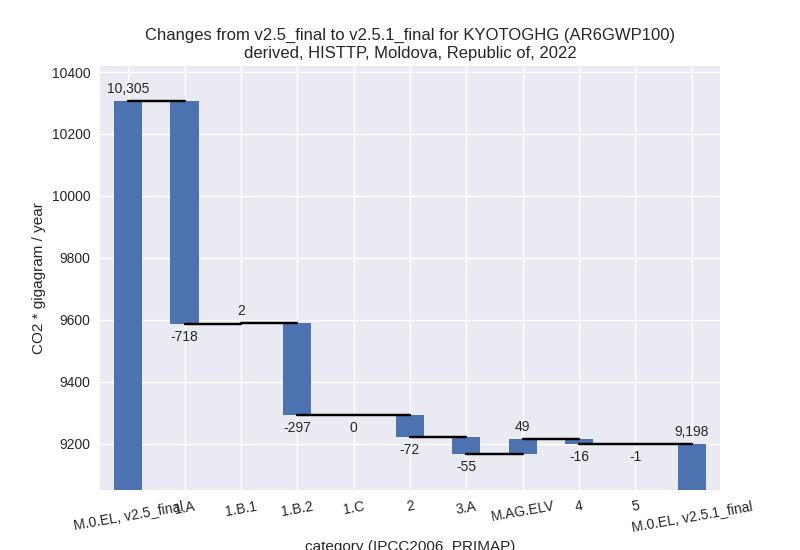
The following figures show the aggregate national total emissions excluding LULUCF AR6GWP100 for the third party priority scenario. The dotted linesshow the v2.5_final data.


Overview over changes
In the country reported priority scenario we have the following changes for aggregate Kyoto GHG and national total emissions excluding LULUCF (M.0.EL):
- Emissions in 2022 have changed by 2.0%% (297.80 Gg CO2 / year)
- Emissions in 1990-2022 have changed by 0.2%% (27.59 Gg CO2 / year)
In the third party priority scenario we have the following changes for aggregate Kyoto GHG and national total emissions excluding LULUCF (M.0.EL):
- Emissions in 2022 have changed by -10.7%% (-1107.79 Gg CO2 / year)
- Emissions in 1990-2022 have changed by -2.5%% (-287.41 Gg CO2 / year)
Most important changes per scenario and time frame
In the country reported priority scenario the following sector-gas combinations have the highest absolute impact on national total KyotoGHG (AR6GWP100) emissions in 2022 (top 5):
- 1: 1.A, CO2 with 659.16 Gg CO2 / year (7.1%)
- 2: 1.B.2, CH4 with -166.18 Gg CO2 / year (-38.2%)
- 3: 3.A, CH4 with -104.16 Gg CO2 / year (-20.4%)
- 4: M.AG.ELV, N2O with -49.00 Gg CO2 / year (-4.9%)
- 5: 1.A, CH4 with -33.31 Gg CO2 / year (-11.5%)
In the country reported priority scenario the following sector-gas combinations have the highest absolute impact on national total KyotoGHG (AR6GWP100) emissions in 1990-2022 (top 5):
- 1: 1.A, CO2 with 40.32 Gg CO2 / year (0.4%)
- 2: 1.B.2, CH4 with -5.03 Gg CO2 / year (-0.7%)
- 3: 3.A, CH4 with -4.89 Gg CO2 / year (-0.4%)
- 4: 3.A, N2O with -1.10 Gg CO2 / year (-0.3%)
- 5: M.AG.ELV, N2O with -1.06 Gg CO2 / year (-0.1%)
In the third party priority scenario the following sector-gas combinations have the highest absolute impact on national total KyotoGHG (AR6GWP100) emissions in 2022 (top 5):
- 1: 1.A, CO2 with -641.88 Gg CO2 / year (-11.1%)
- 2: 1.B.2, CH4 with -296.94 Gg CO2 / year (-79.5%)
- 3: M.AG.ELV, CO2 with 106.79 Gg CO2 / year (202.2%)
- 4: 1.A, CH4 with -80.01 Gg CO2 / year (-23.9%)
- 5: 2, CO2 with -72.02 Gg CO2 / year (-9.7%)
In the third party priority scenario the following sector-gas combinations have the highest absolute impact on national total KyotoGHG (AR6GWP100) emissions in 1990-2022 (top 5):
- 1: 1.B.2, CH4 with -299.36 Gg CO2 / year (-79.6%)
- 2: 1.A, CO2 with 119.72 Gg CO2 / year (1.7%)
- 3: 2, CO2 with -87.15 Gg CO2 / year (-14.8%)
- 4: 1.B.1, CH4 with -27.87 Gg CO2 / year (-94.7%)
- 5: M.AG.ELV, N2O with 6.88 Gg CO2 / year (0.9%)
Notes on data changes
Here we list notes explaining important emissions changes for the country. ’' means that the following text only applies to the TP time series, while means that it only applies to the CR scenario. Otherwise the note applies to both scenarios.
- 1.A, CO2: 2022 emissions have changed due to the inclusion of new CDIAC data.
- 1.B.2, CH4: 2022 emissions are lower as numerical extrapolation that also took into account the higher pre-2020 emissions has been replaced by EDGAR 8.0 growth rates. EDGAR 8.0 emissions are only roughly 20% of EDGAR 7.0 emissions leading to much lower PRIMAP-hist emissions.
- 3.A, CH4: 2022 emissions are lower due to an emissions decline in the updated FAO data.
- M.AG.ELV, CO2: EDGAR 8.0 emissions are much higher than EDGAR 7.0.
- 2.D, CO2: Emissions in 2.D (non-energy products from fuels and solvent use) are much lower in EDGAR 8.0 than in EDGAR 7.0 and thus emissions in PRIMAP-hist v2.5.1 are lower than in v2.5.
Changes by sector and gas
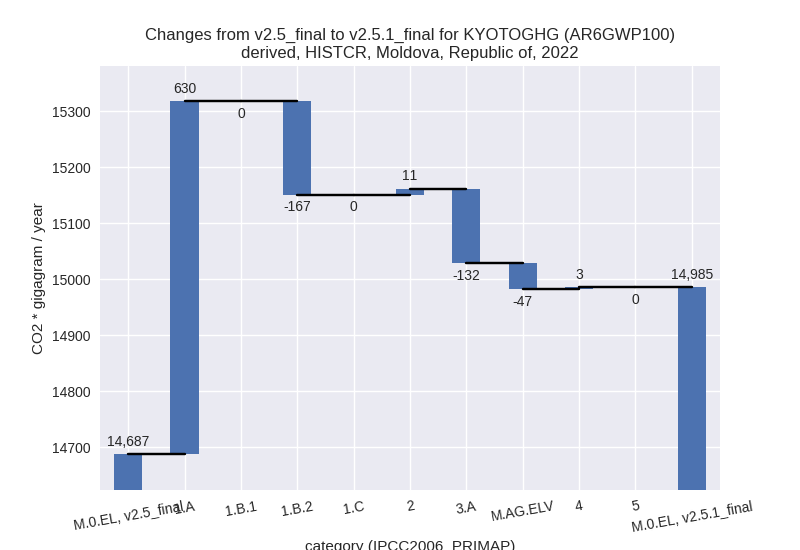
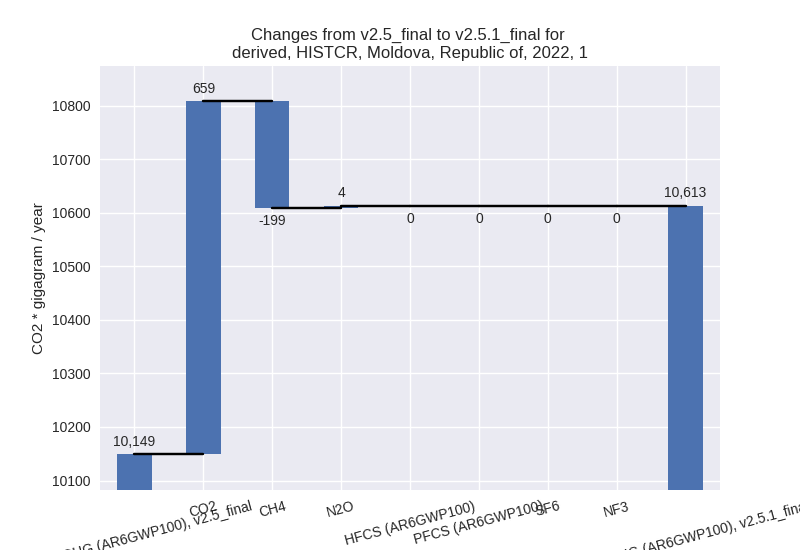
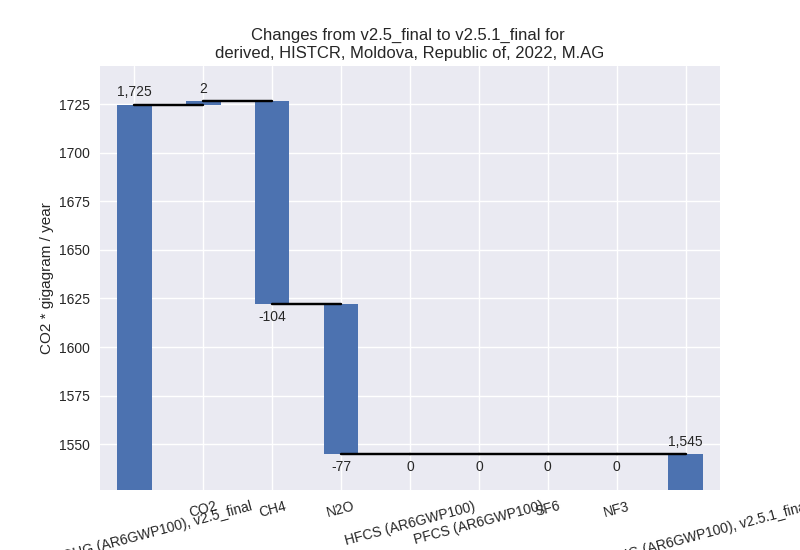
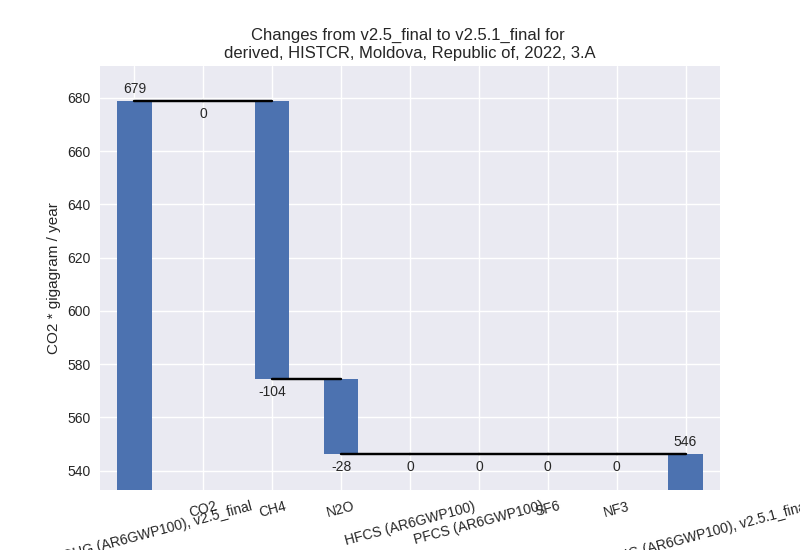
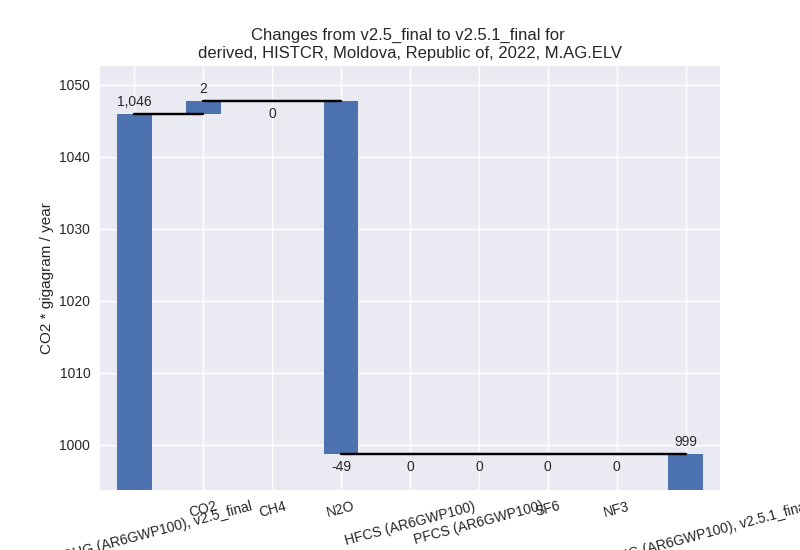
For each scenario and time frame the changes are displayed for all individual sectors and all individual gases. In the sector plot we use aggregate Kyoto GHGs in AR6GWP100. In the gas plot we usenational total emissions without LULUCF. ## country reported scenario
2022
1990-2022

third party scenario
2022

1990-2022


Detailed changes for the scenarios:
country reported scenario (HISTCR):
Most important changes per time frame
For 2022 the following sector-gas combinations have the highest absolute impact on national total KyotoGHG (AR6GWP100) emissions in 2022 (top 5):
- 1: 1.A, CO2 with 659.16 Gg CO2 / year (7.1%)
- 2: 1.B.2, CH4 with -166.18 Gg CO2 / year (-38.2%)
- 3: 3.A, CH4 with -104.16 Gg CO2 / year (-20.4%)
- 4: M.AG.ELV, N2O with -49.00 Gg CO2 / year (-4.9%)
- 5: 1.A, CH4 with -33.31 Gg CO2 / year (-11.5%)
For 1990-2022 the following sector-gas combinations have the highest absolute impact on national total KyotoGHG (AR6GWP100) emissions in 1990-2022 (top 5):
- 1: 1.A, CO2 with 40.32 Gg CO2 / year (0.4%)
- 2: 1.B.2, CH4 with -5.03 Gg CO2 / year (-0.7%)
- 3: 3.A, CH4 with -4.89 Gg CO2 / year (-0.4%)
- 4: 3.A, N2O with -1.10 Gg CO2 / year (-0.3%)
- 5: M.AG.ELV, N2O with -1.06 Gg CO2 / year (-0.1%)
Changes in the main sectors for aggregate KyotoGHG (AR6GWP100) are
- 1: Total sectoral emissions in 2022 are 10612.72 Gg
CO2 / year which is 70.8% of M.0.EL emissions. 2022 Emissions have
changed by 4.6% (463.63 Gg CO2 /
year). 1990-2022 Emissions have changed by 0.3% (34.43 Gg CO2 / year). For 2022 the
changes per gas
are:
The changes come from the following subsectors:- 1.A: Total sectoral emissions in 2022 are 10343.00
Gg CO2 / year which is 97.5% of category 1 emissions. 2022 Emissions
have changed by 6.5% (630.15 Gg CO2
/ year). 1990-2022 Emissions have changed by 0.4% (39.47 Gg CO2 / year). For 2022 the
changes per gas
are:

There is no subsector information available in PRIMAP-hist. - 1.B.2: Total sectoral emissions in 2022 are 269.72
Gg CO2 / year which is 2.5% of category 1 emissions. 2022 Emissions have
changed by -38.2% (-166.52 Gg CO2 /
year). 1990-2022 Emissions have changed by -0.7% (-5.04 Gg CO2 / year). For 2022 the
changes per gas
are:

There is no subsector information available in PRIMAP-hist.
- 1.A: Total sectoral emissions in 2022 are 10343.00
Gg CO2 / year which is 97.5% of category 1 emissions. 2022 Emissions
have changed by 6.5% (630.15 Gg CO2
/ year). 1990-2022 Emissions have changed by 0.4% (39.47 Gg CO2 / year). For 2022 the
changes per gas
are:
- 2: Total sectoral emissions in 2022 are 1102.79 Gg CO2 / year which is 7.4% of M.0.EL emissions. 2022 Emissions have changed by 1.0% (10.75 Gg CO2 / year). 1990-2022 Emissions have changed by 0.0% (0.02 Gg CO2 / year).
- M.AG: Total sectoral emissions in 2022 are 1544.91
Gg CO2 / year which is 10.3% of M.0.EL emissions. 2022 Emissions have
changed by -10.4% (-179.67 Gg CO2 /
year). 1990-2022 Emissions have changed by -0.3% (-6.95 Gg CO2 / year). For 2022 the
changes per gas
are:
The changes come from the following subsectors:- 3.A: Total sectoral emissions in 2022 are 546.20 Gg
CO2 / year which is 35.4% of category M.AG emissions. 2022 Emissions
have changed by -19.5% (-132.49 Gg
CO2 / year). 1990-2022 Emissions have changed by -0.4% (-5.99 Gg CO2 / year). For 2022 the
changes per gas
are:
There is no subsector information available in PRIMAP-hist. - M.AG.ELV: Total sectoral emissions in 2022 are
998.71 Gg CO2 / year which is 64.6% of category M.AG emissions. 2022
Emissions have changed by -4.5%
(-47.18 Gg CO2 / year). 1990-2022 Emissions have changed by -0.1% (-0.96 Gg CO2 / year). For 2022 the
changes per gas
are:
There is no subsector information available in PRIMAP-hist.
- 3.A: Total sectoral emissions in 2022 are 546.20 Gg
CO2 / year which is 35.4% of category M.AG emissions. 2022 Emissions
have changed by -19.5% (-132.49 Gg
CO2 / year). 1990-2022 Emissions have changed by -0.4% (-5.99 Gg CO2 / year). For 2022 the
changes per gas
are:
- 4: Total sectoral emissions in 2022 are 1724.81 Gg CO2 / year which is 11.5% of M.0.EL emissions. 2022 Emissions have changed by 0.2% (3.09 Gg CO2 / year). 1990-2022 Emissions have changed by 0.0% (0.09 Gg CO2 / year).
- 5: No data
third party scenario (HISTTP):
Most important changes per time frame
For 2022 the following sector-gas combinations have the highest absolute impact on national total KyotoGHG (AR6GWP100) emissions in 2022 (top 5):
- 1: 1.A, CO2 with -641.88 Gg CO2 / year (-11.1%)
- 2: 1.B.2, CH4 with -296.94 Gg CO2 / year (-79.5%)
- 3: M.AG.ELV, CO2 with 106.79 Gg CO2 / year (202.2%)
- 4: 1.A, CH4 with -80.01 Gg CO2 / year (-23.9%)
- 5: 2, CO2 with -72.02 Gg CO2 / year (-9.7%)
For 1990-2022 the following sector-gas combinations have the highest absolute impact on national total KyotoGHG (AR6GWP100) emissions in 1990-2022 (top 5):
- 1: 1.B.2, CH4 with -299.36 Gg CO2 / year (-79.6%)
- 2: 1.A, CO2 with 119.72 Gg CO2 / year (1.7%)
- 3: 2, CO2 with -87.15 Gg CO2 / year (-14.8%)
- 4: 1.B.1, CH4 with -27.87 Gg CO2 / year (-94.7%)
- 5: M.AG.ELV, N2O with 6.88 Gg CO2 / year (0.9%)
Changes in the main sectors for aggregate KyotoGHG (AR6GWP100) are
- 1: Total sectoral emissions in 2022 are 5611.31 Gg
CO2 / year which is 61.0% of M.0.EL emissions. 2022 Emissions have
changed by -15.3% (-1012.78 Gg CO2 /
year). 1990-2022 Emissions have changed by -2.7% (-207.99 Gg CO2 / year). For 2022
the changes per gas
are:

For 1990-2022 the changes per gas are: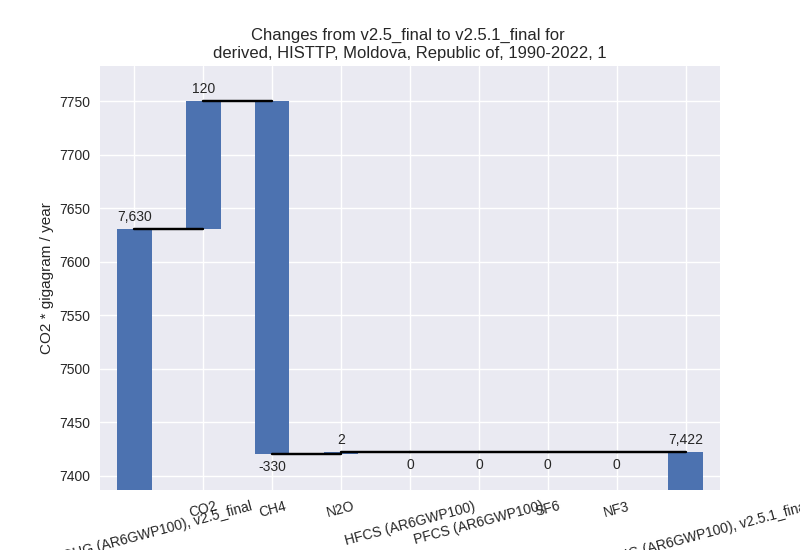
The changes come from the following subsectors:- 1.A: Total sectoral emissions in 2022 are 5532.16
Gg CO2 / year which is 98.6% of category 1 emissions. 2022 Emissions
have changed by -11.5% (-718.22 Gg
CO2 / year). 1990-2022 Emissions have changed by 1.7% (119.24 Gg CO2 / year). For 2022 the
changes per gas
are:

There is no subsector information available in PRIMAP-hist. - 1.B.1: Total sectoral emissions in 2022 are 2.39 Gg
CO2 / year which is 0.0% of category 1 emissions. 2022 Emissions have
changed by 14210.0% (2.37 Gg CO2 /
year). 1990-2022 Emissions have changed by -94.6% (-27.87 Gg CO2 / year). For 2022
the changes per gas
are:

For 1990-2022 the changes per gas are:
There is no subsector information available in PRIMAP-hist. - 1.B.2: Total sectoral emissions in 2022 are 76.75
Gg CO2 / year which is 1.4% of category 1 emissions. 2022 Emissions have
changed by -79.5% (-296.94 Gg CO2 /
year). 1990-2022 Emissions have changed by -78.0% (-299.35 Gg CO2 / year). For 2022
the changes per gas
are:
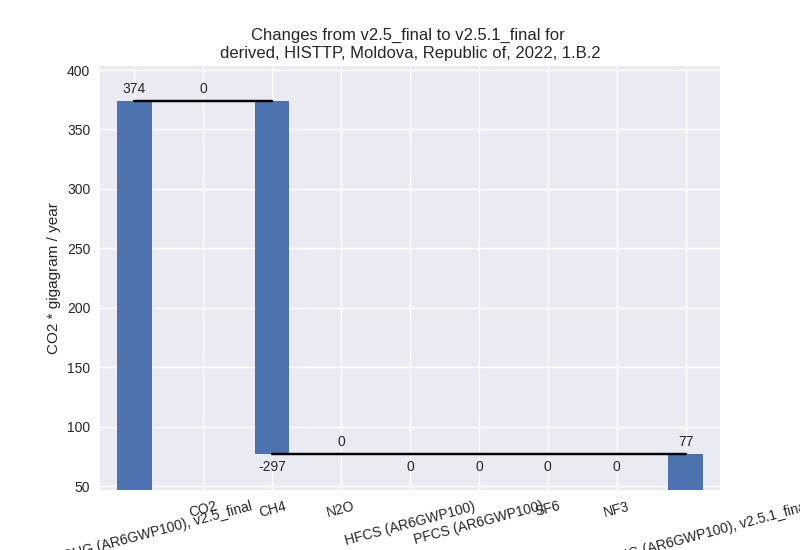
For 1990-2022 the changes per gas are:
There is no subsector information available in PRIMAP-hist.
- 1.A: Total sectoral emissions in 2022 are 5532.16
Gg CO2 / year which is 98.6% of category 1 emissions. 2022 Emissions
have changed by -11.5% (-718.22 Gg
CO2 / year). 1990-2022 Emissions have changed by 1.7% (119.24 Gg CO2 / year). For 2022 the
changes per gas
are:
- 2: Total sectoral emissions in 2022 are 966.04 Gg
CO2 / year which is 10.5% of M.0.EL emissions. 2022 Emissions have
changed by -6.9% (-72.03 Gg CO2 /
year). 1990-2022 Emissions have changed by -12.7% (-87.16 Gg CO2 / year). For 2022
the changes per gas
are:

For 1990-2022 the changes per gas are: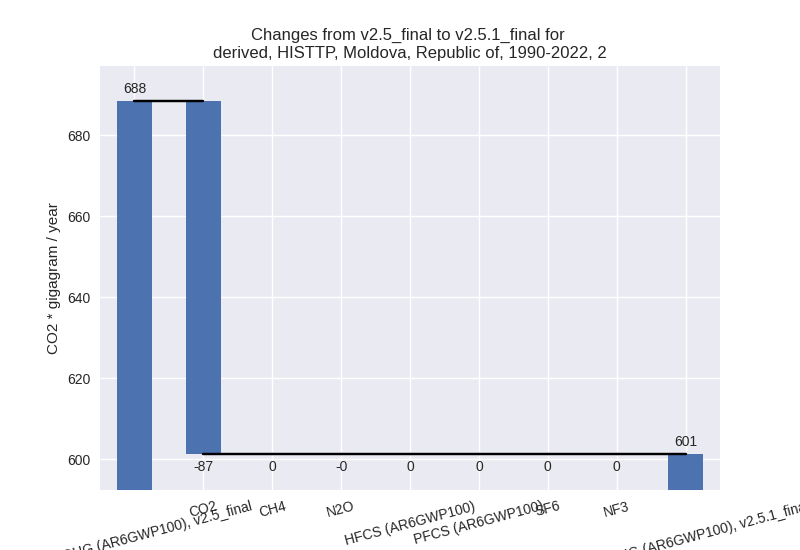
- M.AG: Total sectoral emissions in 2022 are 1604.83 Gg CO2 / year which is 17.4% of M.0.EL emissions. 2022 Emissions have changed by -0.4% (-5.98 Gg CO2 / year). 1990-2022 Emissions have changed by 0.4% (8.25 Gg CO2 / year).
- 4: Total sectoral emissions in 2022 are 950.03 Gg CO2 / year which is 10.3% of M.0.EL emissions. 2022 Emissions have changed by -1.7% (-16.01 Gg CO2 / year). 1990-2022 Emissions have changed by -0.1% (-0.49 Gg CO2 / year).
- 5: Total sectoral emissions in 2022 are 65.47 Gg CO2 / year which is 0.7% of M.0.EL emissions. 2022 Emissions have changed by -1.5% (-0.99 Gg CO2 / year). 1990-2022 Emissions have changed by -0.0% (-0.03 Gg CO2 / year).