Changes in PRIMAP-hist v2.5.1_final compared to v2.5_final for Madagascar
2024-02-29
Johannes Gütschow
Change analysis for Madagascar for PRIMAP-hist v2.5.1_final compared to v2.5_final
Overview over emissions by sector and gas
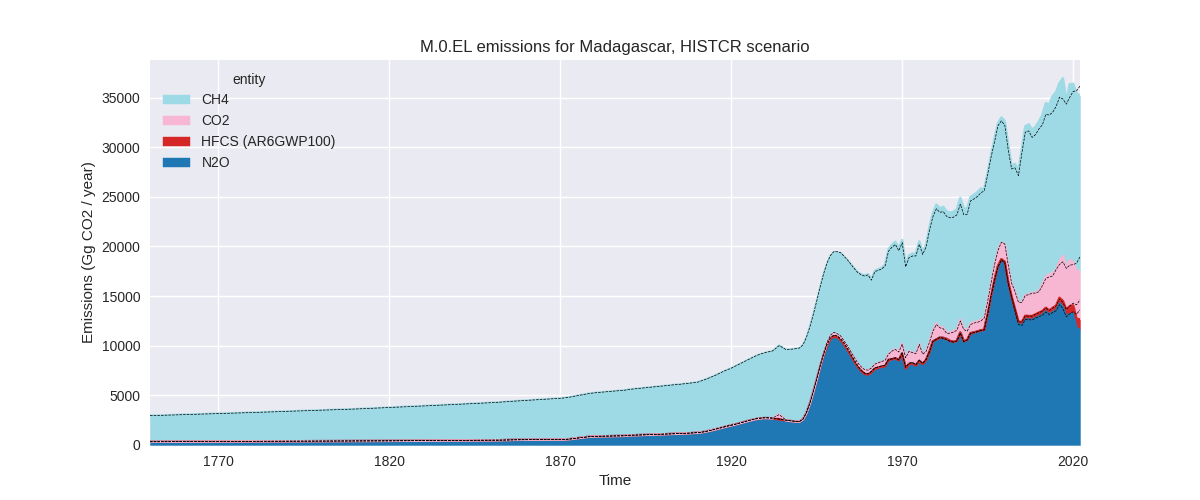
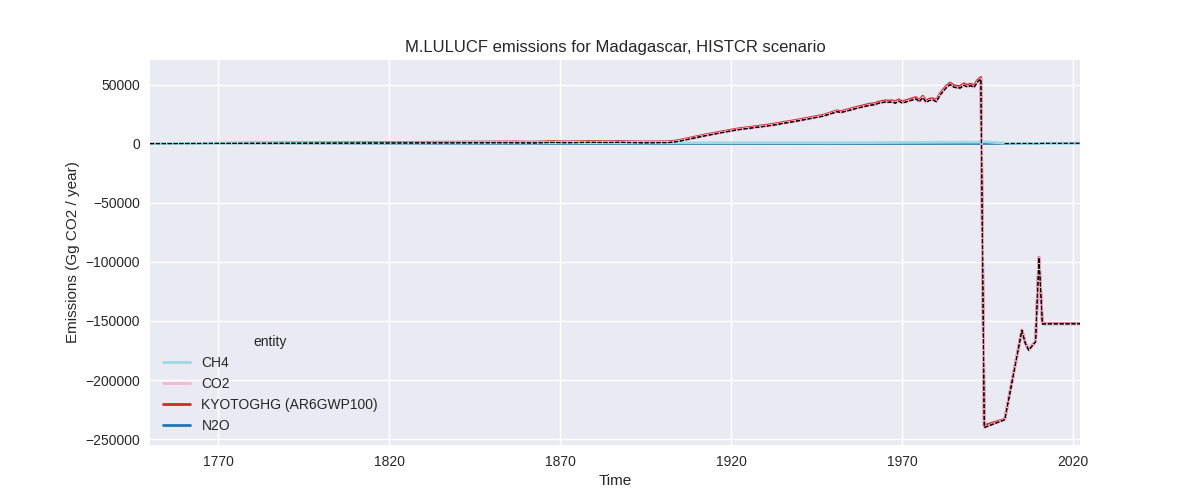
The following figures show the aggregate national total emissions excluding LULUCF AR6GWP100 for the country reported priority scenario. The dotted linesshow the v2.5_final data.

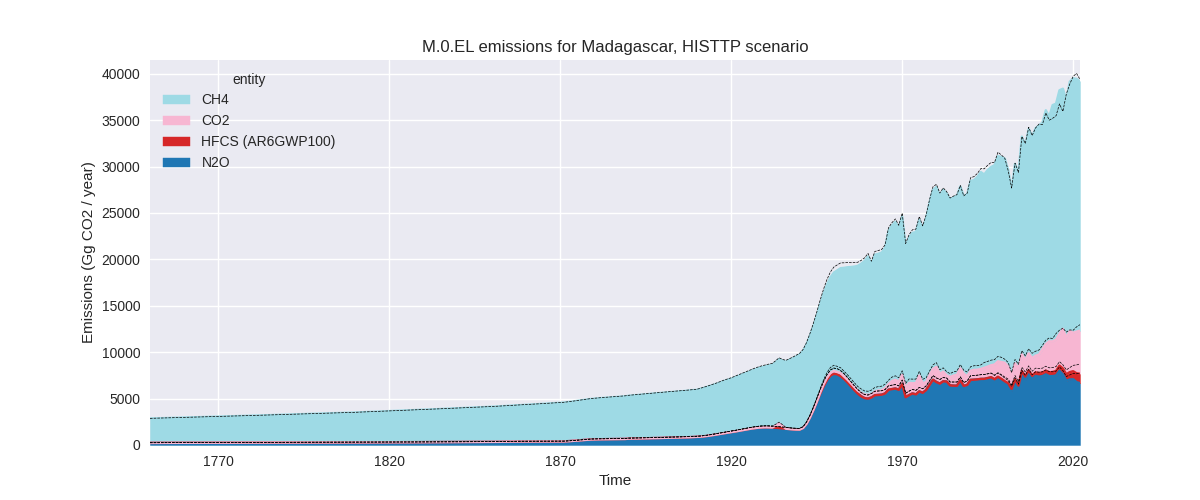
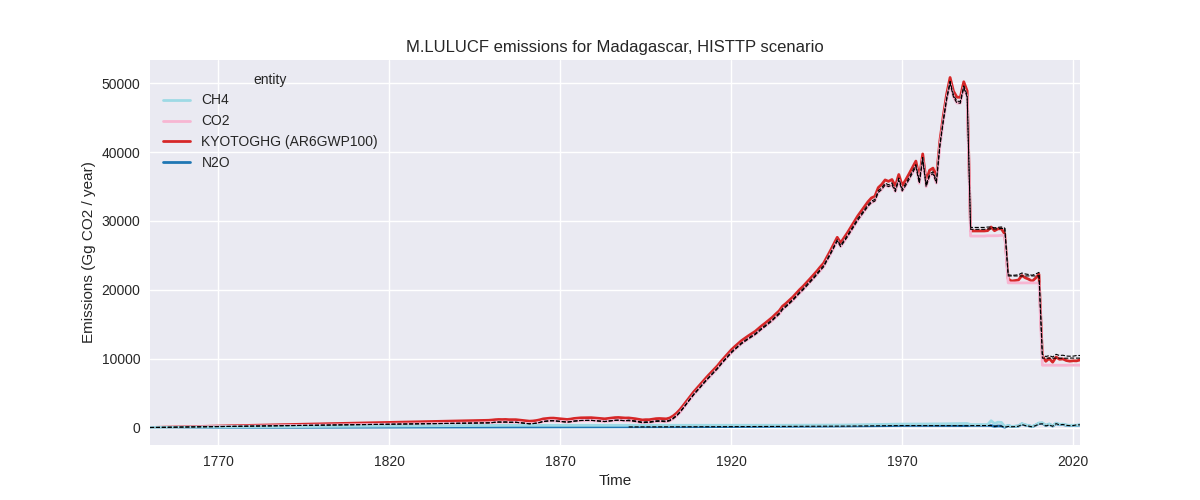
The following figures show the aggregate national total emissions excluding LULUCF AR6GWP100 for the third party priority scenario. The dotted linesshow the v2.5_final data.

Overview over changes
In the country reported priority scenario we have the following changes for aggregate Kyoto GHG and national total emissions excluding LULUCF (M.0.EL):
- Emissions in 2022 have changed by -2.7%% (-966.15 Gg CO2 / year)
- Emissions in 1990-2022 have changed by 2.0%% (621.36 Gg CO2 / year)
In the third party priority scenario we have the following changes for aggregate Kyoto GHG and national total emissions excluding LULUCF (M.0.EL):
- Emissions in 2022 have changed by -0.5%% (-212.40 Gg CO2 / year)
- Emissions in 1990-2022 have changed by 0.1%% (23.38 Gg CO2 / year)
Most important changes per scenario and time frame
In the country reported priority scenario the following sector-gas combinations have the highest absolute impact on national total KyotoGHG (AR6GWP100) emissions in 2022 (top 5):
- 1: 3.A, N2O with -1288.56 Gg CO2 / year (-25.0%)
- 2: M.AG.ELV, N2O with -760.07 Gg CO2 / year (-9.7%)
- 3: 3.A, CH4 with -580.68 Gg CO2 / year (-6.4%)
- 4: 1.A, CO2 with 438.74 Gg CO2 / year (10.8%)
- 5: 1.B.1, CH4 with 412.61 Gg CO2 / year (18.0%)
In the country reported priority scenario the following sector-gas combinations have the highest absolute impact on national total KyotoGHG (AR6GWP100) emissions in 1990-2022 (top 5):
- 1: 1.B.1, CH4 with 454.56 Gg CO2 / year (37.1%)
- 2: M.AG.ELV, CH4 with 103.86 Gg CO2 / year (3.3%)
- 3: 1.A, CH4 with 84.57 Gg CO2 / year (7.0%)
- 4: 3.A, N2O with -70.19 Gg CO2 / year (-1.7%)
- 5: 1.A, CO2 with 69.71 Gg CO2 / year (3.3%)
In the third party priority scenario the following sector-gas combinations have the highest absolute impact on national total KyotoGHG (AR6GWP100) emissions in 2022 (top 5):
- 1: M.AG.ELV, N2O with -951.66 Gg CO2 / year (-14.2%)
- 2: M.AG.ELV, CH4 with 836.62 Gg CO2 / year (10.6%)
- 3: 3.A, CH4 with -604.80 Gg CO2 / year (-6.5%)
- 4: 1.B.1, CH4 with 412.61 Gg CO2 / year (18.0%)
- 5: 1.A, CO2 with 291.56 Gg CO2 / year (7.1%)
In the third party priority scenario the following sector-gas combinations have the highest absolute impact on national total KyotoGHG (AR6GWP100) emissions in 1990-2022 (top 5):
- 1: M.AG.ELV, N2O with -462.27 Gg CO2 / year (-6.7%)
- 2: 1.B.1, CH4 with 454.56 Gg CO2 / year (37.1%)
- 3: M.AG.ELV, CH4 with 256.01 Gg CO2 / year (3.4%)
- 4: 1.A, CH4 with -203.19 Gg CO2 / year (-15.8%)
- 5: 1.B.2, CO2 with 37.85 Gg CO2 / year (568821.2%)
Notes on data changes
No country specific notes present for this changelog.
Changes by sector and gas
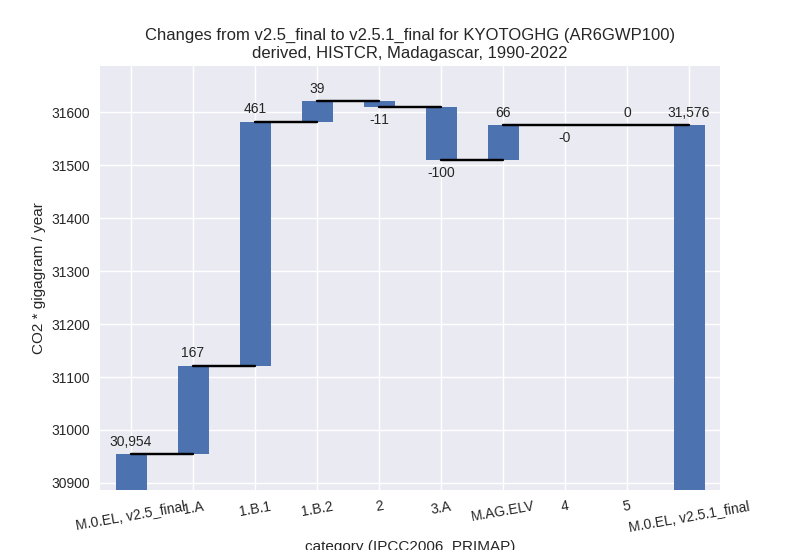
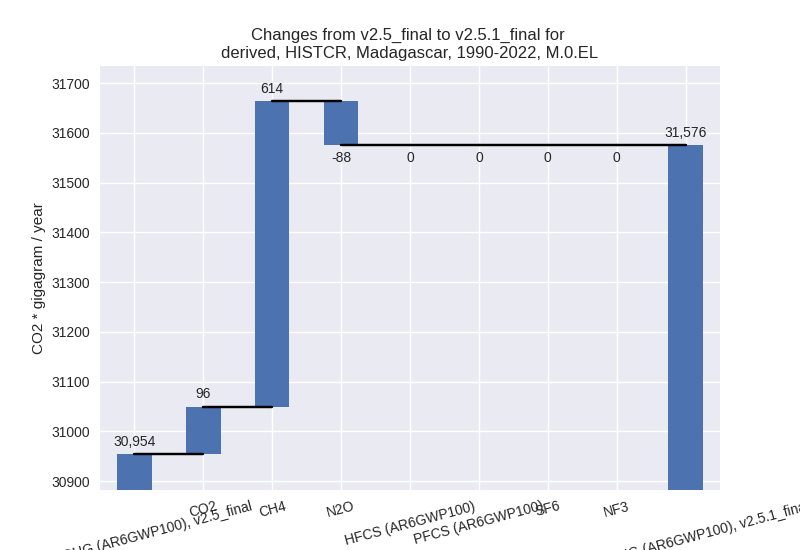
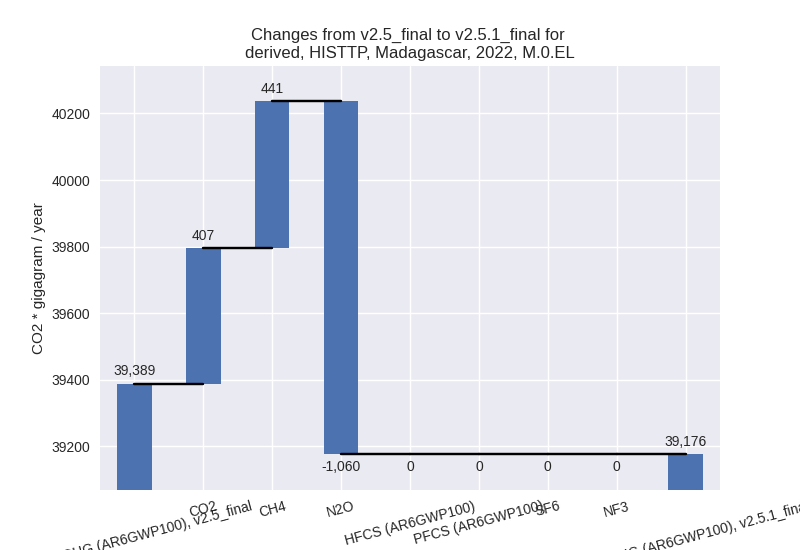
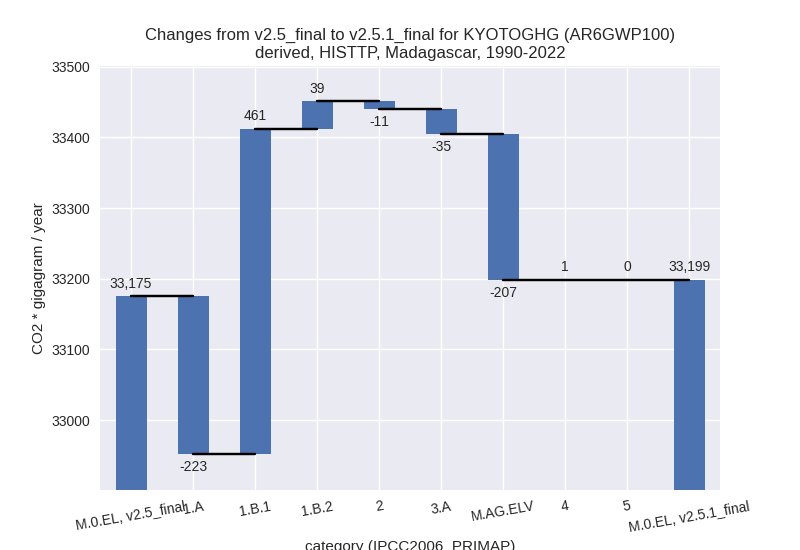
For each scenario and time frame the changes are displayed for all individual sectors and all individual gases. In the sector plot we use aggregate Kyoto GHGs in AR6GWP100. In the gas plot we usenational total emissions without LULUCF. ## country reported scenario
2022


1990-2022
third party scenario
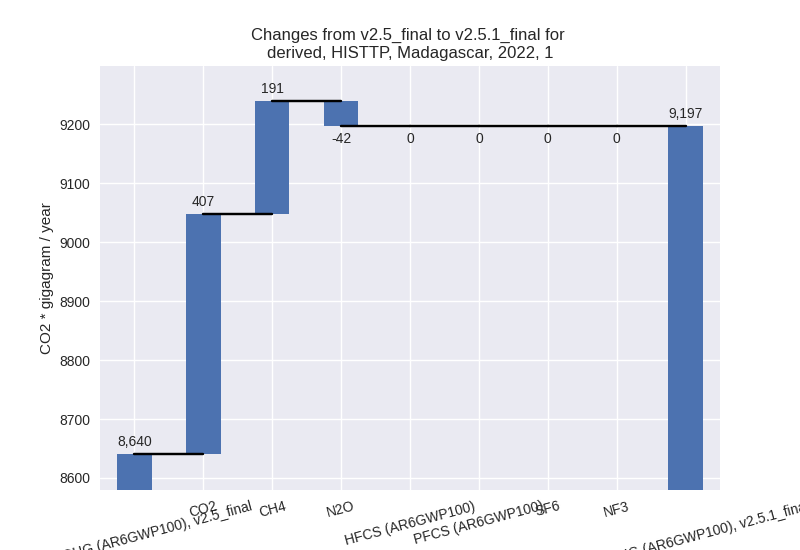
2022

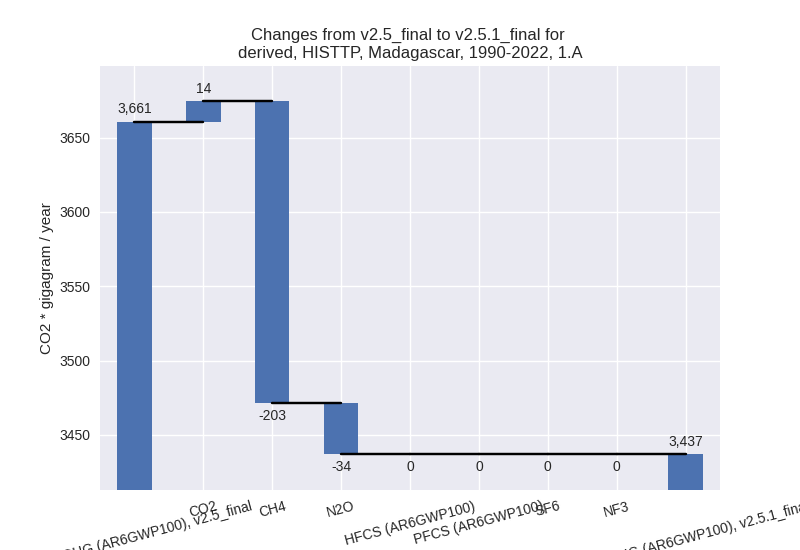
1990-2022

Detailed changes for the scenarios:
country reported scenario (HISTCR):
Most important changes per time frame
For 2022 the following sector-gas combinations have the highest absolute impact on national total KyotoGHG (AR6GWP100) emissions in 2022 (top 5):
- 1: 3.A, N2O with -1288.56 Gg CO2 / year (-25.0%)
- 2: M.AG.ELV, N2O with -760.07 Gg CO2 / year (-9.7%)
- 3: 3.A, CH4 with -580.68 Gg CO2 / year (-6.4%)
- 4: 1.A, CO2 with 438.74 Gg CO2 / year (10.8%)
- 5: 1.B.1, CH4 with 412.61 Gg CO2 / year (18.0%)
For 1990-2022 the following sector-gas combinations have the highest absolute impact on national total KyotoGHG (AR6GWP100) emissions in 1990-2022 (top 5):
- 1: 1.B.1, CH4 with 454.56 Gg CO2 / year (37.1%)
- 2: M.AG.ELV, CH4 with 103.86 Gg CO2 / year (3.3%)
- 3: 1.A, CH4 with 84.57 Gg CO2 / year (7.0%)
- 4: 3.A, N2O with -70.19 Gg CO2 / year (-1.7%)
- 5: 1.A, CO2 with 69.71 Gg CO2 / year (3.3%)
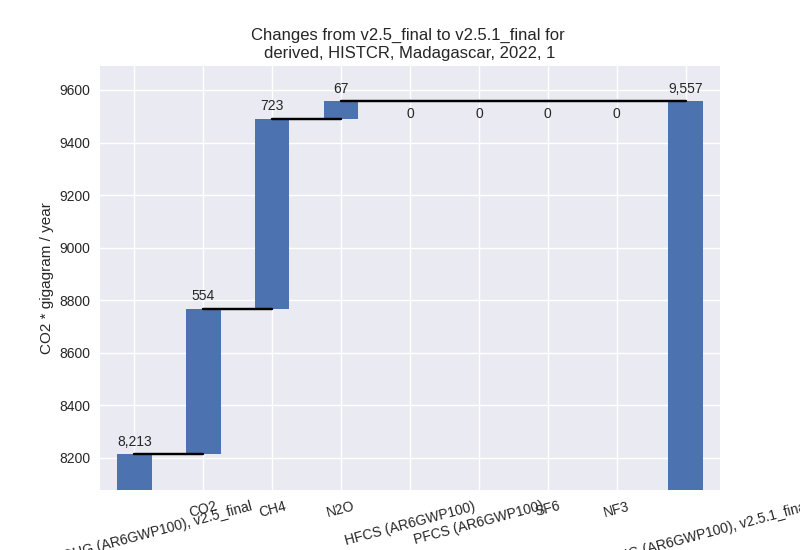
Changes in the main sectors for aggregate KyotoGHG (AR6GWP100) are
- 1: Total sectoral emissions in 2022 are 9557.00 Gg
CO2 / year which is 27.2% of M.0.EL emissions. 2022 Emissions have
changed by 16.4% (1343.86 Gg CO2 /
year). 1990-2022 Emissions have changed by 14.0% (666.58 Gg CO2 / year). For 2022 the
changes per gas
are:
For 1990-2022 the changes per gas are:
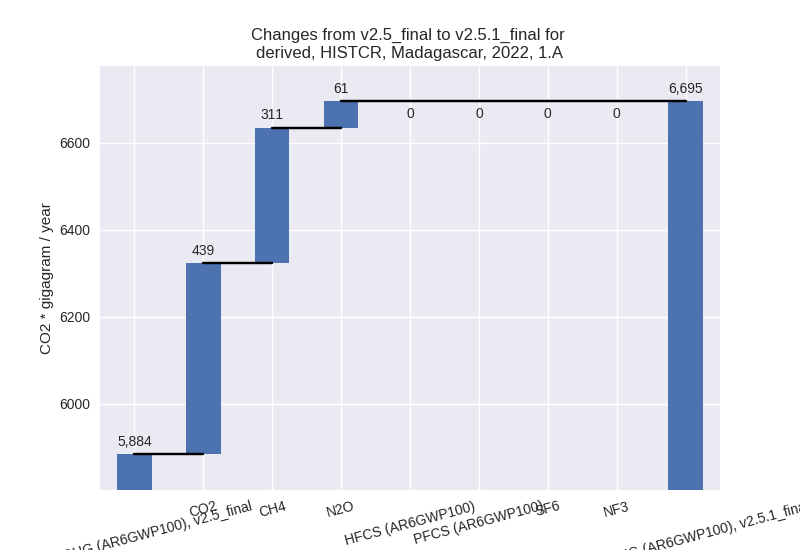
The changes come from the following subsectors:- 1.A: Total sectoral emissions in 2022 are 6694.84
Gg CO2 / year which is 70.1% of category 1 emissions. 2022 Emissions
have changed by 13.8% (810.65 Gg CO2
/ year). 1990-2022 Emissions have changed by 4.7% (167.43 Gg CO2 / year). For 2022 the
changes per gas
are:
For 1990-2022 the changes per gas are:
There is no subsector information available in PRIMAP-hist. - 1.B.1: Total sectoral emissions in 2022 are 2746.59
Gg CO2 / year which is 28.7% of category 1 emissions. 2022 Emissions
have changed by 18.0% (418.08 Gg CO2
/ year). 1990-2022 Emissions have changed by 37.1% (460.59 Gg CO2 / year). For 2022 the
changes per gas
are:

For 1990-2022 the changes per gas are:
There is no subsector information available in PRIMAP-hist. - 1.B.2: Total sectoral emissions in 2022 are 115.57
Gg CO2 / year which is 1.2% of category 1 emissions. 2022 Emissions have
changed by 26064.5% (115.13 Gg CO2 /
year). 1990-2022 Emissions have changed by 8631.7% (38.56 Gg CO2 / year). For 2022
the changes per gas
are:

For 1990-2022 the changes per gas are:
There is no subsector information available in PRIMAP-hist.
- 1.A: Total sectoral emissions in 2022 are 6694.84
Gg CO2 / year which is 70.1% of category 1 emissions. 2022 Emissions
have changed by 13.8% (810.65 Gg CO2
/ year). 1990-2022 Emissions have changed by 4.7% (167.43 Gg CO2 / year). For 2022 the
changes per gas
are:
- 2: Total sectoral emissions in 2022 are 1272.29 Gg CO2 / year which is 3.6% of M.0.EL emissions. 2022 Emissions have changed by -0.0% (-0.30 Gg CO2 / year). 1990-2022 Emissions have changed by -2.0% (-11.03 Gg CO2 / year).
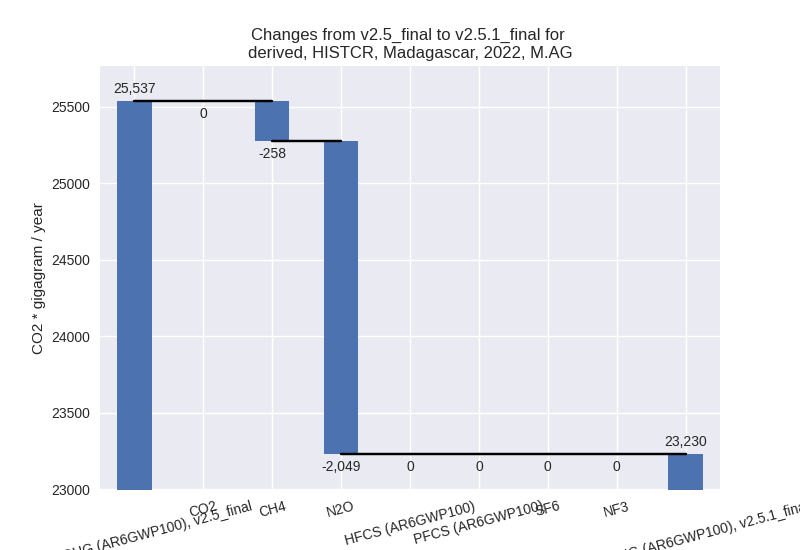
- M.AG: Total sectoral emissions in 2022 are 23230.04
Gg CO2 / year which is 66.0% of M.0.EL emissions. 2022 Emissions have
changed by -9.0% (-2306.94 Gg CO2 /
year). 1990-2022 Emissions have changed by -0.1% (-34.10 Gg CO2 / year). For 2022 the
changes per gas
are:
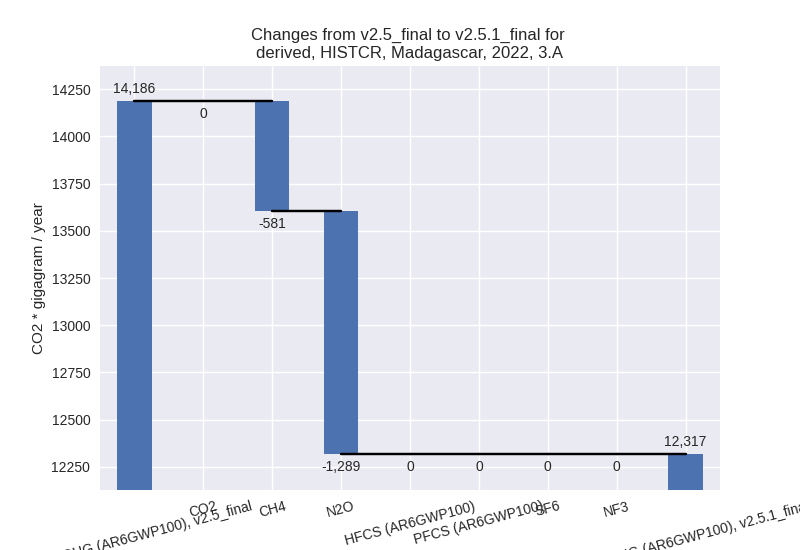
The changes come from the following subsectors:- 3.A: Total sectoral emissions in 2022 are 12317.20
Gg CO2 / year which is 53.0% of category M.AG emissions. 2022 Emissions
have changed by -13.2% (-1869.24 Gg
CO2 / year). 1990-2022 Emissions have changed by -0.8% (-100.13 Gg CO2 / year). For 2022
the changes per gas
are:
There is no subsector information available in PRIMAP-hist. - M.AG.ELV: Total sectoral emissions in 2022 are
10912.84 Gg CO2 / year which is 47.0% of category M.AG emissions. 2022
Emissions have changed by -3.9%
(-437.70 Gg CO2 / year). 1990-2022 Emissions have changed by 0.5% (66.03 Gg CO2 / year). For 2022 the
changes per gas
are:

There is no subsector information available in PRIMAP-hist.
- 3.A: Total sectoral emissions in 2022 are 12317.20
Gg CO2 / year which is 53.0% of category M.AG emissions. 2022 Emissions
have changed by -13.2% (-1869.24 Gg
CO2 / year). 1990-2022 Emissions have changed by -0.8% (-100.13 Gg CO2 / year). For 2022
the changes per gas
are:
- 4: Total sectoral emissions in 2022 are 899.92 Gg CO2 / year which is 2.6% of M.0.EL emissions. 2022 Emissions have changed by -0.4% (-3.78 Gg CO2 / year). 1990-2022 Emissions have changed by -0.0% (-0.11 Gg CO2 / year).
- 5: Total sectoral emissions in 2022 are 229.94 Gg CO2 / year which is 0.7% of M.0.EL emissions. 2022 Emissions have changed by 0.4% (1.02 Gg CO2 / year). 1990-2022 Emissions have changed by 0.0% (0.03 Gg CO2 / year).
third party scenario (HISTTP):
Most important changes per time frame
For 2022 the following sector-gas combinations have the highest absolute impact on national total KyotoGHG (AR6GWP100) emissions in 2022 (top 5):
- 1: M.AG.ELV, N2O with -951.66 Gg CO2 / year (-14.2%)
- 2: M.AG.ELV, CH4 with 836.62 Gg CO2 / year (10.6%)
- 3: 3.A, CH4 with -604.80 Gg CO2 / year (-6.5%)
- 4: 1.B.1, CH4 with 412.61 Gg CO2 / year (18.0%)
- 5: 1.A, CO2 with 291.56 Gg CO2 / year (7.1%)
For 1990-2022 the following sector-gas combinations have the highest absolute impact on national total KyotoGHG (AR6GWP100) emissions in 1990-2022 (top 5):
- 1: M.AG.ELV, N2O with -462.27 Gg CO2 / year (-6.7%)
- 2: 1.B.1, CH4 with 454.56 Gg CO2 / year (37.1%)
- 3: M.AG.ELV, CH4 with 256.01 Gg CO2 / year (3.4%)
- 4: 1.A, CH4 with -203.19 Gg CO2 / year (-15.8%)
- 5: 1.B.2, CO2 with 37.85 Gg CO2 / year (568821.2%)
Changes in the main sectors for aggregate KyotoGHG (AR6GWP100) are
- 1: Total sectoral emissions in 2022 are 9196.91 Gg
CO2 / year which is 23.5% of M.0.EL emissions. 2022 Emissions have
changed by 6.4% (556.57 Gg CO2 /
year). 1990-2022 Emissions have changed by 5.6% (275.66 Gg CO2 / year). For 2022 the
changes per gas
are:
For 1990-2022 the changes per gas are:
The changes come from the following subsectors:- 1.A: Total sectoral emissions in 2022 are 6334.75
Gg CO2 / year which is 68.9% of category 1 emissions. 2022 Emissions
have changed by 0.4% (23.36 Gg CO2 /
year). 1990-2022 Emissions have changed by -6.1% (-223.49 Gg CO2 / year). For
1990-2022 the changes per gas
are:
There is no subsector information available in PRIMAP-hist. - 1.B.1: Total sectoral emissions in 2022 are 2746.59
Gg CO2 / year which is 29.9% of category 1 emissions. 2022 Emissions
have changed by 18.0% (418.08 Gg CO2
/ year). 1990-2022 Emissions have changed by 37.1% (460.59 Gg CO2 / year). For 2022 the
changes per gas
are:

For 1990-2022 the changes per gas are: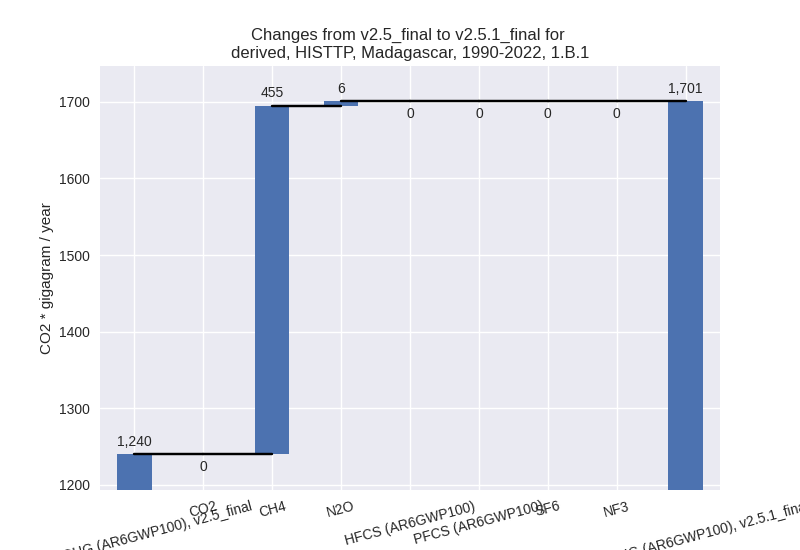
There is no subsector information available in PRIMAP-hist. - 1.B.2: Total sectoral emissions in 2022 are 115.57
Gg CO2 / year which is 1.3% of category 1 emissions. 2022 Emissions have
changed by 26064.5% (115.13 Gg CO2 /
year). 1990-2022 Emissions have changed by 8631.7% (38.56 Gg CO2 / year). For 2022
the changes per gas
are:
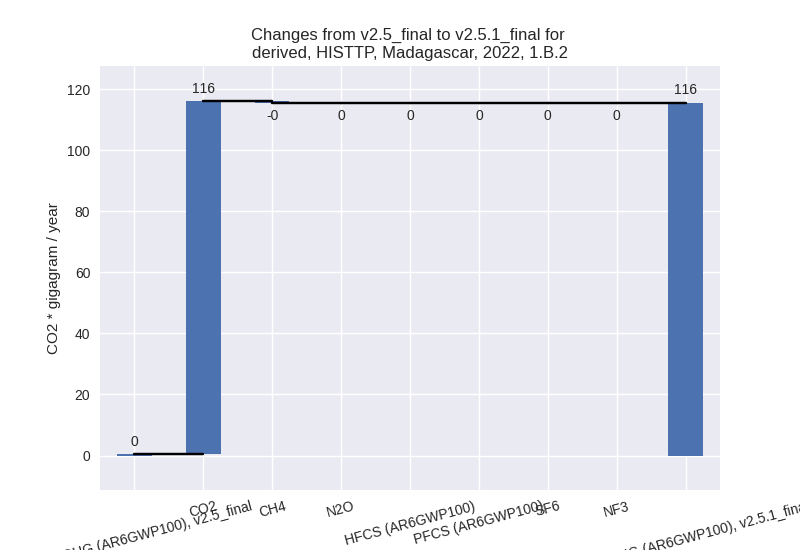
For 1990-2022 the changes per gas are: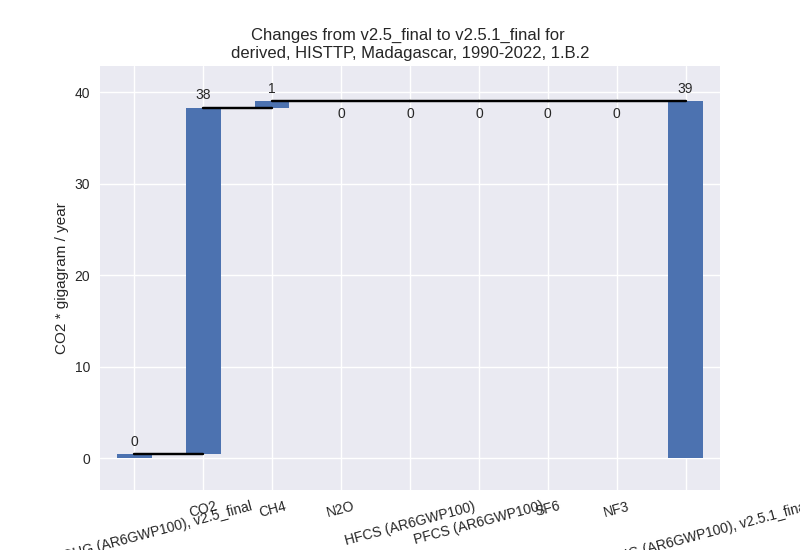
There is no subsector information available in PRIMAP-hist.
- 1.A: Total sectoral emissions in 2022 are 6334.75
Gg CO2 / year which is 68.9% of category 1 emissions. 2022 Emissions
have changed by 0.4% (23.36 Gg CO2 /
year). 1990-2022 Emissions have changed by -6.1% (-223.49 Gg CO2 / year). For
1990-2022 the changes per gas
are:
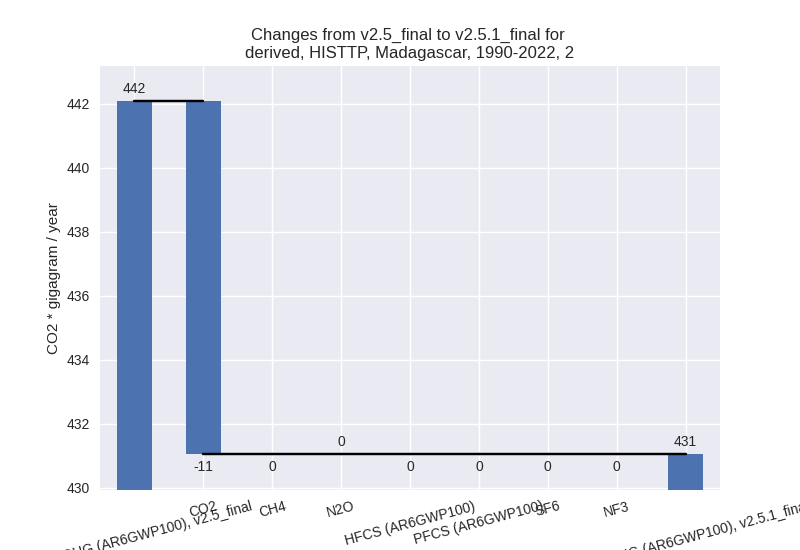
- 2: Total sectoral emissions in 2022 are 1145.78 Gg
CO2 / year which is 2.9% of M.0.EL emissions. 2022 Emissions have
changed by -0.0% (-0.30 Gg CO2 /
year). 1990-2022 Emissions have changed by -2.5% (-11.03 Gg CO2 / year). For
1990-2022 the changes per gas
are:
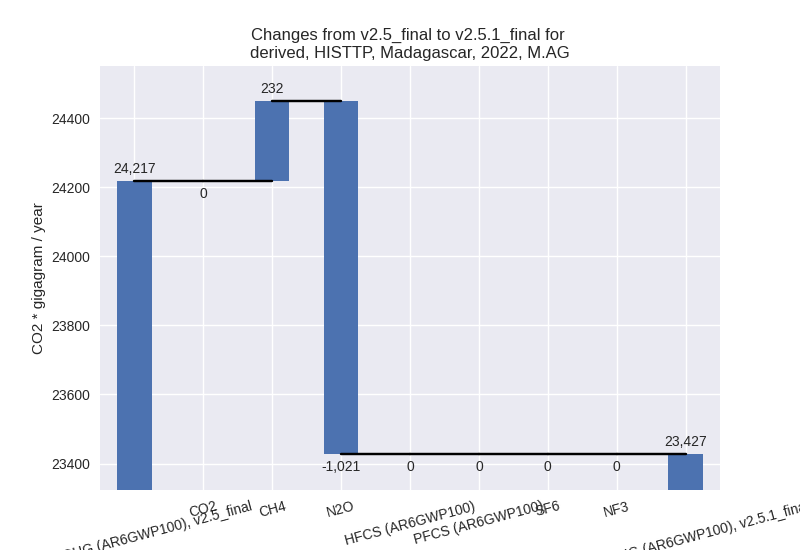
- M.AG: Total sectoral emissions in 2022 are 23427.08
Gg CO2 / year which is 59.8% of M.0.EL emissions. 2022 Emissions have
changed by -3.3% (-789.63 Gg CO2 /
year). 1990-2022 Emissions have changed by -1.0% (-241.88 Gg CO2 / year). For 2022
the changes per gas
are:
The changes come from the following subsectors:- 3.A: Total sectoral emissions in 2022 are 8970.65
Gg CO2 / year which is 38.3% of category M.AG emissions. 2022 Emissions
have changed by -7.0% (-674.59 Gg
CO2 / year). 1990-2022 Emissions have changed by -0.3% (-34.90 Gg CO2 / year). For 2022 the
changes per gas
are:
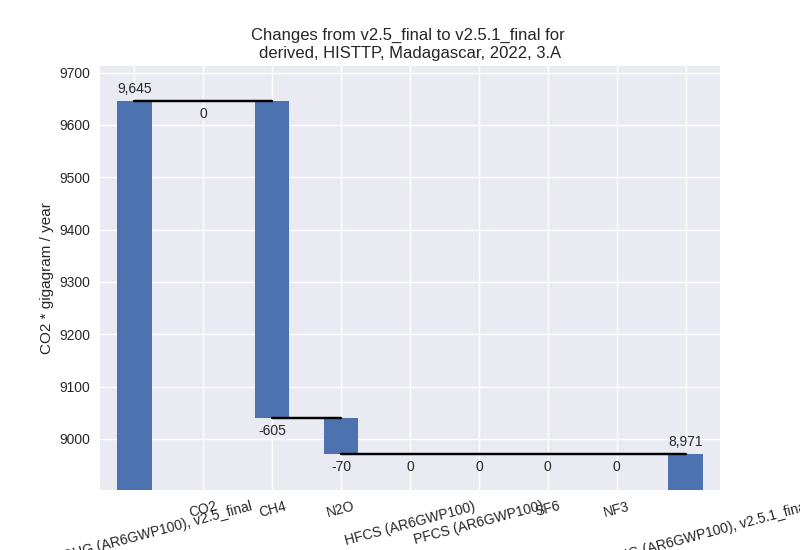
There is no subsector information available in PRIMAP-hist. - M.AG.ELV: Total sectoral emissions in 2022 are 14456.43 Gg CO2 / year which is 61.7% of category M.AG emissions. 2022 Emissions have changed by -0.8% (-115.03 Gg CO2 / year). 1990-2022 Emissions have changed by -1.4% (-206.98 Gg CO2 / year).
- 3.A: Total sectoral emissions in 2022 are 8970.65
Gg CO2 / year which is 38.3% of category M.AG emissions. 2022 Emissions
have changed by -7.0% (-674.59 Gg
CO2 / year). 1990-2022 Emissions have changed by -0.3% (-34.90 Gg CO2 / year). For 2022 the
changes per gas
are:
- 4: Total sectoral emissions in 2022 are 5176.54 Gg CO2 / year which is 13.2% of M.0.EL emissions. 2022 Emissions have changed by 0.4% (19.94 Gg CO2 / year). 1990-2022 Emissions have changed by 0.0% (0.60 Gg CO2 / year).
- 5: Total sectoral emissions in 2022 are 229.94 Gg CO2 / year which is 0.6% of M.0.EL emissions. 2022 Emissions have changed by 0.4% (1.02 Gg CO2 / year). 1990-2022 Emissions have changed by 0.0% (0.03 Gg CO2 / year).