Changes in PRIMAP-hist v2.5.1_final compared to v2.5_final for Mexico
2024-02-29
Johannes Gütschow
Change analysis for Mexico for PRIMAP-hist v2.5.1_final compared to v2.5_final
Overview over emissions by sector and gas
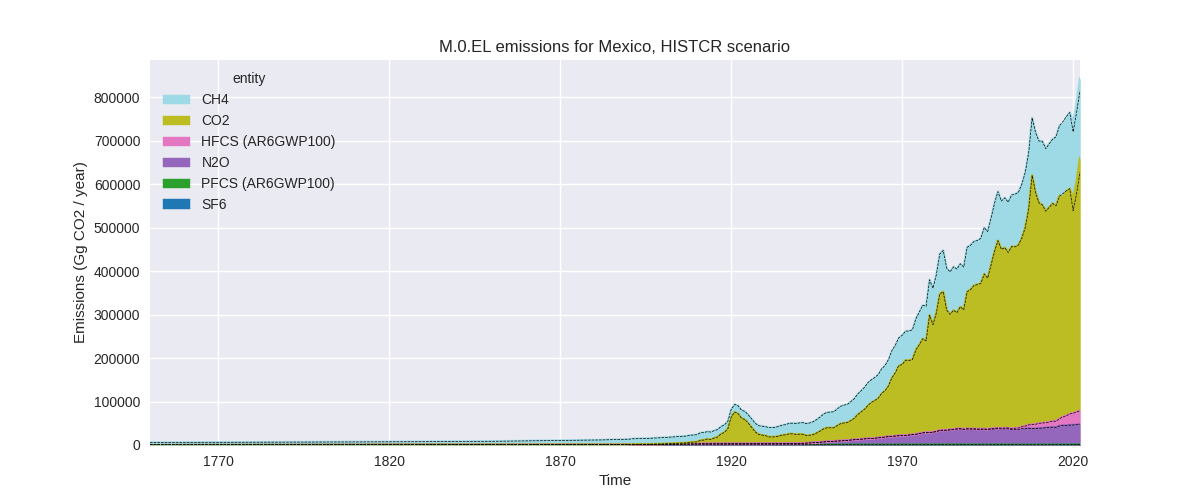
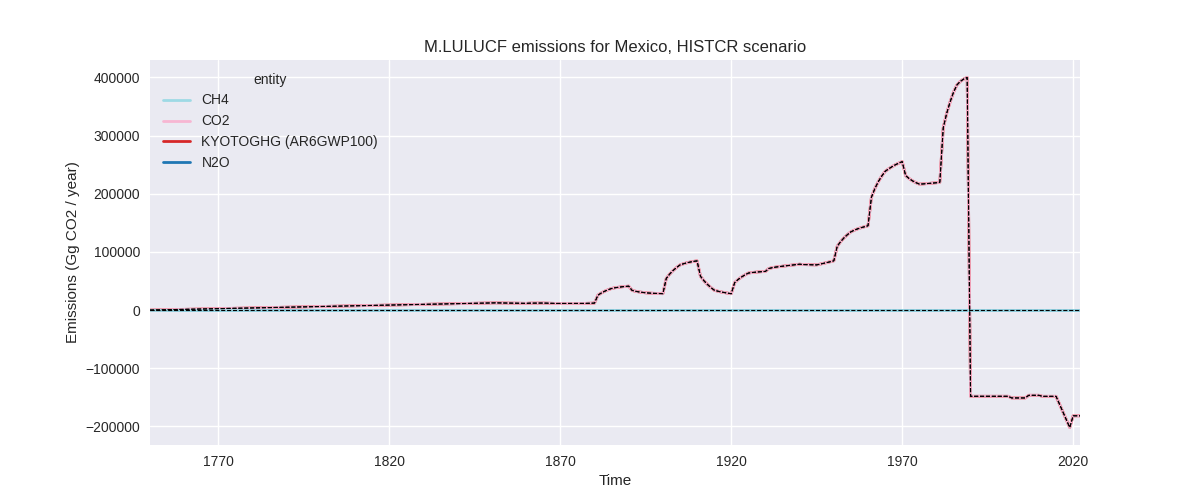
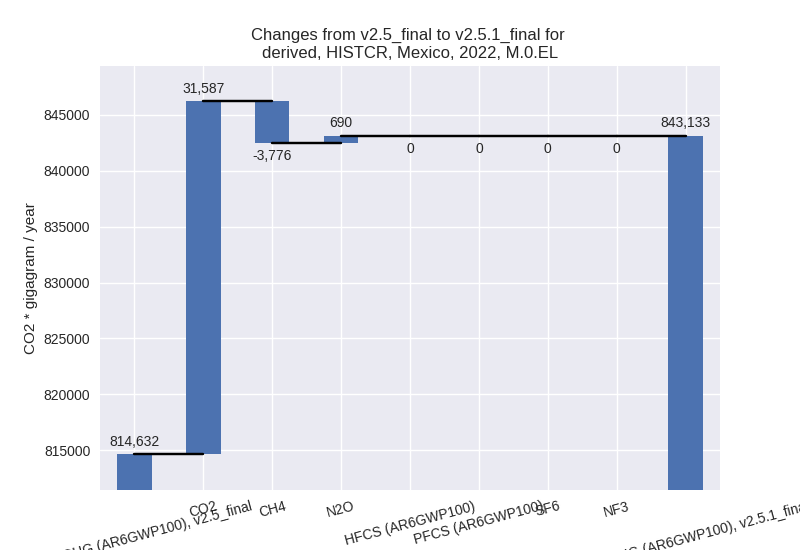
The following figures show the aggregate national total emissions excluding LULUCF AR6GWP100 for the country reported priority scenario. The dotted linesshow the v2.5_final data.

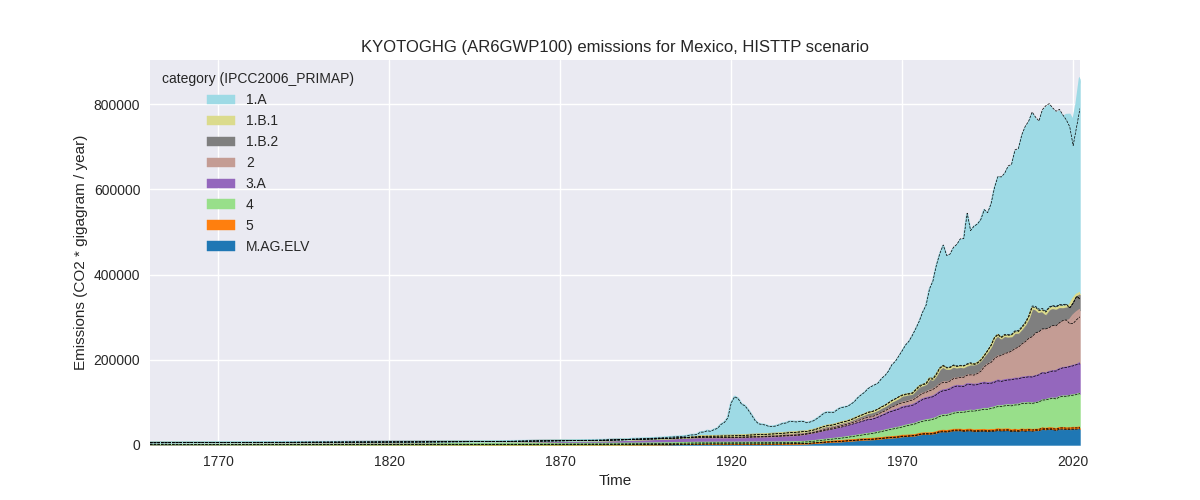
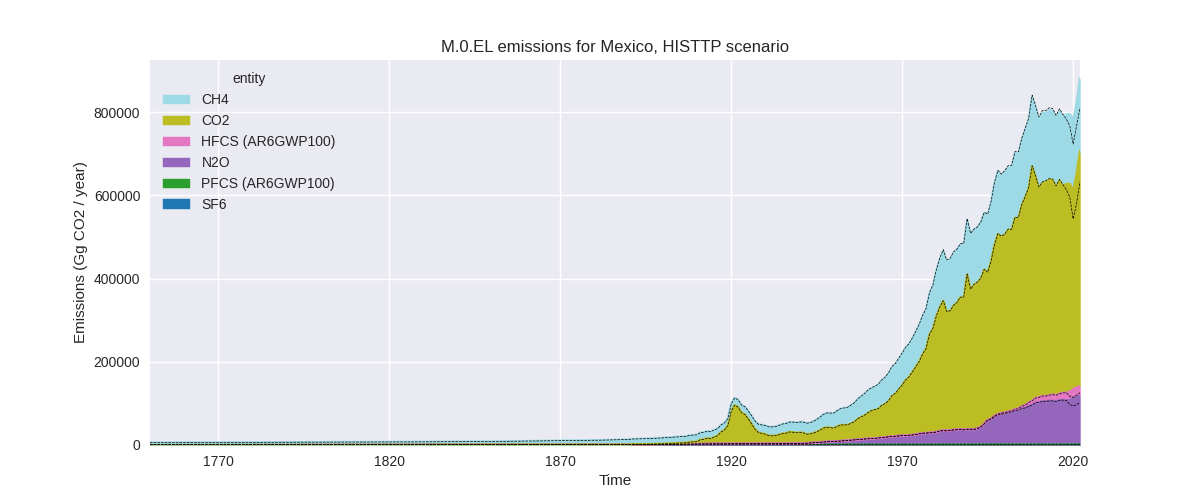
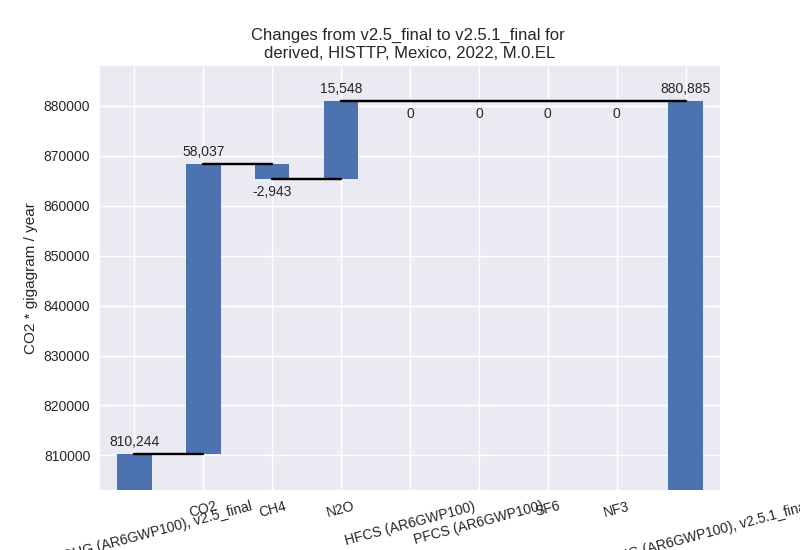
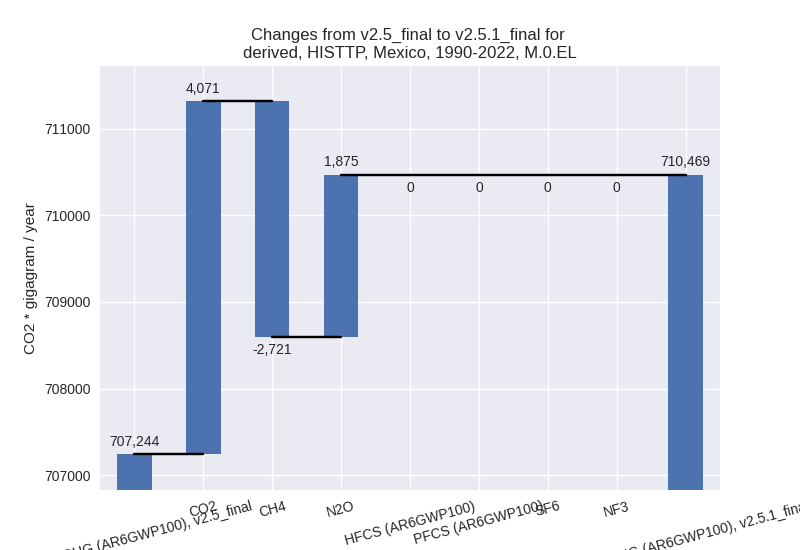
The following figures show the aggregate national total emissions excluding LULUCF AR6GWP100 for the third party priority scenario. The dotted linesshow the v2.5_final data.

Overview over changes
In the country reported priority scenario we have the following changes for aggregate Kyoto GHG and national total emissions excluding LULUCF (M.0.EL):
- Emissions in 2022 have changed by 3.5%% (28501.26 Gg CO2 / year)
- Emissions in 1990-2022 have changed by 0.3%% (1837.41 Gg CO2 / year)
In the third party priority scenario we have the following changes for aggregate Kyoto GHG and national total emissions excluding LULUCF (M.0.EL):
- Emissions in 2022 have changed by 8.7%% (70640.83 Gg CO2 / year)
- Emissions in 1990-2022 have changed by 0.5%% (3225.28 Gg CO2 / year)
Most important changes per scenario and time frame
In the country reported priority scenario the following sector-gas combinations have the highest absolute impact on national total KyotoGHG (AR6GWP100) emissions in 2022 (top 5):
- 1: 1.A, CO2 with 32727.59 Gg CO2 / year (7.2%)
- 2: 1.B.2, CH4 with -4212.72 Gg CO2 / year (-19.9%)
- 3: 3.A, CH4 with 3759.31 Gg CO2 / year (3.7%)
- 4: 4, CH4 with -2226.04 Gg CO2 / year (-4.0%)
- 5: 2, CO2 with -1926.14 Gg CO2 / year (-3.5%)
In the country reported priority scenario the following sector-gas combinations have the highest absolute impact on national total KyotoGHG (AR6GWP100) emissions in 1990-2022 (top 5):
- 1: 1.A, CO2 with 2494.78 Gg CO2 / year (0.7%)
- 2: 1.B.2, CH4 with -505.73 Gg CO2 / year (-3.1%)
- 3: 2, CO2 with -222.76 Gg CO2 / year (-0.6%)
- 4: 3.A, CH4 with 90.31 Gg CO2 / year (0.1%)
- 5: 4, CH4 with -67.46 Gg CO2 / year (-0.2%)
In the third party priority scenario the following sector-gas combinations have the highest absolute impact on national total KyotoGHG (AR6GWP100) emissions in 2022 (top 5):
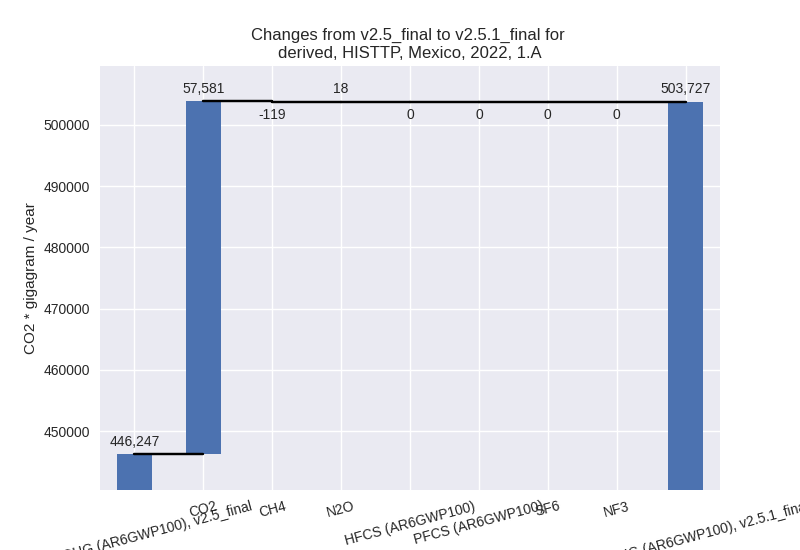
- 1: 1.A, CO2 with 57580.78 Gg CO2 / year (13.1%)
- 2: 2, N2O with 15285.31 Gg CO2 / year (26.3%)
- 3: 1.B.2, CH4 with -5384.98 Gg CO2 / year (-19.1%)
- 4: 3.A, CH4 with 1865.61 Gg CO2 / year (2.7%)
- 5: 1.B.1, CO2 with 1686.12 Gg CO2 / year (628.3%)
In the third party priority scenario the following sector-gas combinations have the highest absolute impact on national total KyotoGHG (AR6GWP100) emissions in 1990-2022 (top 5):
- 1: 1.A, CO2 with 5944.95 Gg CO2 / year (1.5%)
- 2: 1.B.2, CH4 with -3027.07 Gg CO2 / year (-9.5%)
- 3: 2, N2O with 1969.01 Gg CO2 / year (4.5%)
- 4: 2, CO2 with -1686.82 Gg CO2 / year (-6.9%)
- 5: 1.B.1, CH4 with 302.28 Gg CO2 / year (25.6%)
Notes on data changes
Here we list notes explaining important emissions changes for the country. ’' means that the following text only applies to the TP time series, while means that it only applies to the CR scenario. Otherwise the note applies to both scenarios.
- 1.A, CO2: The 2020 emissions drop in CDIAC 2023 is smaller than in EI 2023 leading to higher post-2019 emissions in PRIMAP-hist.
- 1.B.2, CH4: EDGAR 8.0 emissions are generally lower than EDGAR 7.0 and don’t show the 2020 emissions increase present in EDGAR 7.0. The TP scenario emissions are are generally lower, in the CR scenario only the emissions for 2020-2022 are lower.
- 2, N2O: EDGAR 8.0 emissions for 2.B (chemical industry) are higher than EDGAR 7.0 starting in 2019.
Changes by sector and gas
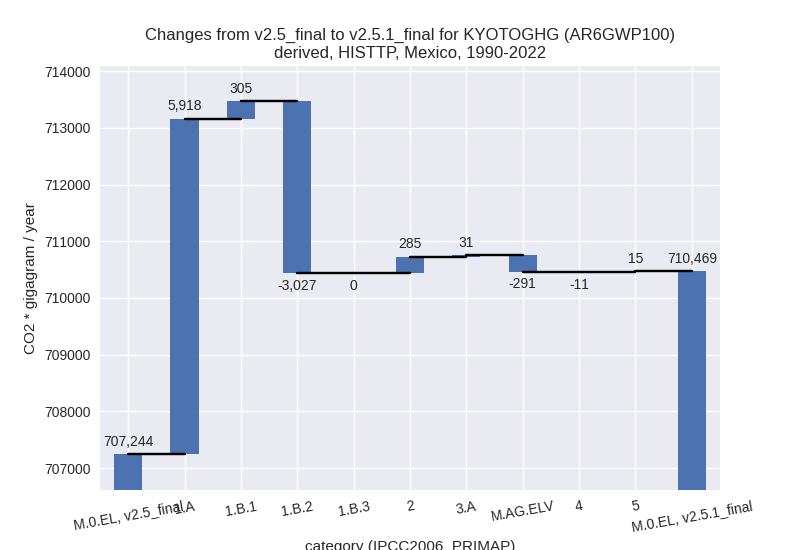
For each scenario and time frame the changes are displayed for all individual sectors and all individual gases. In the sector plot we use aggregate Kyoto GHGs in AR6GWP100. In the gas plot we usenational total emissions without LULUCF. ## country reported scenario
2022

1990-2022


third party scenario
2022

1990-2022
Detailed changes for the scenarios:
country reported scenario (HISTCR):
Most important changes per time frame
For 2022 the following sector-gas combinations have the highest absolute impact on national total KyotoGHG (AR6GWP100) emissions in 2022 (top 5):
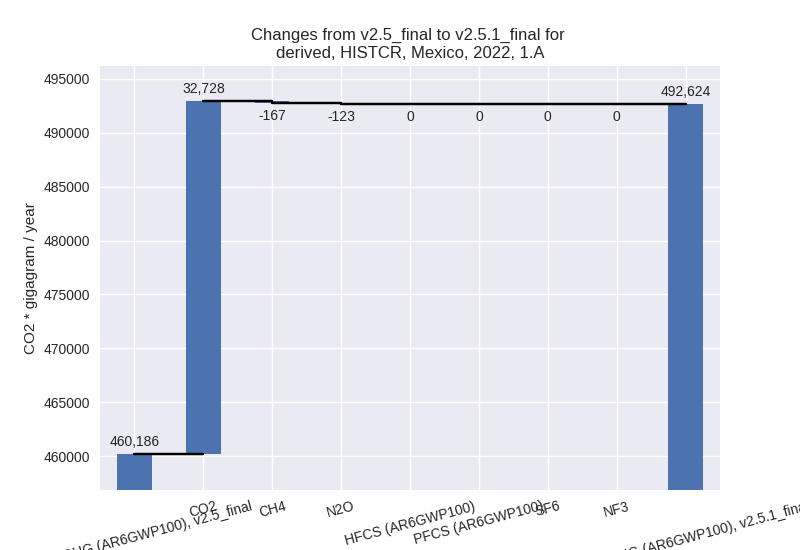
- 1: 1.A, CO2 with 32727.59 Gg CO2 / year (7.2%)
- 2: 1.B.2, CH4 with -4212.72 Gg CO2 / year (-19.9%)
- 3: 3.A, CH4 with 3759.31 Gg CO2 / year (3.7%)
- 4: 4, CH4 with -2226.04 Gg CO2 / year (-4.0%)
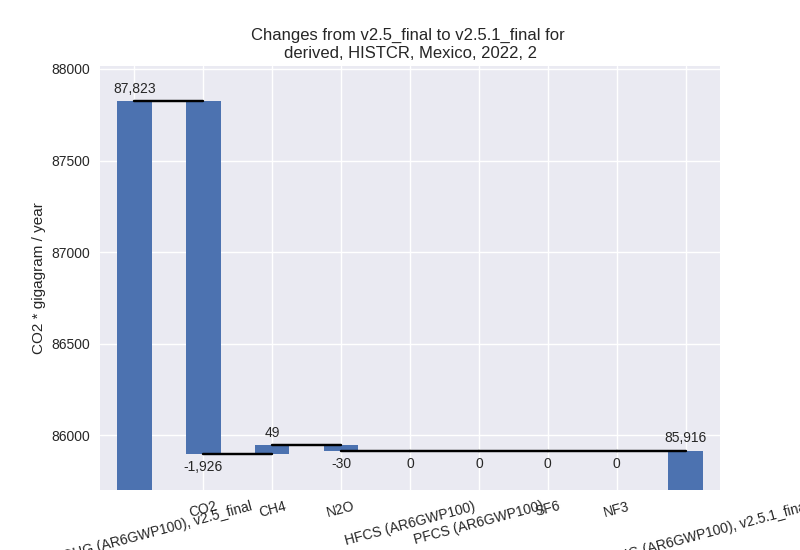
- 5: 2, CO2 with -1926.14 Gg CO2 / year (-3.5%)
For 1990-2022 the following sector-gas combinations have the highest absolute impact on national total KyotoGHG (AR6GWP100) emissions in 1990-2022 (top 5):
- 1: 1.A, CO2 with 2494.78 Gg CO2 / year (0.7%)
- 2: 1.B.2, CH4 with -505.73 Gg CO2 / year (-3.1%)
- 3: 2, CO2 with -222.76 Gg CO2 / year (-0.6%)
- 4: 3.A, CH4 with 90.31 Gg CO2 / year (0.1%)
- 5: 4, CH4 with -67.46 Gg CO2 / year (-0.2%)
Changes in the main sectors for aggregate KyotoGHG (AR6GWP100) are
- 1: Total sectoral emissions in 2022 are 548369.75
Gg CO2 / year which is 65.0% of M.0.EL emissions. 2022 Emissions have
changed by 5.3% (27668.66 Gg CO2 /
year). 1990-2022 Emissions have changed by 0.5% (1984.02 Gg CO2 / year). For 2022 the
changes per gas
are:

The changes come from the following subsectors:- 1.A: Total sectoral emissions in 2022 are 492623.67
Gg CO2 / year which is 93.3% of category 1 emissions. 2022 Emissions
have changed by 7.0% (32437.49 Gg
CO2 / year). 1990-2022 Emissions have changed by 0.7% (2461.10 Gg CO2 / year). For 2022 the
changes per gas
are:
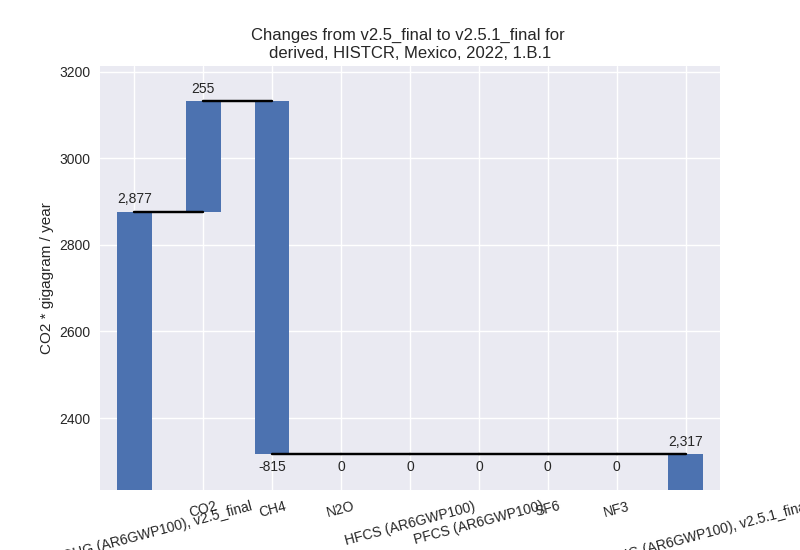
There is no subsector information available in PRIMAP-hist. - 1.B.1: Total sectoral emissions in 2022 are 2316.70
Gg CO2 / year which is 0.4% of category 1 emissions. 2022 Emissions have
changed by -19.5% (-559.80 Gg CO2 /
year). 1990-2022 Emissions have changed by 0.6% (28.59 Gg CO2 / year). For 2022 the
changes per gas
are:
There is no subsector information available in PRIMAP-hist. - 1.B.2: Total sectoral emissions in 2022 are
32882.52 Gg CO2 / year which is 6.2% of category 1 emissions. 2022
Emissions have changed by -11.3%
(-4209.02 Gg CO2 / year). 1990-2022 Emissions have changed by -1.3% (-505.66 Gg CO2 / year). For 2022
the changes per gas
are:

There is no subsector information available in PRIMAP-hist.
- 1.A: Total sectoral emissions in 2022 are 492623.67
Gg CO2 / year which is 93.3% of category 1 emissions. 2022 Emissions
have changed by 7.0% (32437.49 Gg
CO2 / year). 1990-2022 Emissions have changed by 0.7% (2461.10 Gg CO2 / year). For 2022 the
changes per gas
are:
- 2: Total sectoral emissions in 2022 are 85916.20 Gg
CO2 / year which is 10.2% of M.0.EL emissions. 2022 Emissions have
changed by -2.2% (-1907.22 Gg CO2 /
year). 1990-2022 Emissions have changed by -0.4% (-221.61 Gg CO2 / year). For 2022
the changes per gas
are:
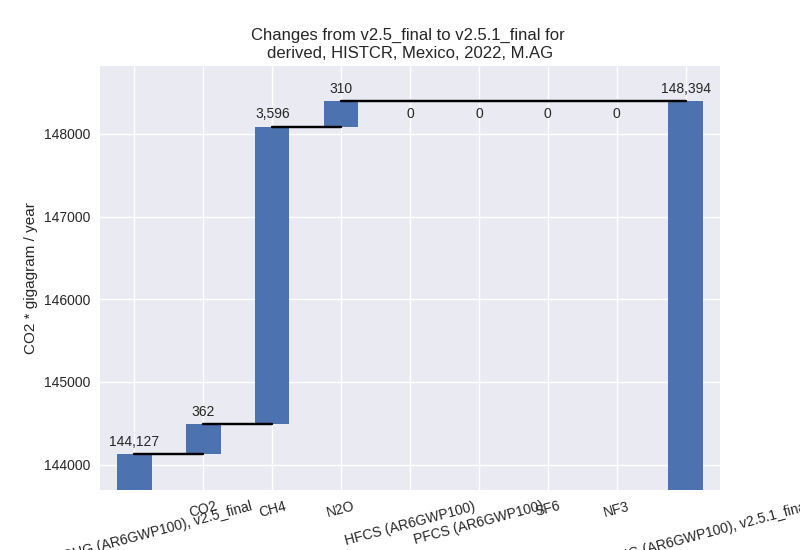
- M.AG: Total sectoral emissions in 2022 are
148394.13 Gg CO2 / year which is 17.6% of M.0.EL emissions. 2022
Emissions have changed by 3.0%
(4267.55 Gg CO2 / year). 1990-2022 Emissions have changed by 0.1% (121.29 Gg CO2 / year). For 2022 the
changes per gas
are:
The changes come from the following subsectors:- 3.A: Total sectoral emissions in 2022 are 115743.28
Gg CO2 / year which is 78.0% of category M.AG emissions. 2022 Emissions
have changed by 3.9% (4292.96 Gg CO2
/ year). 1990-2022 Emissions have changed by 0.1% (103.09 Gg CO2 / year). For 2022 the
changes per gas
are:
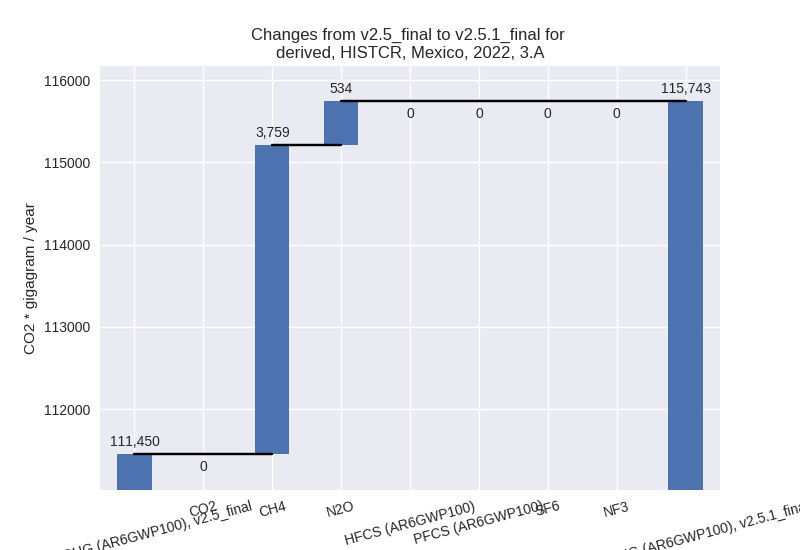
There is no subsector information available in PRIMAP-hist. - M.AG.ELV: Total sectoral emissions in 2022 are 32650.85 Gg CO2 / year which is 22.0% of category M.AG emissions. 2022 Emissions have changed by -0.1% (-25.41 Gg CO2 / year). 1990-2022 Emissions have changed by 0.1% (18.20 Gg CO2 / year).
- 3.A: Total sectoral emissions in 2022 are 115743.28
Gg CO2 / year which is 78.0% of category M.AG emissions. 2022 Emissions
have changed by 3.9% (4292.96 Gg CO2
/ year). 1990-2022 Emissions have changed by 0.1% (103.09 Gg CO2 / year). For 2022 the
changes per gas
are:
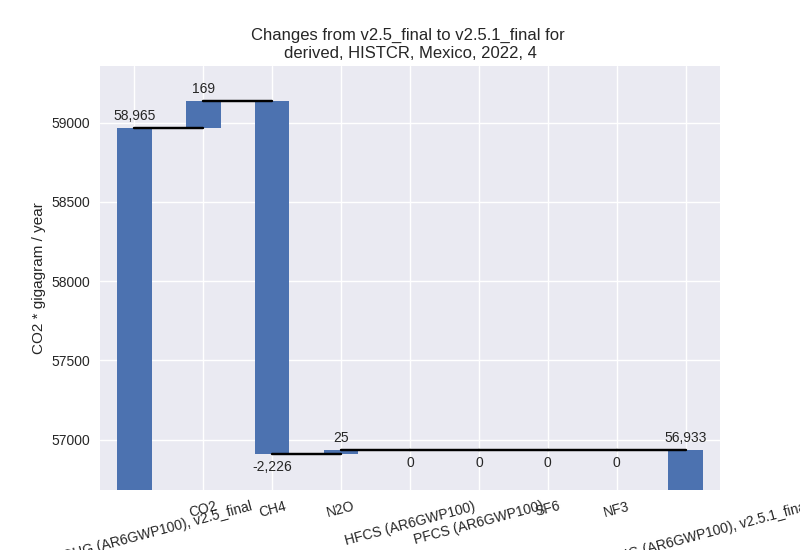
- 4: Total sectoral emissions in 2022 are 56932.80 Gg
CO2 / year which is 6.8% of M.0.EL emissions. 2022 Emissions have
changed by -3.4% (-2031.93 Gg CO2 /
year). 1990-2022 Emissions have changed by -0.2% (-61.57 Gg CO2 / year). For 2022 the
changes per gas
are:
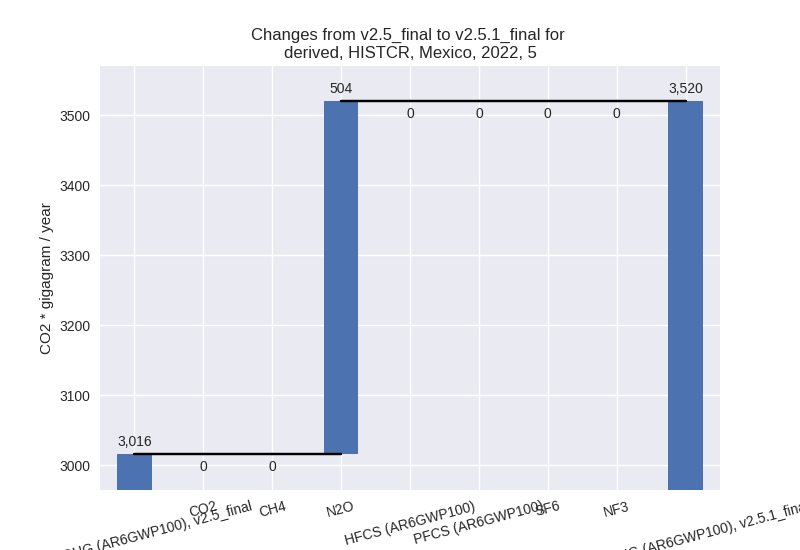
- 5: Total sectoral emissions in 2022 are 3520.25 Gg
CO2 / year which is 0.4% of M.0.EL emissions. 2022 Emissions have
changed by 16.7% (504.20 Gg CO2 /
year). 1990-2022 Emissions have changed by 0.6% (15.28 Gg CO2 / year). For 2022 the
changes per gas
are:
third party scenario (HISTTP):
Most important changes per time frame
For 2022 the following sector-gas combinations have the highest absolute impact on national total KyotoGHG (AR6GWP100) emissions in 2022 (top 5):
- 1: 1.A, CO2 with 57580.78 Gg CO2 / year (13.1%)
- 2: 2, N2O with 15285.31 Gg CO2 / year (26.3%)
- 3: 1.B.2, CH4 with -5384.98 Gg CO2 / year (-19.1%)
- 4: 3.A, CH4 with 1865.61 Gg CO2 / year (2.7%)
- 5: 1.B.1, CO2 with 1686.12 Gg CO2 / year (628.3%)
For 1990-2022 the following sector-gas combinations have the highest absolute impact on national total KyotoGHG (AR6GWP100) emissions in 1990-2022 (top 5):
- 1: 1.A, CO2 with 5944.95 Gg CO2 / year (1.5%)
- 2: 1.B.2, CH4 with -3027.07 Gg CO2 / year (-9.5%)
- 3: 2, N2O with 1969.01 Gg CO2 / year (4.5%)
- 4: 2, CO2 with -1686.82 Gg CO2 / year (-6.9%)
- 5: 1.B.1, CH4 with 302.28 Gg CO2 / year (25.6%)
Changes in the main sectors for aggregate KyotoGHG (AR6GWP100) are
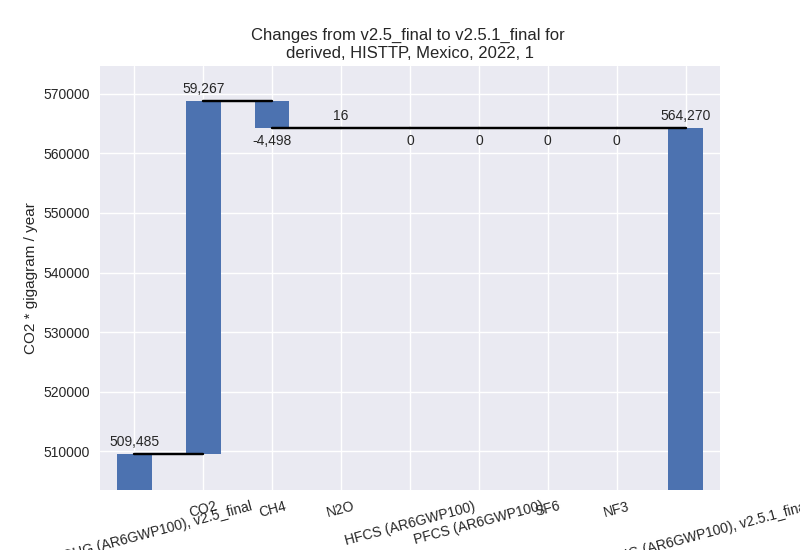
- 1: Total sectoral emissions in 2022 are 564270.26
Gg CO2 / year which is 64.1% of M.0.EL emissions. 2022 Emissions have
changed by 10.8% (54784.96 Gg CO2 /
year). 1990-2022 Emissions have changed by 0.7% (3196.09 Gg CO2 / year). For 2022 the
changes per gas
are:
The changes come from the following subsectors:- 1.A: Total sectoral emissions in 2022 are 503726.86
Gg CO2 / year which is 92.6% of category 1 emissions. 2022 Emissions
have changed by 12.9% (57479.42 Gg
CO2 / year). 1990-2022 Emissions have changed by 1.5% (5918.00 Gg CO2 / year). For 2022 the
changes per gas
are:
There is no subsector information available in PRIMAP-hist. - 1.B.1: Total sectoral emissions in 2022 are 3341.47
Gg CO2 / year which is 0.6% of category 1 emissions. 2022 Emissions have
changed by 414.5% (2692.01 Gg CO2 /
year). 1990-2022 Emissions have changed by 16.0% (305.31 Gg CO2 / year). For 2022 the
changes per gas
are:
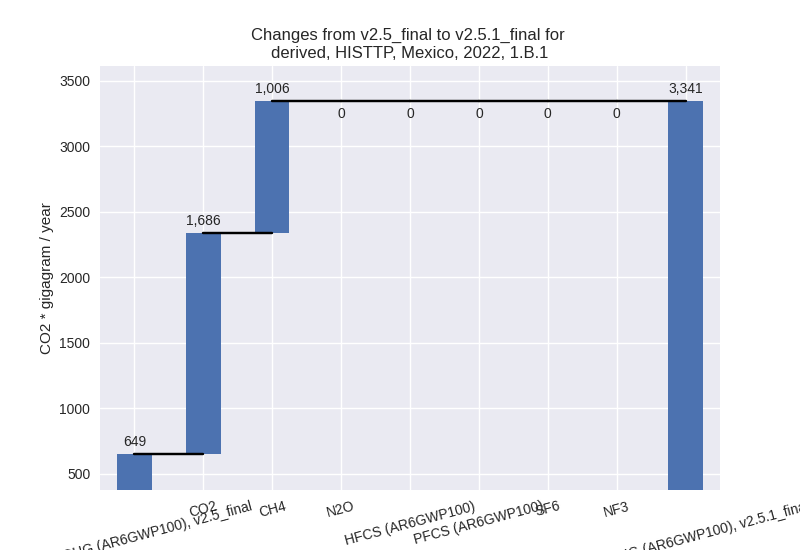
For 1990-2022 the changes per gas are: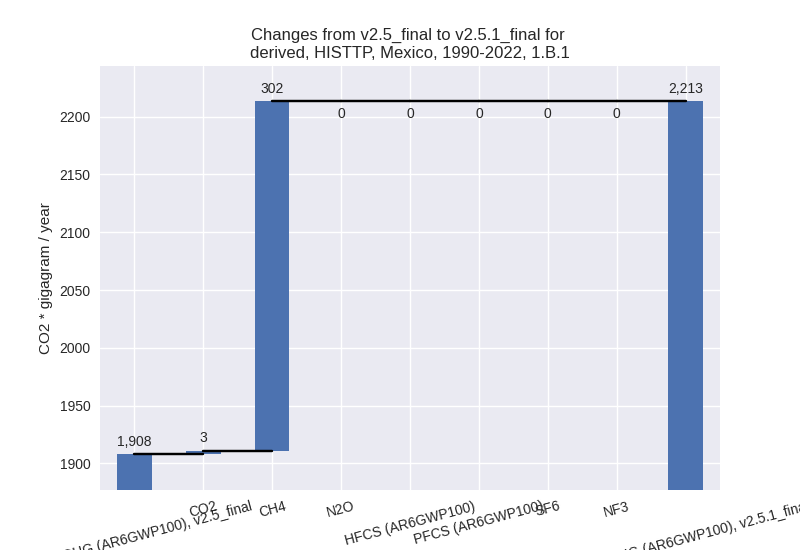
There is no subsector information available in PRIMAP-hist. - 1.B.2: Total sectoral emissions in 2022 are
36655.07 Gg CO2 / year which is 6.7% of category 1 emissions. 2022
Emissions have changed by -12.8%
(-5386.46 Gg CO2 / year). 1990-2022 Emissions have changed by -7.4% (-3027.22 Gg CO2 / year). For 2022
the changes per gas
are:

For 1990-2022 the changes per gas are: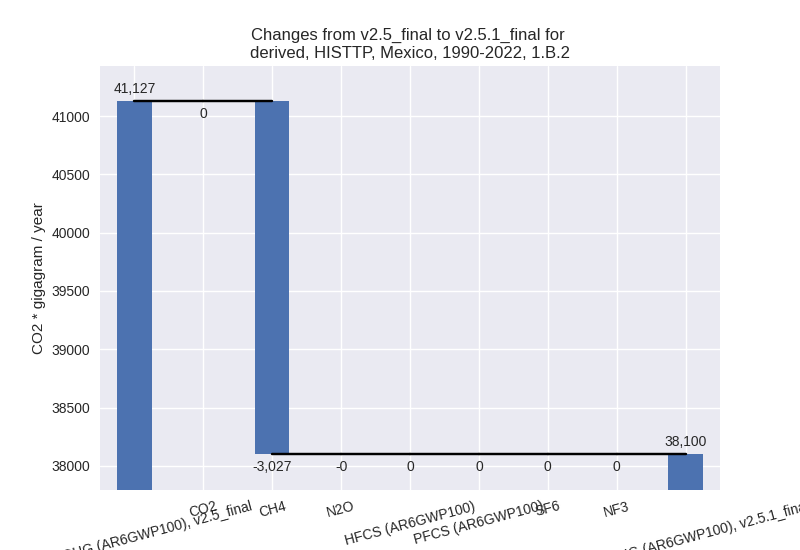
There is no subsector information available in PRIMAP-hist.
- 1.A: Total sectoral emissions in 2022 are 503726.86
Gg CO2 / year which is 92.6% of category 1 emissions. 2022 Emissions
have changed by 12.9% (57479.42 Gg
CO2 / year). 1990-2022 Emissions have changed by 1.5% (5918.00 Gg CO2 / year). For 2022 the
changes per gas
are:
- 2: Total sectoral emissions in 2022 are 124714.26
Gg CO2 / year which is 14.2% of M.0.EL emissions. 2022 Emissions have
changed by 13.0% (14340.49 Gg CO2 /
year). 1990-2022 Emissions have changed by 0.4% (284.98 Gg CO2 / year). For 2022 the
changes per gas
are:

- M.AG: Total sectoral emissions in 2022 are 109165.68 Gg CO2 / year which is 12.4% of M.0.EL emissions. 2022 Emissions have changed by 1.3% (1380.90 Gg CO2 / year). 1990-2022 Emissions have changed by -0.3% (-259.87 Gg CO2 / year).
- 4: Total sectoral emissions in 2022 are 79214.21 Gg CO2 / year which is 9.0% of M.0.EL emissions. 2022 Emissions have changed by -0.5% (-369.71 Gg CO2 / year). 1990-2022 Emissions have changed by -0.0% (-11.20 Gg CO2 / year).
- 5: Total sectoral emissions in 2022 are 3520.25 Gg
CO2 / year which is 0.4% of M.0.EL emissions. 2022 Emissions have
changed by 16.7% (504.20 Gg CO2 /
year). 1990-2022 Emissions have changed by 0.6% (15.28 Gg CO2 / year). For 2022 the
changes per gas
are:
