Changes in PRIMAP-hist v2.5.1_final compared to v2.5_final for Myanmar
2024-02-29
Johannes Gütschow
Change analysis for Myanmar for PRIMAP-hist v2.5.1_final compared to v2.5_final
Overview over emissions by sector and gas
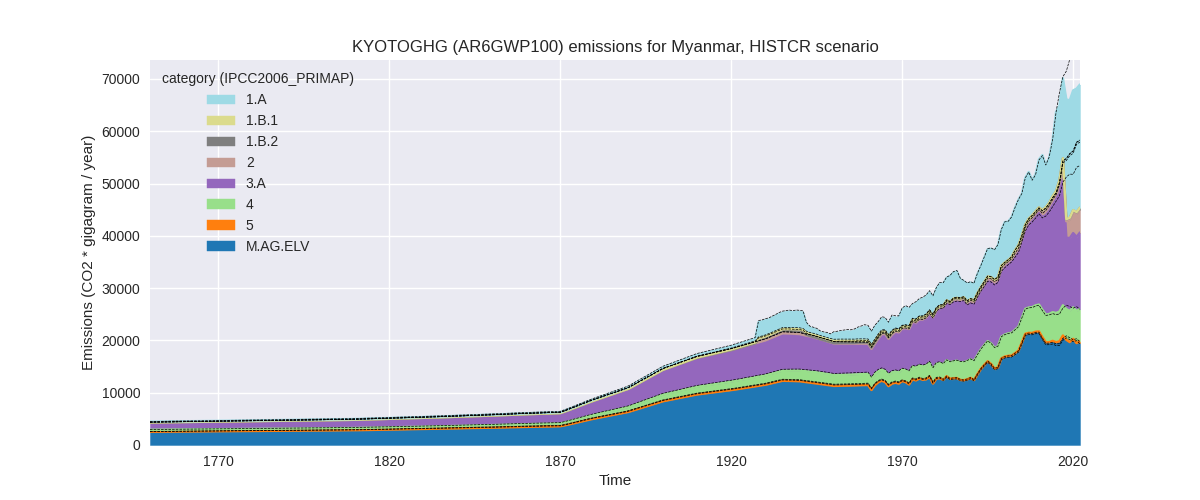
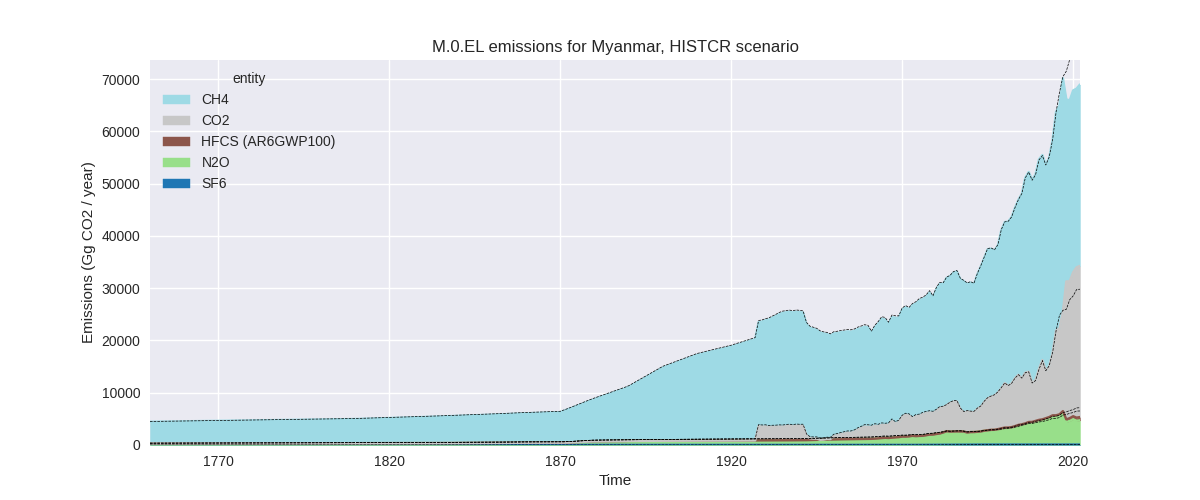
The following figures show the aggregate national total emissions excluding LULUCF AR6GWP100 for the country reported priority scenario. The dotted linesshow the v2.5_final data.
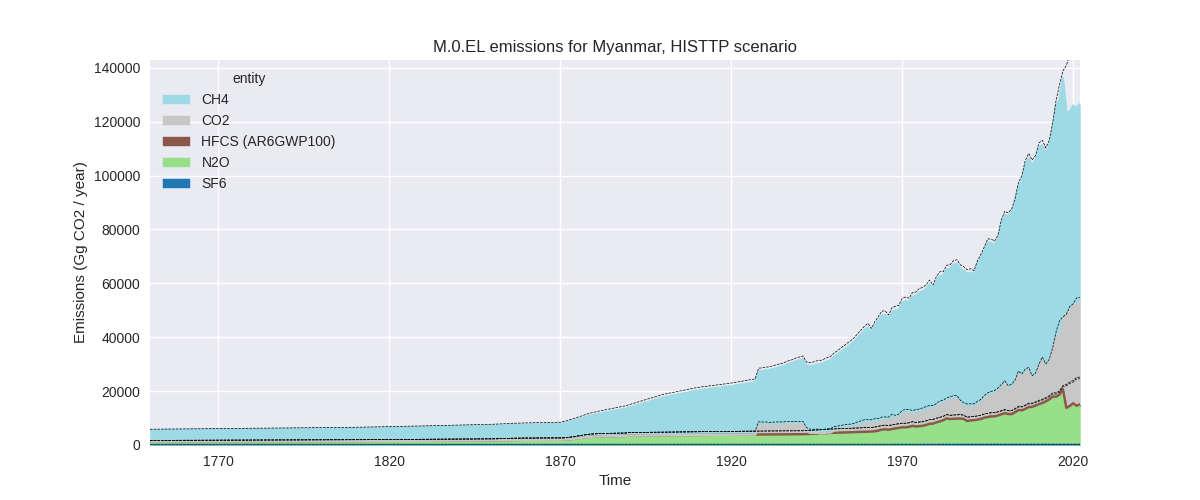
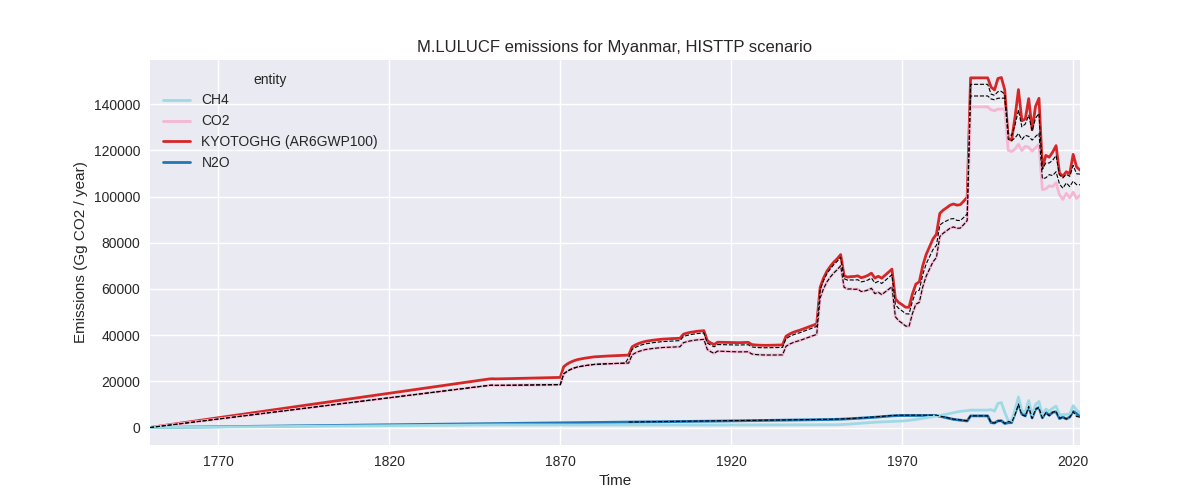
The following figures show the aggregate national total emissions excluding LULUCF AR6GWP100 for the third party priority scenario. The dotted linesshow the v2.5_final data.

Overview over changes
In the country reported priority scenario we have the following changes for aggregate Kyoto GHG and national total emissions excluding LULUCF (M.0.EL):
- Emissions in 2022 have changed by -10.4%% (-7992.35 Gg CO2 / year)
- Emissions in 1990-2022 have changed by -2.4%% (-1234.38 Gg CO2 / year)
In the third party priority scenario we have the following changes for aggregate Kyoto GHG and national total emissions excluding LULUCF (M.0.EL):
- Emissions in 2022 have changed by -15.8%% (-23737.19 Gg CO2 / year)
- Emissions in 1990-2022 have changed by -4.7%% (-4808.82 Gg CO2 / year)
Most important changes per scenario and time frame
In the country reported priority scenario the following sector-gas combinations have the highest absolute impact on national total KyotoGHG (AR6GWP100) emissions in 2022 (top 5):
- 1: 3.A, CH4 with -12805.43 Gg CO2 / year (-46.8%)
- 2: 1.A, CO2 with 4949.31 Gg CO2 / year (26.8%)
- 3: M.AG.ELV, N2O with -1584.47 Gg CO2 / year (-33.0%)
- 4: M.AG.ELV, CO2 with 1357.53 Gg CO2 / year (400.8%)
- 5: M.AG.ELV, CH4 with 429.67 Gg CO2 / year (3.0%)
In the country reported priority scenario the following sector-gas combinations have the highest absolute impact on national total KyotoGHG (AR6GWP100) emissions in 1990-2022 (top 5):
- 1: 3.A, CH4 with -1778.96 Gg CO2 / year (-10.7%)
- 2: 1.A, CO2 with 609.88 Gg CO2 / year (6.5%)
- 3: M.AG.ELV, N2O with -195.45 Gg CO2 / year (-6.5%)
- 4: M.AG.ELV, CO2 with 169.45 Gg CO2 / year (101.2%)
- 5: 2, CO2 with -42.03 Gg CO2 / year (-4.1%)
In the third party priority scenario the following sector-gas combinations have the highest absolute impact on national total KyotoGHG (AR6GWP100) emissions in 2022 (top 5):
- 1: 3.A, CH4 with -20909.60 Gg CO2 / year (-46.8%)
- 2: M.AG.ELV, N2O with -7258.33 Gg CO2 / year (-42.5%)
- 3: 1.A, CO2 with 6995.52 Gg CO2 / year (26.7%)
- 4: 3.A, N2O with -2623.01 Gg CO2 / year (-54.3%)
- 5: 1.B.2, CH4 with -1852.81 Gg CO2 / year (-23.5%)
In the third party priority scenario the following sector-gas combinations have the highest absolute impact on national total KyotoGHG (AR6GWP100) emissions in 1990-2022 (top 5):
- 1: 3.A, CH4 with -2904.81 Gg CO2 / year (-10.6%)
- 2: M.AG.ELV, N2O with -2195.10 Gg CO2 / year (-19.8%)
- 3: 1.A, CO2 with 904.57 Gg CO2 / year (7.0%)
- 4: 1.B.2, CH4 with -386.45 Gg CO2 / year (-9.4%)
- 5: 3.A, N2O with -371.94 Gg CO2 / year (-12.2%)
Notes on data changes
Here we list notes explaining important emissions changes for the country. ’' means that the following text only applies to the TP time series, while means that it only applies to the CR scenario. Otherwise the note applies to both scenarios.
- 3.A, CH4: TODO: investigate the source of the emissions drop in 2018. It’s present for 3.A.1 and 3.A.2 and for CH4 and N2O
- 1.A, CO2: The updated CDIAC data shows a strong increase in emissions from 2017 to 2020 leading to higher emissions in PRIMAP-hist. The EDGAR 7.0 data used for the years post 2017 in v2.5 shows a less pronounced emissions increase.
- M.AG.ELV, N2O: TODO: investigate reason fro drop.
Changes by sector and gas
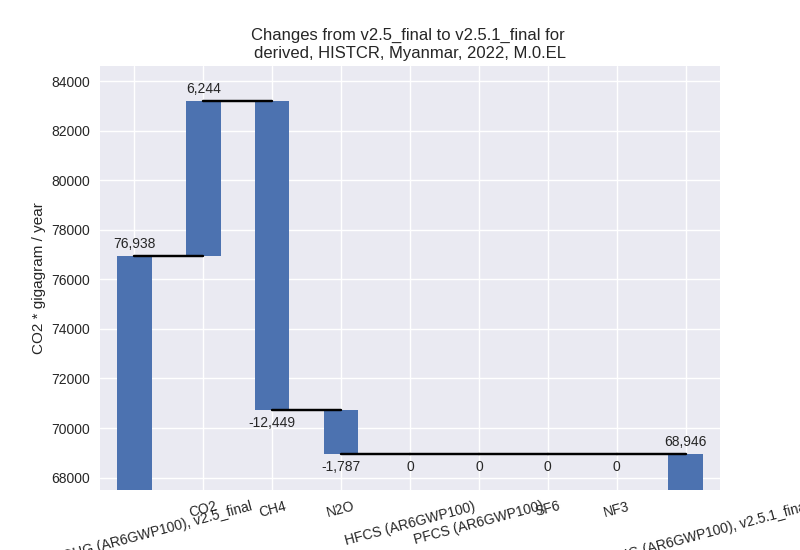
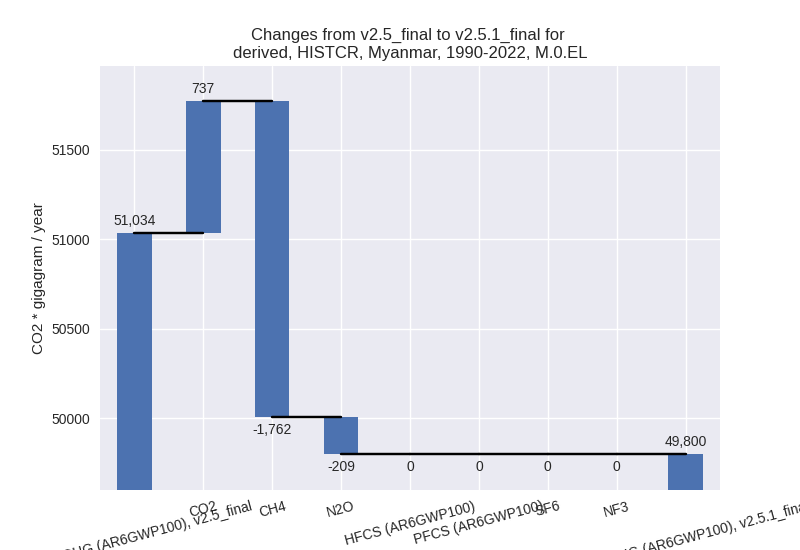
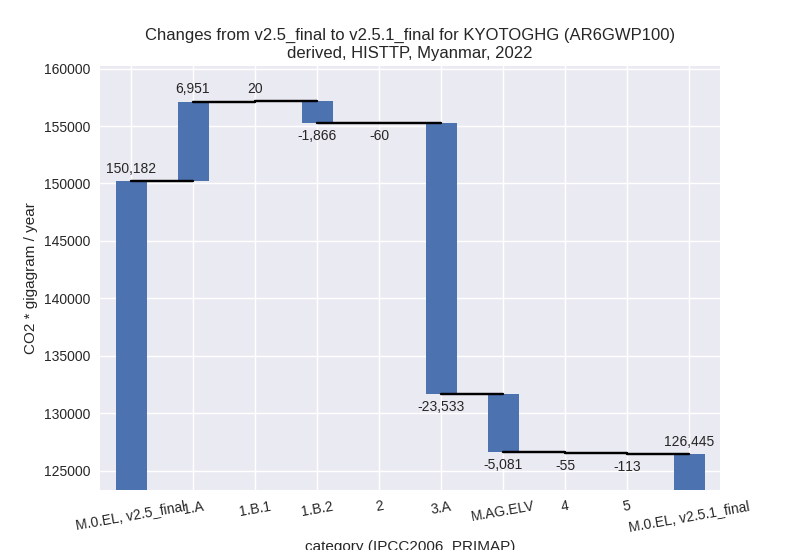
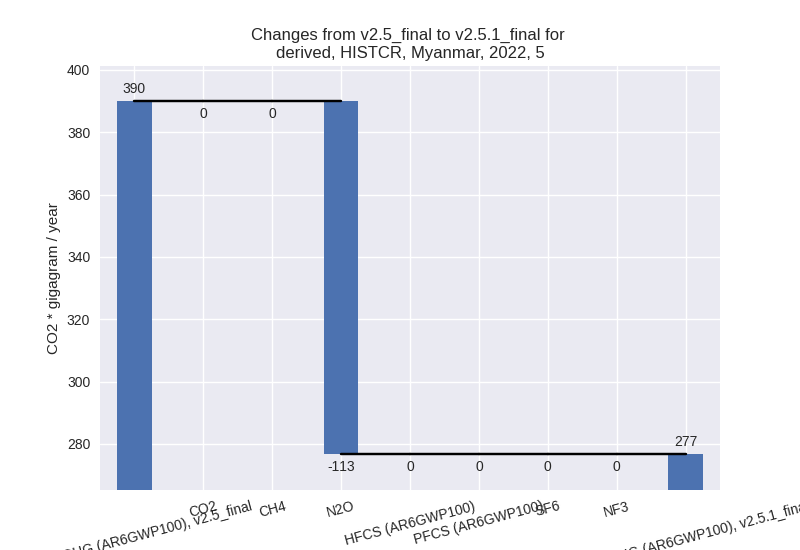
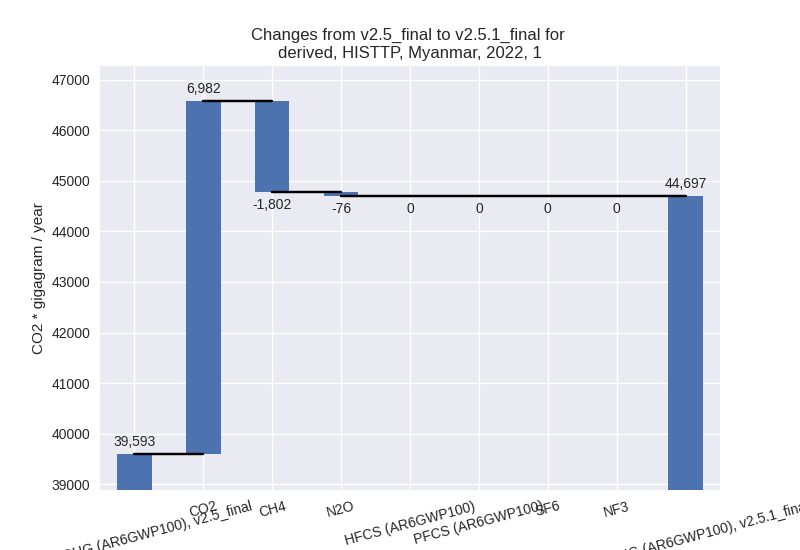
For each scenario and time frame the changes are displayed for all individual sectors and all individual gases. In the sector plot we use aggregate Kyoto GHGs in AR6GWP100. In the gas plot we usenational total emissions without LULUCF. ## country reported scenario
2022

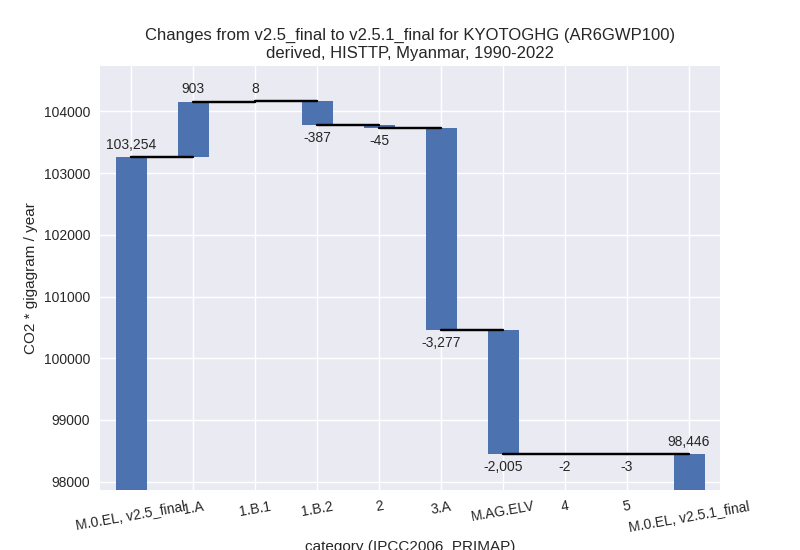
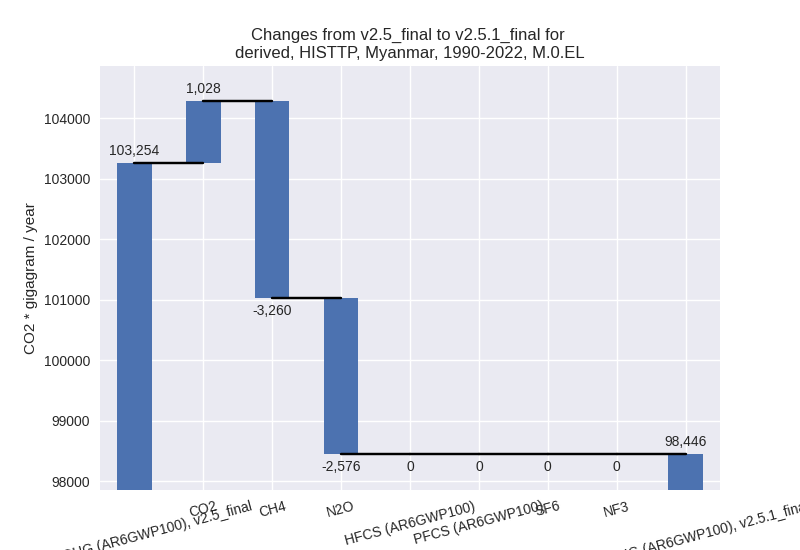
1990-2022

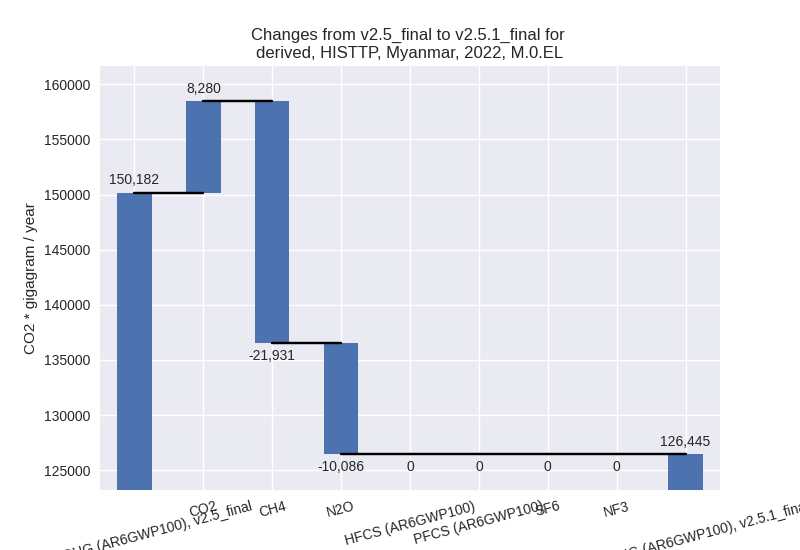
third party scenario
2022
1990-2022
Detailed changes for the scenarios:
country reported scenario (HISTCR):
Most important changes per time frame
For 2022 the following sector-gas combinations have the highest absolute impact on national total KyotoGHG (AR6GWP100) emissions in 2022 (top 5):
- 1: 3.A, CH4 with -12805.43 Gg CO2 / year (-46.8%)
- 2: 1.A, CO2 with 4949.31 Gg CO2 / year (26.8%)
- 3: M.AG.ELV, N2O with -1584.47 Gg CO2 / year (-33.0%)
- 4: M.AG.ELV, CO2 with 1357.53 Gg CO2 / year (400.8%)
- 5: M.AG.ELV, CH4 with 429.67 Gg CO2 / year (3.0%)
For 1990-2022 the following sector-gas combinations have the highest absolute impact on national total KyotoGHG (AR6GWP100) emissions in 1990-2022 (top 5):
- 1: 3.A, CH4 with -1778.96 Gg CO2 / year (-10.7%)
- 2: 1.A, CO2 with 609.88 Gg CO2 / year (6.5%)
- 3: M.AG.ELV, N2O with -195.45 Gg CO2 / year (-6.5%)
- 4: M.AG.ELV, CO2 with 169.45 Gg CO2 / year (101.2%)
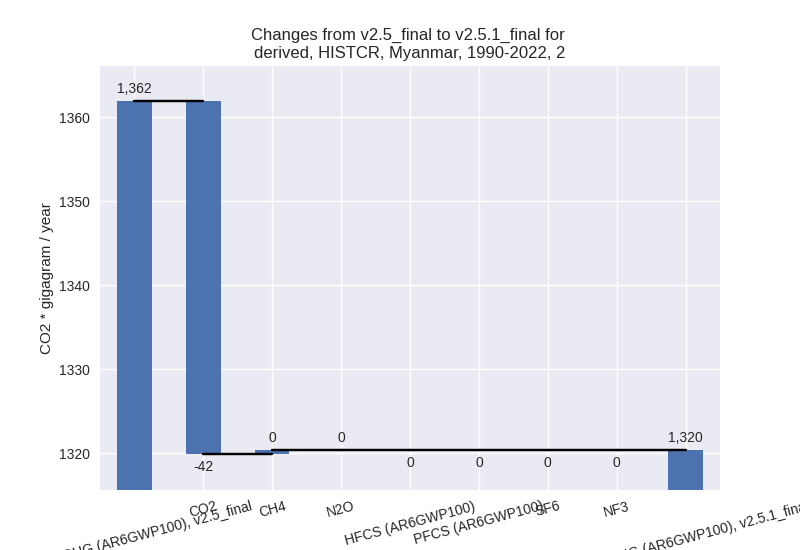
- 5: 2, CO2 with -42.03 Gg CO2 / year (-4.1%)
Changes in the main sectors for aggregate KyotoGHG (AR6GWP100) are
- 1: Total sectoral emissions in 2022 are 23884.42 Gg
CO2 / year which is 34.6% of M.0.EL emissions. 2022 Emissions have
changed by 25.6% (4873.57 Gg CO2 /
year). 1990-2022 Emissions have changed by 6.1% (603.91 Gg CO2 / year). For 2022 the
changes per gas
are:

For 1990-2022 the changes per gas are:
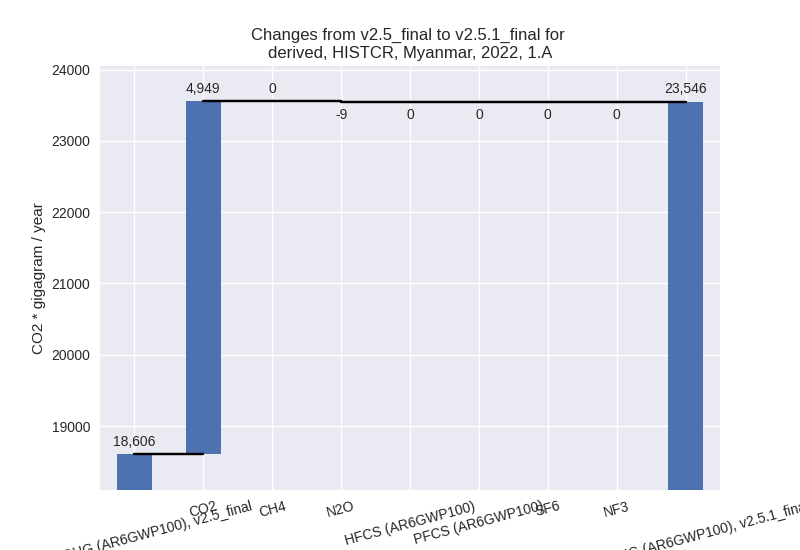
The changes come from the following subsectors:- 1.A: Total sectoral emissions in 2022 are 23546.33
Gg CO2 / year which is 98.6% of category 1 emissions. 2022 Emissions
have changed by 26.6% (4940.78 Gg
CO2 / year). 1990-2022 Emissions have changed by 6.4% (609.24 Gg CO2 / year). For 2022 the
changes per gas
are:
For 1990-2022 the changes per gas are: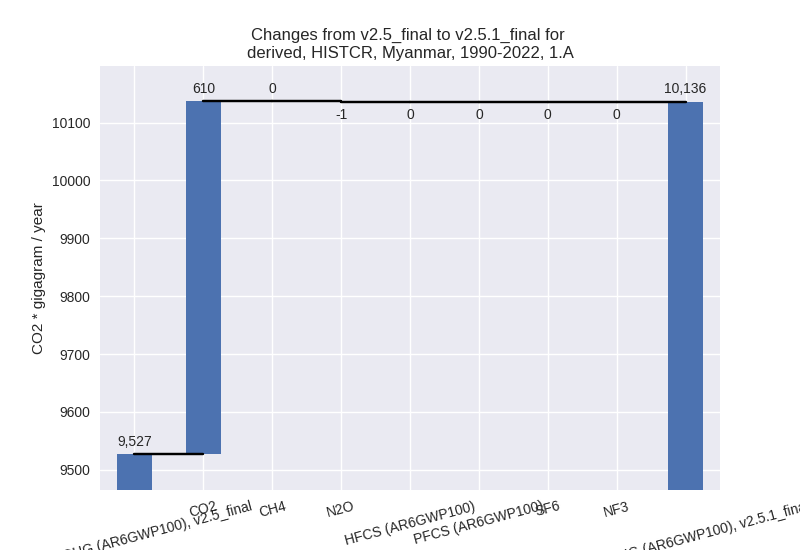
There is no subsector information available in PRIMAP-hist. - 1.B.1: Total sectoral emissions in 2022 are 39.96
Gg CO2 / year which is 0.2% of category 1 emissions. 2022 Emissions have
changed by -2.3% (-0.95 Gg CO2 /
year). 1990-2022 Emissions have changed by -3.1% (-0.93 Gg CO2 / year). For 2022 the
changes per gas
are:
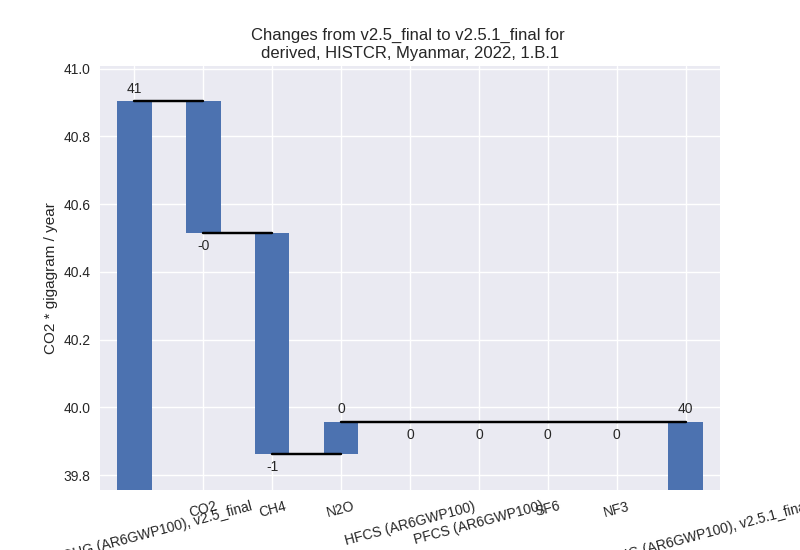
For 1990-2022 the changes per gas are:
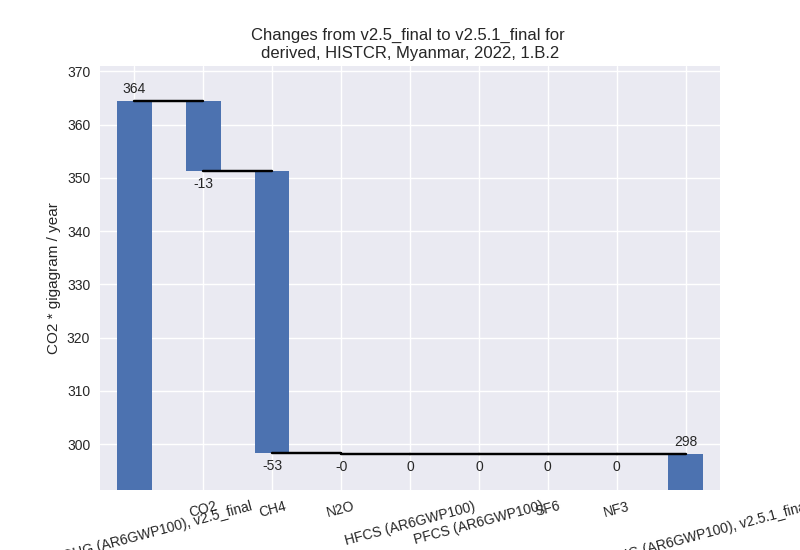
There is no subsector information available in PRIMAP-hist. - 1.B.2: Total sectoral emissions in 2022 are 298.13
Gg CO2 / year which is 1.2% of category 1 emissions. 2022 Emissions have
changed by -18.2% (-66.27 Gg CO2 /
year). 1990-2022 Emissions have changed by -1.1% (-4.40 Gg CO2 / year). For 2022 the
changes per gas
are:
There is no subsector information available in PRIMAP-hist.
- 1.A: Total sectoral emissions in 2022 are 23546.33
Gg CO2 / year which is 98.6% of category 1 emissions. 2022 Emissions
have changed by 26.6% (4940.78 Gg
CO2 / year). 1990-2022 Emissions have changed by 6.4% (609.24 Gg CO2 / year). For 2022 the
changes per gas
are:
- 2: Total sectoral emissions in 2022 are 4416.96 Gg
CO2 / year which is 6.4% of M.0.EL emissions. 2022 Emissions have
changed by -1.1% (-49.15 Gg CO2 /
year). 1990-2022 Emissions have changed by -3.0% (-41.53 Gg CO2 / year). For
1990-2022 the changes per gas
are:
- M.AG: Total sectoral emissions in 2022 are 34168.37
Gg CO2 / year which is 49.6% of M.0.EL emissions. 2022 Emissions have
changed by -27.0% (-12667.81 Gg CO2
/ year). 1990-2022 Emissions have changed by -5.2% (-1792.24 Gg CO2 / year). For 2022
the changes per gas
are:

For 1990-2022 the changes per gas are: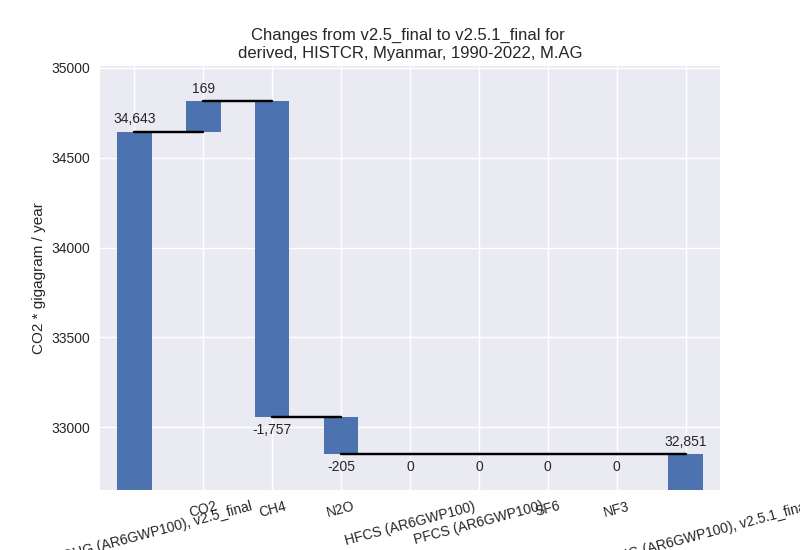
The changes come from the following subsectors:- 3.A: Total sectoral emissions in 2022 are 14628.26
Gg CO2 / year which is 42.8% of category M.AG emissions. 2022 Emissions
have changed by -46.8% (-12870.54 Gg
CO2 / year). 1990-2022 Emissions have changed by -10.7% (-1788.19 Gg CO2 / year). For 2022
the changes per gas
are:

For 1990-2022 the changes per gas are:
There is no subsector information available in PRIMAP-hist. - M.AG.ELV: Total sectoral emissions in 2022 are 19540.10 Gg CO2 / year which is 57.2% of category M.AG emissions. 2022 Emissions have changed by 1.0% (202.73 Gg CO2 / year). 1990-2022 Emissions have changed by -0.0% (-4.05 Gg CO2 / year).
- 3.A: Total sectoral emissions in 2022 are 14628.26
Gg CO2 / year which is 42.8% of category M.AG emissions. 2022 Emissions
have changed by -46.8% (-12870.54 Gg
CO2 / year). 1990-2022 Emissions have changed by -10.7% (-1788.19 Gg CO2 / year). For 2022
the changes per gas
are:
- 4: Total sectoral emissions in 2022 are 6199.25 Gg CO2 / year which is 9.0% of M.0.EL emissions. 2022 Emissions have changed by -0.6% (-35.72 Gg CO2 / year). 1990-2022 Emissions have changed by -0.0% (-1.08 Gg CO2 / year).
- 5: Total sectoral emissions in 2022 are 276.71 Gg
CO2 / year which is 0.4% of M.0.EL emissions. 2022 Emissions have
changed by -29.0% (-113.24 Gg CO2 /
year). 1990-2022 Emissions have changed by -1.2% (-3.43 Gg CO2 / year). For 2022 the
changes per gas
are:
third party scenario (HISTTP):
Most important changes per time frame
For 2022 the following sector-gas combinations have the highest absolute impact on national total KyotoGHG (AR6GWP100) emissions in 2022 (top 5):
- 1: 3.A, CH4 with -20909.60 Gg CO2 / year (-46.8%)
- 2: M.AG.ELV, N2O with -7258.33 Gg CO2 / year (-42.5%)
- 3: 1.A, CO2 with 6995.52 Gg CO2 / year (26.7%)
- 4: 3.A, N2O with -2623.01 Gg CO2 / year (-54.3%)
- 5: 1.B.2, CH4 with -1852.81 Gg CO2 / year (-23.5%)
For 1990-2022 the following sector-gas combinations have the highest absolute impact on national total KyotoGHG (AR6GWP100) emissions in 1990-2022 (top 5):
- 1: 3.A, CH4 with -2904.81 Gg CO2 / year (-10.6%)
- 2: M.AG.ELV, N2O with -2195.10 Gg CO2 / year (-19.8%)
- 3: 1.A, CO2 with 904.57 Gg CO2 / year (7.0%)
- 4: 1.B.2, CH4 with -386.45 Gg CO2 / year (-9.4%)
- 5: 3.A, N2O with -371.94 Gg CO2 / year (-12.2%)
Changes in the main sectors for aggregate KyotoGHG (AR6GWP100) are
- 1: Total sectoral emissions in 2022 are 44696.98 Gg
CO2 / year which is 35.3% of M.0.EL emissions. 2022 Emissions have
changed by 12.9% (5104.43 Gg CO2 /
year). 1990-2022 Emissions have changed by 2.4% (523.37 Gg CO2 / year). For 2022 the
changes per gas
are:
For 1990-2022 the changes per gas are: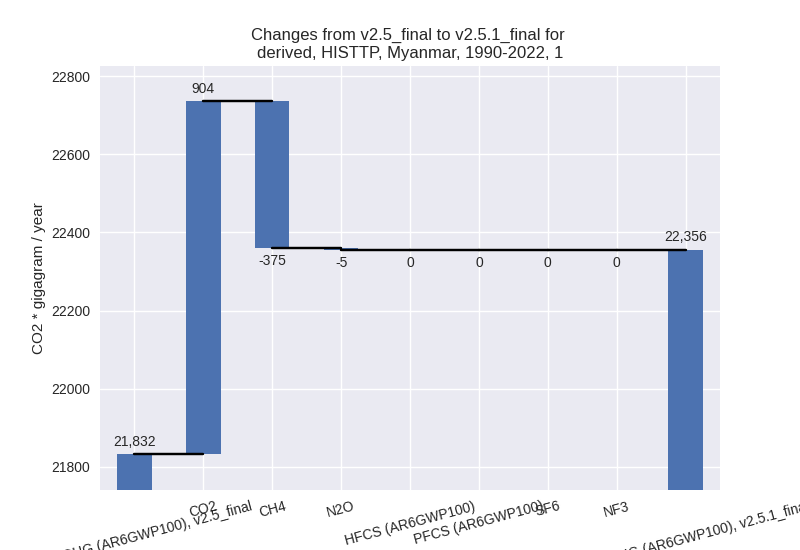
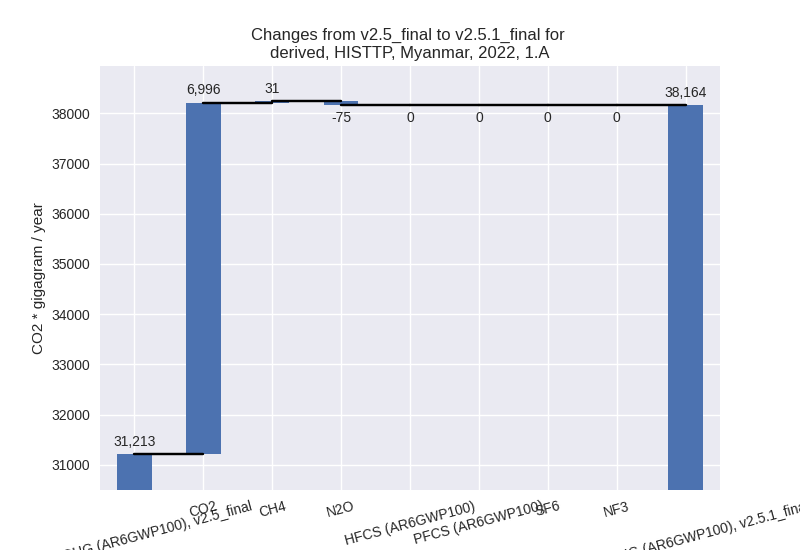
The changes come from the following subsectors:- 1.A: Total sectoral emissions in 2022 are 38163.75
Gg CO2 / year which is 85.4% of category 1 emissions. 2022 Emissions
have changed by 22.3% (6950.86 Gg
CO2 / year). 1990-2022 Emissions have changed by 5.3% (902.59 Gg CO2 / year). For 2022 the
changes per gas
are:
For 1990-2022 the changes per gas are: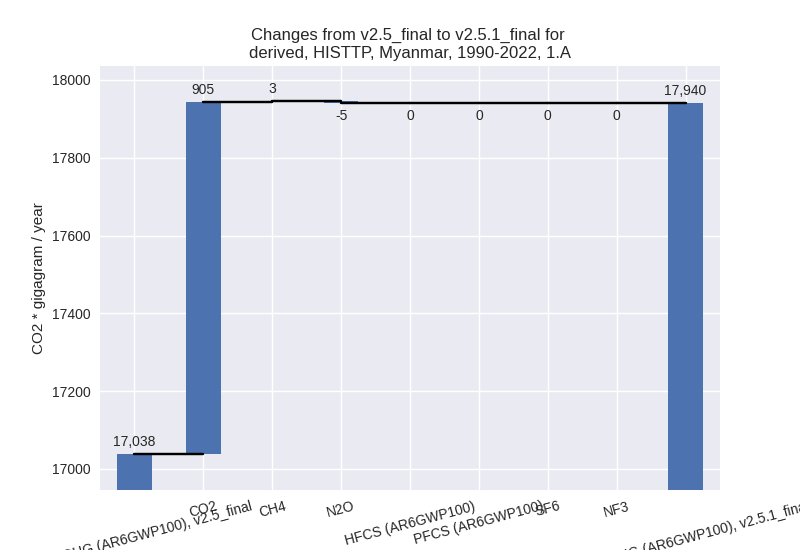
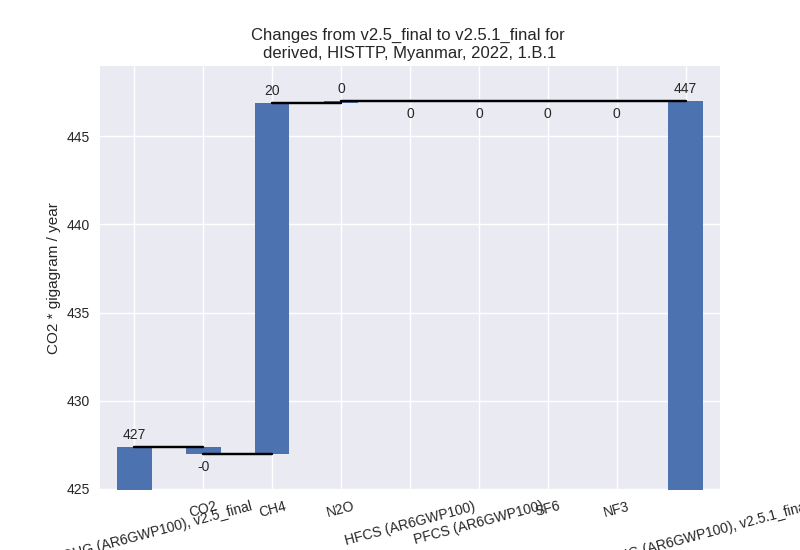
There is no subsector information available in PRIMAP-hist. - 1.B.1: Total sectoral emissions in 2022 are 446.98
Gg CO2 / year which is 1.0% of category 1 emissions. 2022 Emissions have
changed by 4.6% (19.62 Gg CO2 /
year). 1990-2022 Emissions have changed by 1.7% (7.62 Gg CO2 / year). For 2022 the
changes per gas
are:
There is no subsector information available in PRIMAP-hist. - 1.B.2: Total sectoral emissions in 2022 are 6086.25
Gg CO2 / year which is 13.6% of category 1 emissions. 2022 Emissions
have changed by -23.5% (-1866.05 Gg
CO2 / year). 1990-2022 Emissions have changed by -8.9% (-386.85 Gg CO2 / year). For 2022
the changes per gas
are:

For 1990-2022 the changes per gas are: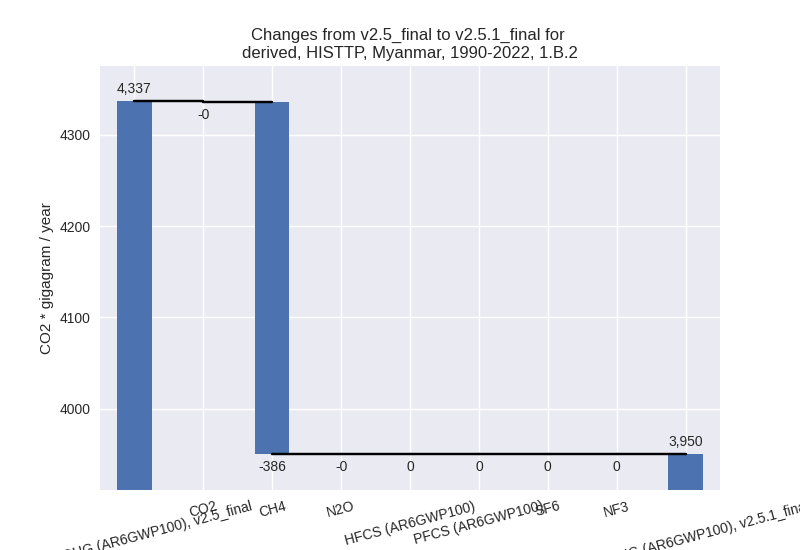
There is no subsector information available in PRIMAP-hist.
- 1.A: Total sectoral emissions in 2022 are 38163.75
Gg CO2 / year which is 85.4% of category 1 emissions. 2022 Emissions
have changed by 22.3% (6950.86 Gg
CO2 / year). 1990-2022 Emissions have changed by 5.3% (902.59 Gg CO2 / year). For 2022 the
changes per gas
are:
- 2: Total sectoral emissions in 2022 are 3488.77 Gg
CO2 / year which is 2.8% of M.0.EL emissions. 2022 Emissions have
changed by -1.7% (-59.75 Gg CO2 /
year). 1990-2022 Emissions have changed by -4.0% (-45.21 Gg CO2 / year). For
1990-2022 the changes per gas
are:

- M.AG: Total sectoral emissions in 2022 are 66826.01
Gg CO2 / year which is 52.8% of M.0.EL emissions. 2022 Emissions have
changed by -30.0% (-28613.41 Gg CO2
/ year). 1990-2022 Emissions have changed by -7.4% (-5281.87 Gg CO2 / year). For 2022
the changes per gas
are:
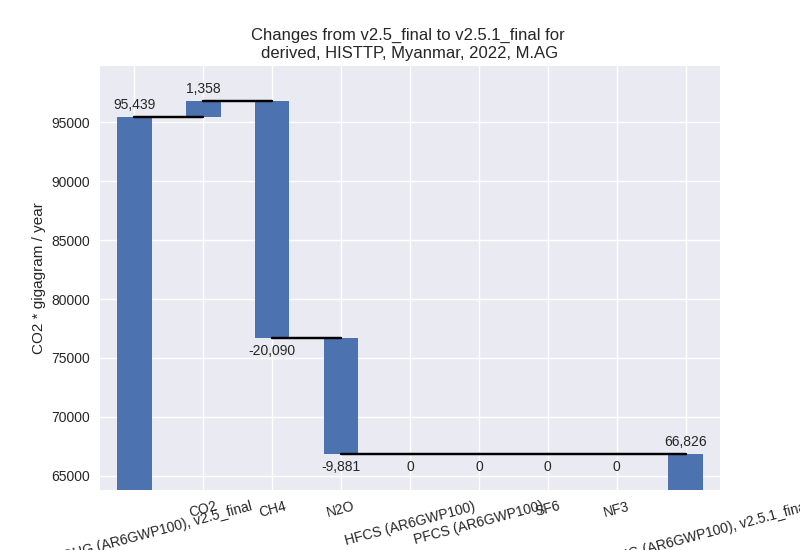
For 1990-2022 the changes per gas are: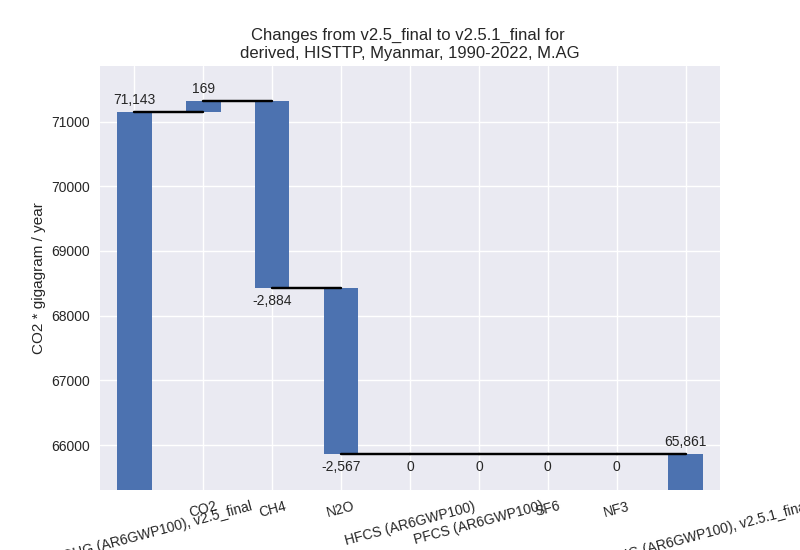
The changes come from the following subsectors:- 3.A: Total sectoral emissions in 2022 are 26003.50
Gg CO2 / year which is 38.9% of category M.AG emissions. 2022 Emissions
have changed by -47.5% (-23532.61 Gg
CO2 / year). 1990-2022 Emissions have changed by -10.8% (-3276.75 Gg CO2 / year). For 2022
the changes per gas
are:
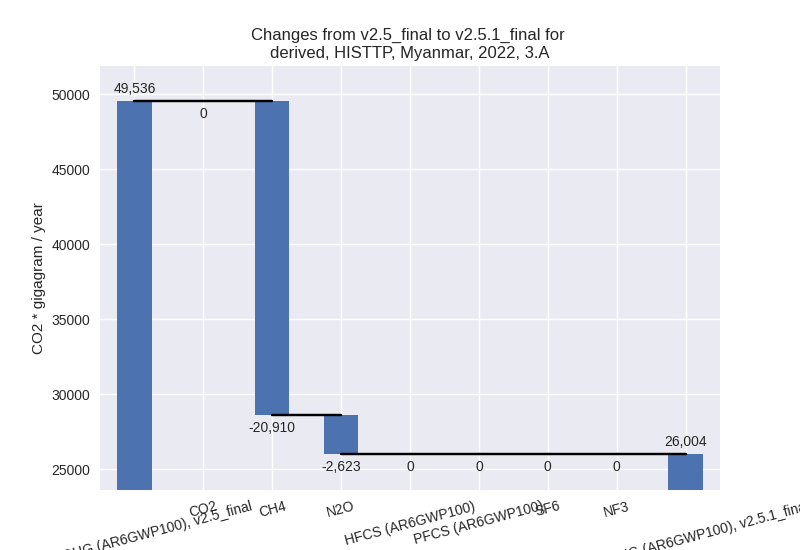
For 1990-2022 the changes per gas are:
There is no subsector information available in PRIMAP-hist. - M.AG.ELV: Total sectoral emissions in 2022 are
40822.51 Gg CO2 / year which is 61.1% of category M.AG emissions. 2022
Emissions have changed by -11.1%
(-5080.81 Gg CO2 / year). 1990-2022 Emissions have changed by -4.9% (-2005.12 Gg CO2 / year). For 2022
the changes per gas
are:

For 1990-2022 the changes per gas are:
There is no subsector information available in PRIMAP-hist.
- 3.A: Total sectoral emissions in 2022 are 26003.50
Gg CO2 / year which is 38.9% of category M.AG emissions. 2022 Emissions
have changed by -47.5% (-23532.61 Gg
CO2 / year). 1990-2022 Emissions have changed by -10.8% (-3276.75 Gg CO2 / year). For 2022
the changes per gas
are:
- 4: Total sectoral emissions in 2022 are 11156.81 Gg CO2 / year which is 8.8% of M.0.EL emissions. 2022 Emissions have changed by -0.5% (-55.23 Gg CO2 / year). 1990-2022 Emissions have changed by -0.0% (-1.67 Gg CO2 / year).
- 5: Total sectoral emissions in 2022 are 276.71 Gg
CO2 / year which is 0.2% of M.0.EL emissions. 2022 Emissions have
changed by -29.0% (-113.24 Gg CO2 /
year). 1990-2022 Emissions have changed by -1.2% (-3.43 Gg CO2 / year). For 2022 the
changes per gas
are:
