Changes in PRIMAP-hist v2.5.1_final compared to v2.5_final for Montenegro
2024-02-29
Johannes Gütschow
Change analysis for Montenegro for PRIMAP-hist v2.5.1_final compared to v2.5_final
Overview over emissions by sector and gas
The following figures show the aggregate national total emissions excluding LULUCF AR6GWP100 for the country reported priority scenario. The dotted linesshow the v2.5_final data.
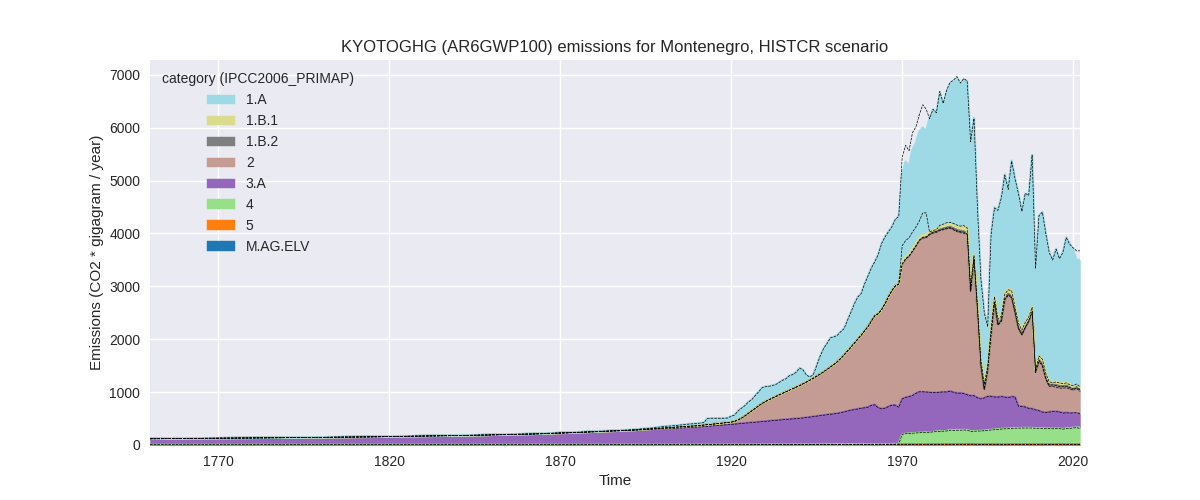
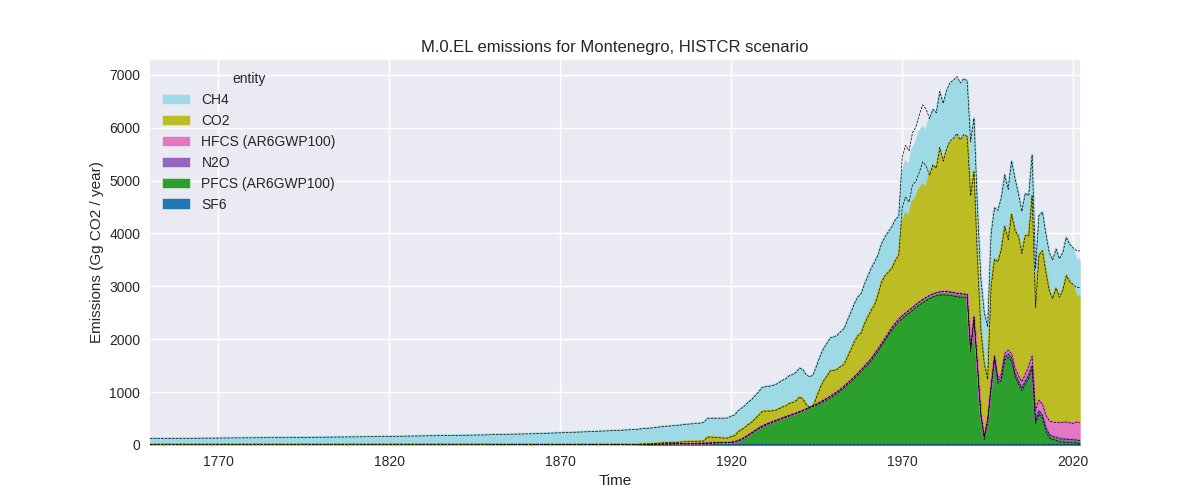
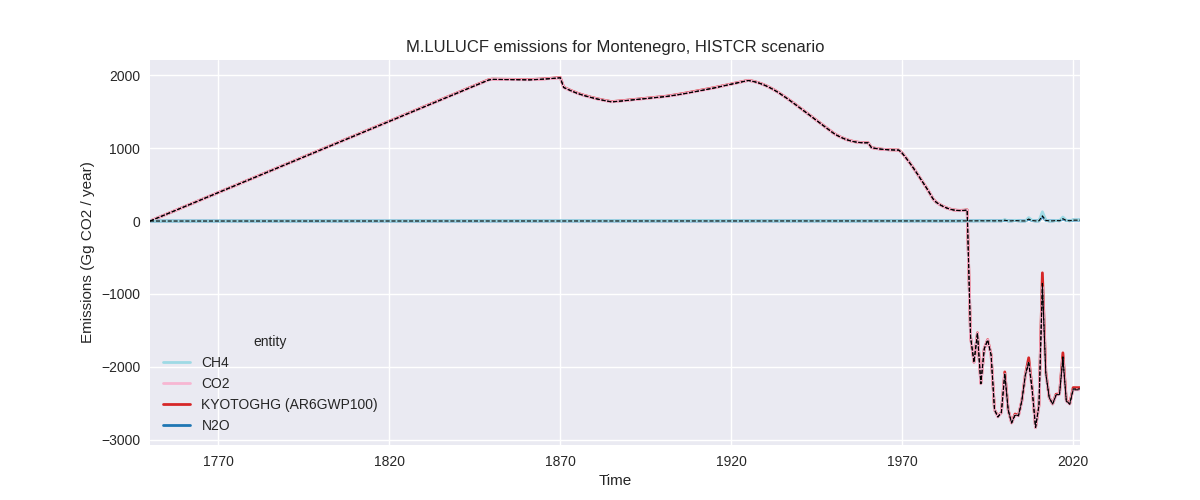
The following figures show the aggregate national total emissions excluding LULUCF AR6GWP100 for the third party priority scenario. The dotted linesshow the v2.5_final data.


Overview over changes
In the country reported priority scenario we have the following changes for aggregate Kyoto GHG and national total emissions excluding LULUCF (M.0.EL):
- Emissions in 2022 have changed by -4.5%% (-166.87 Gg CO2 / year)
- Emissions in 1990-2022 have changed by -0.2%% (-6.54 Gg CO2 / year)
In the third party priority scenario we have the following changes for aggregate Kyoto GHG and national total emissions excluding LULUCF (M.0.EL):
- Emissions in 2022 have changed by 4.1%% (139.16 Gg CO2 / year)
- Emissions in 1990-2022 have changed by -3.0%% (-99.87 Gg CO2 / year)
Most important changes per scenario and time frame
In the country reported priority scenario the following sector-gas combinations have the highest absolute impact on national total KyotoGHG (AR6GWP100) emissions in 2022 (top 5):
- 1: 1.A, CO2 with -174.86 Gg CO2 / year (-7.0%)
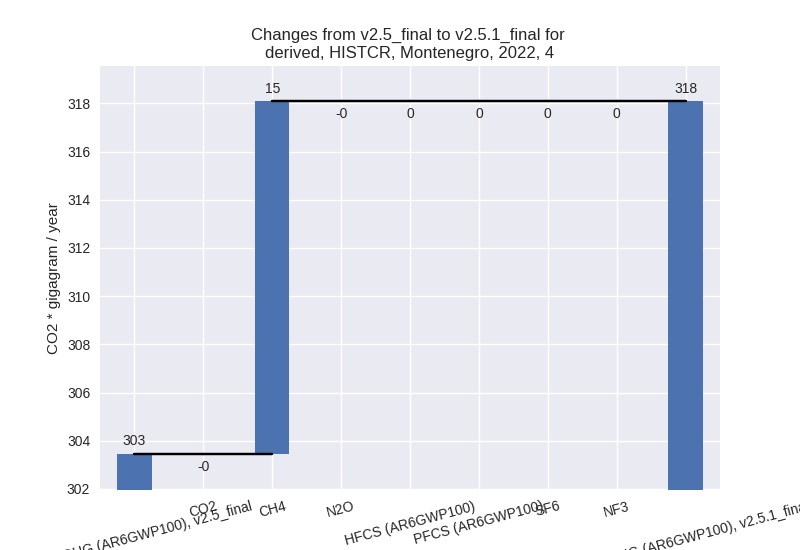
- 2: 4, CH4 with 14.64 Gg CO2 / year (5.0%)
- 3: 3.A, CH4 with -13.02 Gg CO2 / year (-4.9%)
- 4: 1.B.1, CH4 with -9.70 Gg CO2 / year (-16.8%)
- 5: 2, CO2 with 8.78 Gg CO2 / year (16.0%)
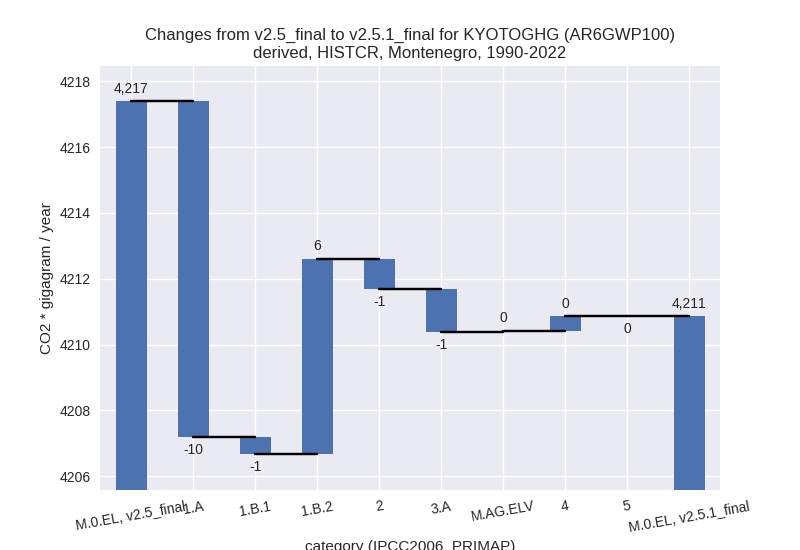
In the country reported priority scenario the following sector-gas combinations have the highest absolute impact on national total KyotoGHG (AR6GWP100) emissions in 1990-2022 (top 5):
- 1: 1.A, CO2 with -11.53 Gg CO2 / year (-0.5%)
- 2: 1.B.2, CH4 with 5.94 Gg CO2 / year (27.2%)
- 3: 3.A, CH4 with -1.26 Gg CO2 / year (-0.3%)
- 4: 1.A, CH4 with 1.09 Gg CO2 / year (2.0%)
- 5: 2, CO2 with -0.92 Gg CO2 / year (-0.7%)
In the third party priority scenario the following sector-gas combinations have the highest absolute impact on national total KyotoGHG (AR6GWP100) emissions in 2022 (top 5):
- 1: 2, CO2 with 64.99 Gg CO2 / year (63.4%)
- 2: 1.A, CO2 with 60.49 Gg CO2 / year (2.8%)
- 3: M.AG.ELV, CO2 with 30.73 Gg CO2 / year (223.6%)
- 4: 4, CH4 with -19.18 Gg CO2 / year (-4.7%)
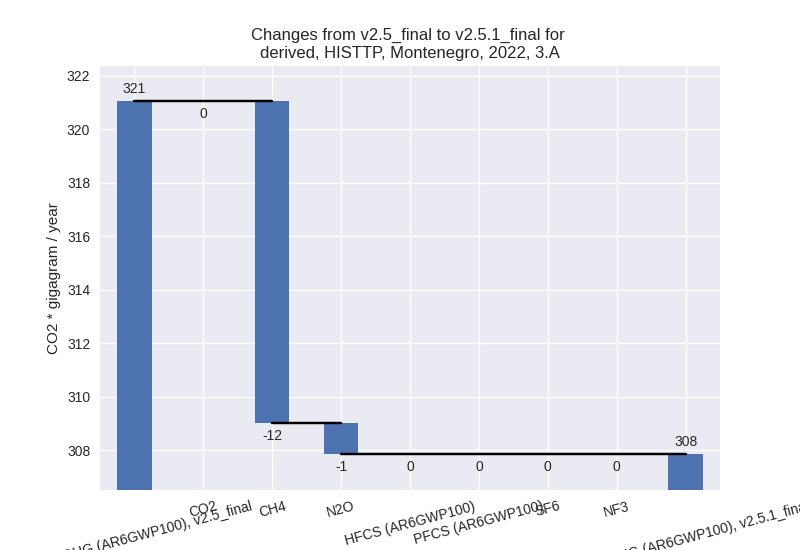
- 5: 3.A, CH4 with -12.04 Gg CO2 / year (-4.0%)
In the third party priority scenario the following sector-gas combinations have the highest absolute impact on national total KyotoGHG (AR6GWP100) emissions in 1990-2022 (top 5):
- 1: 1.A, CO2 with -122.05 Gg CO2 / year (-6.1%)
- 2: M.AG.ELV, CO2 with 8.27 Gg CO2 / year (86.3%)
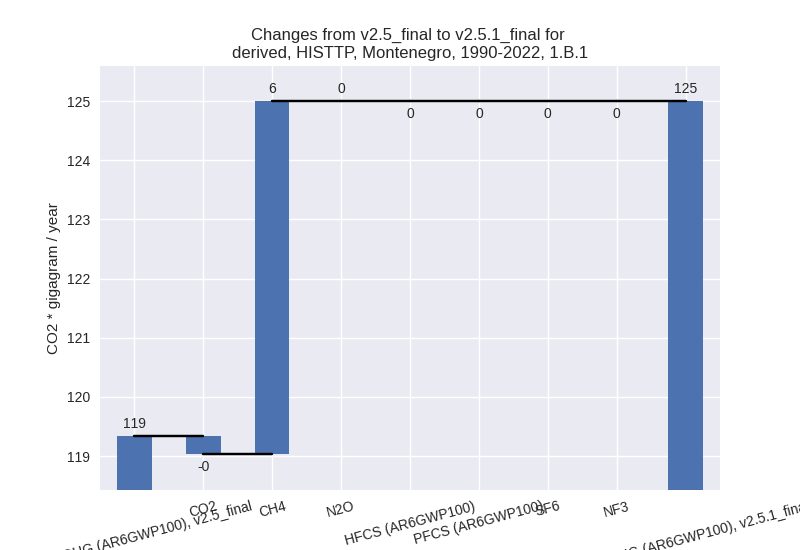
- 3: 1.B.1, CH4 with 5.96 Gg CO2 / year (6.8%)
- 4: 1.B.2, CH4 with 5.94 Gg CO2 / year (27.2%)
- 5: 2, CO2 with 4.71 Gg CO2 / year (3.0%)
Notes on data changes
Here we list notes explaining important emissions changes for the country. ’' means that the following text only applies to the TP time series, while means that it only applies to the CR scenario. Otherwise the note applies to both scenarios.
- 1.A, CO2: Updated CDIAC data is lower before 2006 leading to lower pre-2006 emissions in PRIMAP-hist.
- 2.D, CO2: Emissions in 2.D (non-energy products from fuels and solvent use) are much lower in EDGAR 8.0 than in EDGAR 7.0 and thus emissions in PRIMAP-hist v2.5.1 are lower than in v2.5.
Changes by sector and gas
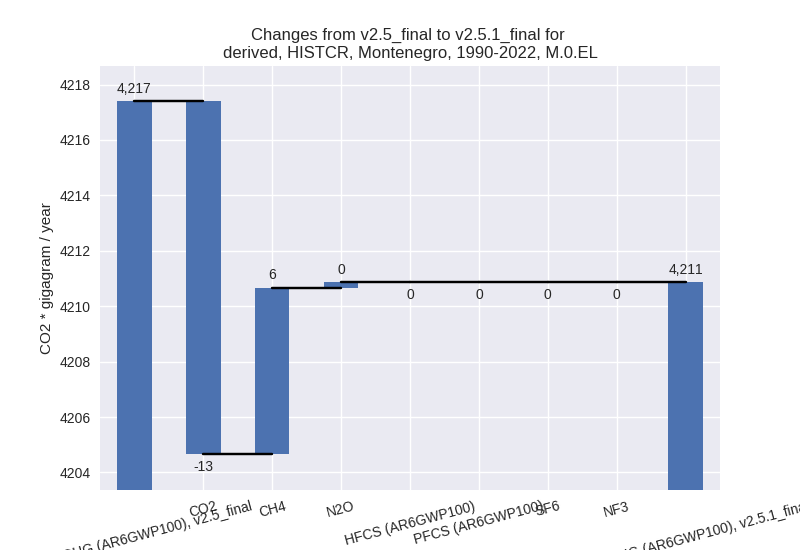
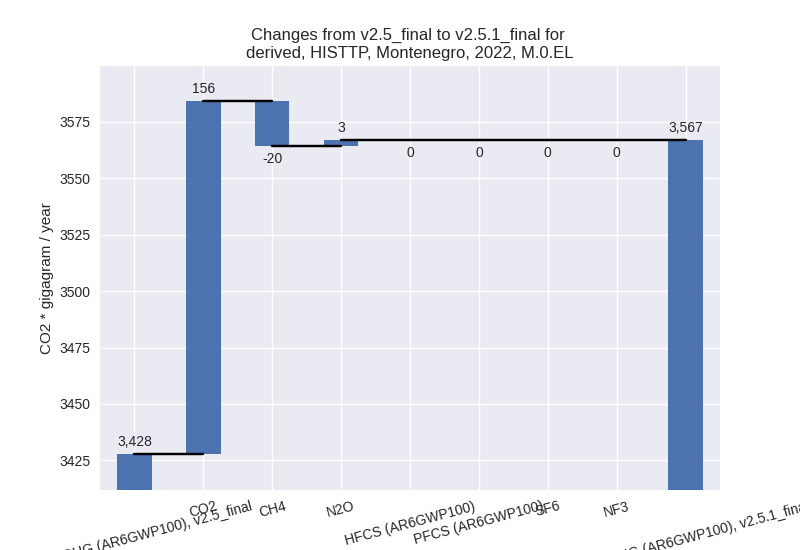
For each scenario and time frame the changes are displayed for all individual sectors and all individual gases. In the sector plot we use aggregate Kyoto GHGs in AR6GWP100. In the gas plot we usenational total emissions without LULUCF. ## country reported scenario
2022


1990-2022
third party scenario
2022
1990-2022


Detailed changes for the scenarios:
country reported scenario (HISTCR):
Most important changes per time frame
For 2022 the following sector-gas combinations have the highest absolute impact on national total KyotoGHG (AR6GWP100) emissions in 2022 (top 5):
- 1: 1.A, CO2 with -174.86 Gg CO2 / year (-7.0%)
- 2: 4, CH4 with 14.64 Gg CO2 / year (5.0%)
- 3: 3.A, CH4 with -13.02 Gg CO2 / year (-4.9%)
- 4: 1.B.1, CH4 with -9.70 Gg CO2 / year (-16.8%)
- 5: 2, CO2 with 8.78 Gg CO2 / year (16.0%)
For 1990-2022 the following sector-gas combinations have the highest absolute impact on national total KyotoGHG (AR6GWP100) emissions in 1990-2022 (top 5):
- 1: 1.A, CO2 with -11.53 Gg CO2 / year (-0.5%)
- 2: 1.B.2, CH4 with 5.94 Gg CO2 / year (27.2%)
- 3: 3.A, CH4 with -1.26 Gg CO2 / year (-0.3%)
- 4: 1.A, CH4 with 1.09 Gg CO2 / year (2.0%)
- 5: 2, CO2 with -0.92 Gg CO2 / year (-0.7%)
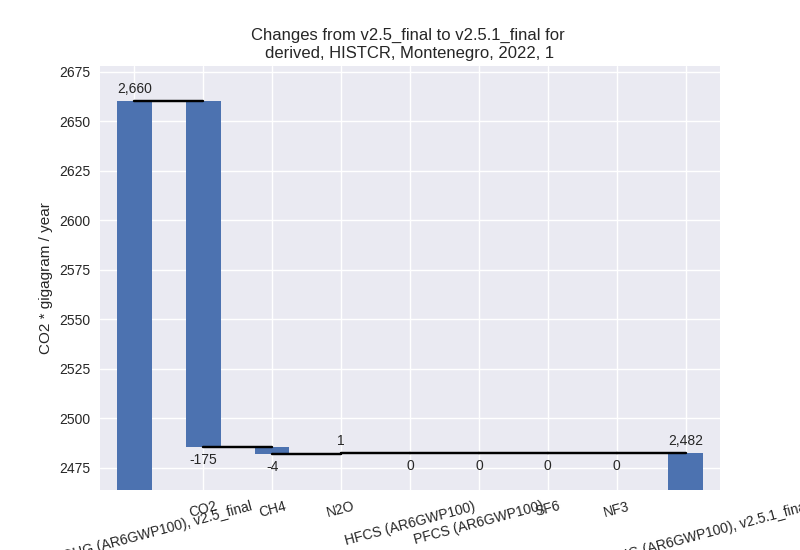
Changes in the main sectors for aggregate KyotoGHG (AR6GWP100) are
- 1: Total sectoral emissions in 2022 are 2482.46 Gg
CO2 / year which is 70.8% of M.0.EL emissions. 2022 Emissions have
changed by -6.7% (-177.67 Gg CO2 /
year). 1990-2022 Emissions have changed by -0.2% (-4.79 Gg CO2 / year). For 2022 the
changes per gas
are:
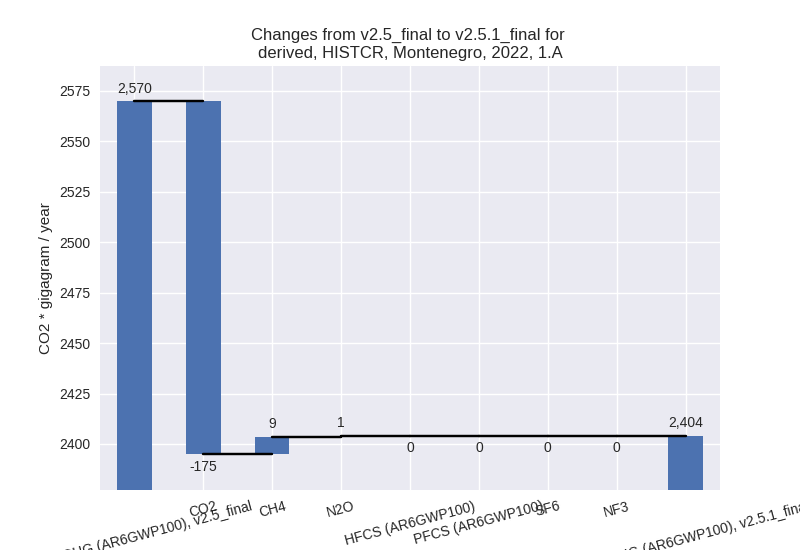
The changes come from the following subsectors:- 1.A: Total sectoral emissions in 2022 are 2404.19
Gg CO2 / year which is 96.8% of category 1 emissions. 2022 Emissions
have changed by -6.4% (-165.59 Gg
CO2 / year). 1990-2022 Emissions have changed by -0.4% (-10.20 Gg CO2 / year). For 2022 the
changes per gas
are:
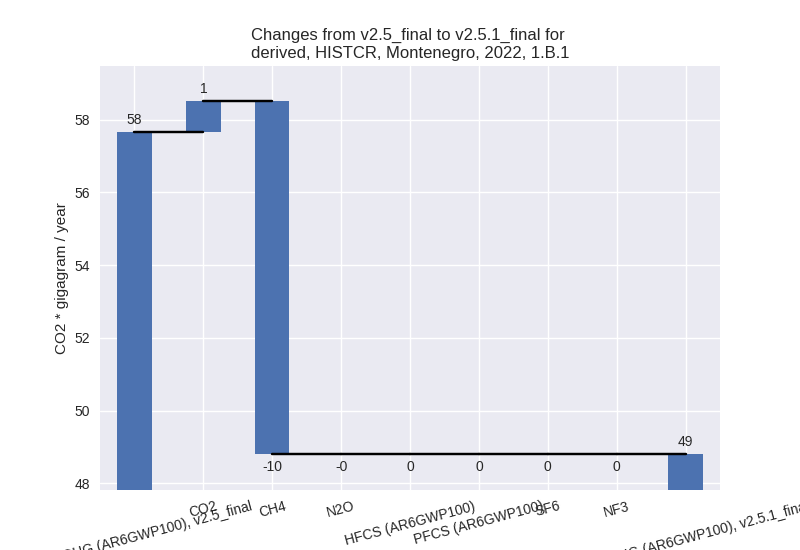
There is no subsector information available in PRIMAP-hist. - 1.B.1: Total sectoral emissions in 2022 are 48.80
Gg CO2 / year which is 2.0% of category 1 emissions. 2022 Emissions have
changed by -15.3% (-8.85 Gg CO2 /
year). 1990-2022 Emissions have changed by -0.7% (-0.53 Gg CO2 / year). For 2022 the
changes per gas
are:
There is no subsector information available in PRIMAP-hist. - 1.B.2: Total sectoral emissions in 2022 are 29.47
Gg CO2 / year which is 1.2% of category 1 emissions. 2022 Emissions have
changed by -9.9% (-3.23 Gg CO2 /
year). 1990-2022 Emissions have changed by 26.1% (5.95 Gg CO2 / year). For 2022 the
changes per gas
are:
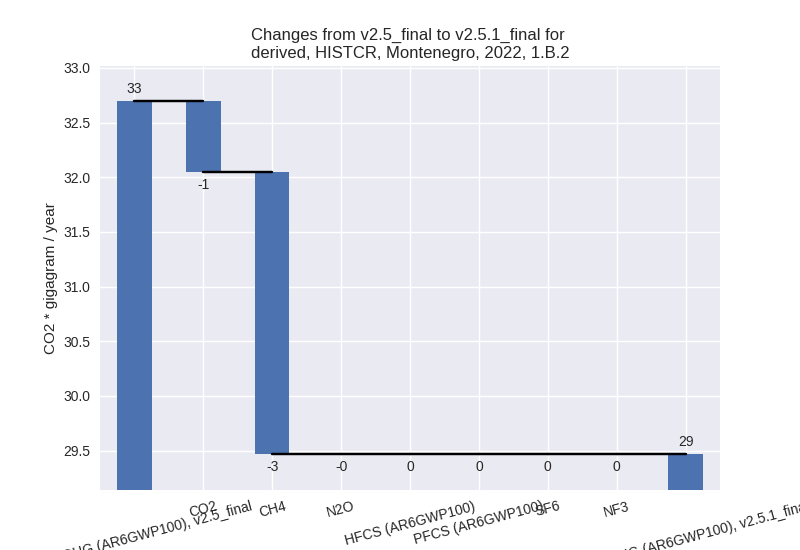
For 1990-2022 the changes per gas are: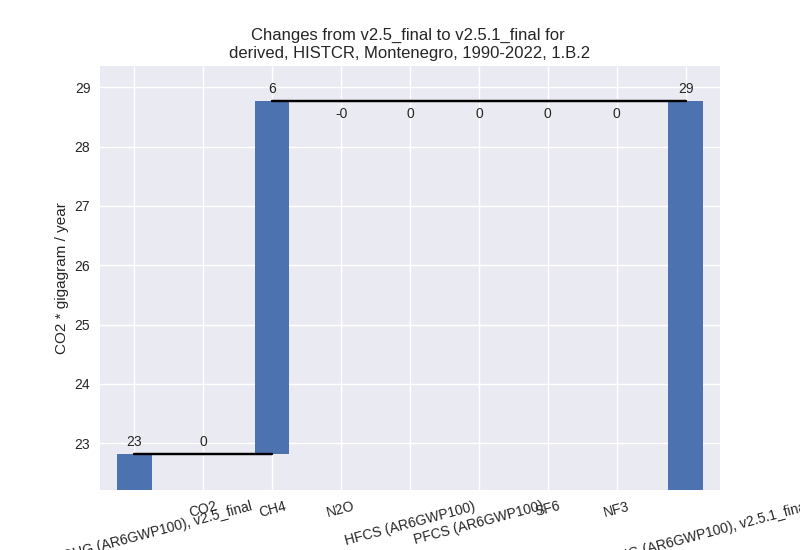
There is no subsector information available in PRIMAP-hist.
- 1.A: Total sectoral emissions in 2022 are 2404.19
Gg CO2 / year which is 96.8% of category 1 emissions. 2022 Emissions
have changed by -6.4% (-165.59 Gg
CO2 / year). 1990-2022 Emissions have changed by -0.4% (-10.20 Gg CO2 / year). For 2022 the
changes per gas
are:
- 2: Total sectoral emissions in 2022 are 431.04 Gg
CO2 / year which is 12.3% of M.0.EL emissions. 2022 Emissions have
changed by 2.0% (8.64 Gg CO2 /
year). 1990-2022 Emissions have changed by -0.1% (-0.93 Gg CO2 / year). For 2022 the
changes per gas
are:

- M.AG: Total sectoral emissions in 2022 are 272.71
Gg CO2 / year which is 7.8% of M.0.EL emissions. 2022 Emissions have
changed by -4.4% (-12.45 Gg CO2 /
year). 1990-2022 Emissions have changed by -0.3% (-1.27 Gg CO2 / year). For 2022 the
changes per gas
are:

The changes come from the following subsectors:- 3.A: Total sectoral emissions in 2022 are 261.21 Gg
CO2 / year which is 95.8% of category M.AG emissions. 2022 Emissions
have changed by -5.0% (-13.77 Gg CO2
/ year). 1990-2022 Emissions have changed by -0.3% (-1.32 Gg CO2 / year). For 2022 the
changes per gas
are:

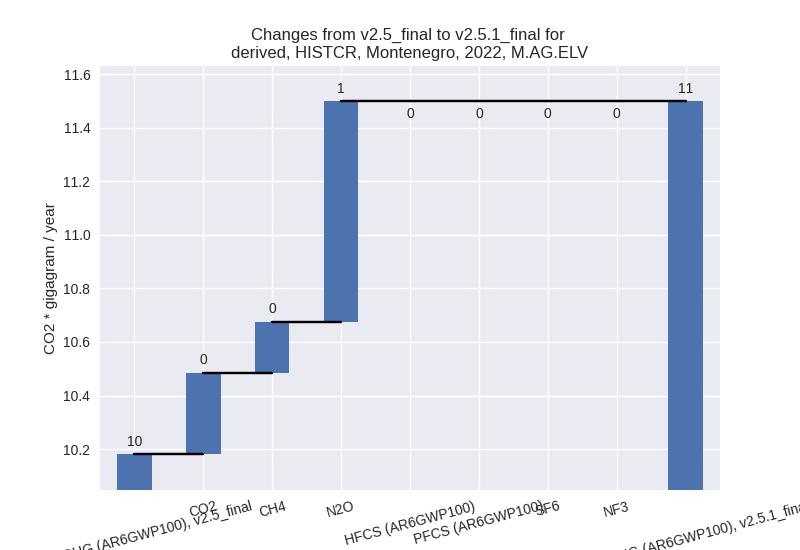
There is no subsector information available in PRIMAP-hist. - M.AG.ELV: Total sectoral emissions in 2022 are
11.50 Gg CO2 / year which is 4.2% of category M.AG emissions. 2022
Emissions have changed by 12.9%
(1.32 Gg CO2 / year). 1990-2022 Emissions have changed by 0.5% (0.05 Gg CO2 / year). For 2022 the
changes per gas
are:
There is no subsector information available in PRIMAP-hist.
- 3.A: Total sectoral emissions in 2022 are 261.21 Gg
CO2 / year which is 95.8% of category M.AG emissions. 2022 Emissions
have changed by -5.0% (-13.77 Gg CO2
/ year). 1990-2022 Emissions have changed by -0.3% (-1.32 Gg CO2 / year). For 2022 the
changes per gas
are:
- 4: Total sectoral emissions in 2022 are 318.08 Gg
CO2 / year which is 9.1% of M.0.EL emissions. 2022 Emissions have
changed by 4.8% (14.62 Gg CO2 /
year). 1990-2022 Emissions have changed by 0.2% (0.44 Gg CO2 / year). For 2022 the
changes per gas
are:
- 5: No data
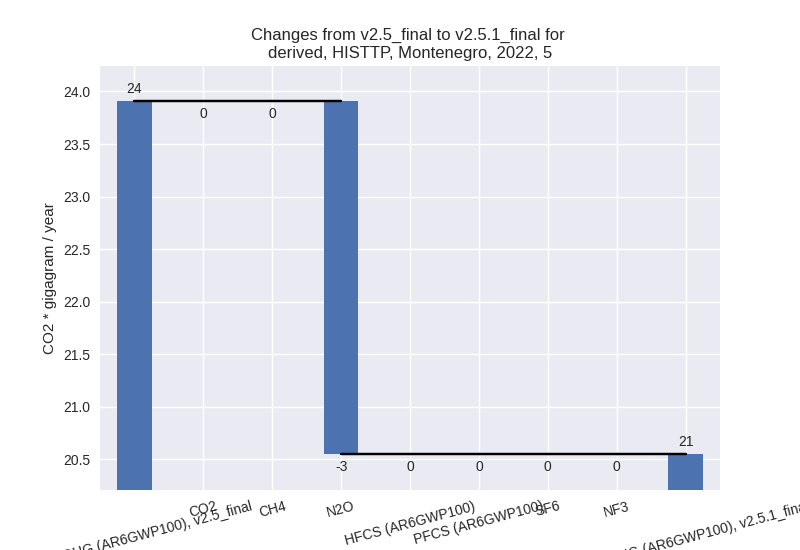
third party scenario (HISTTP):
Most important changes per time frame
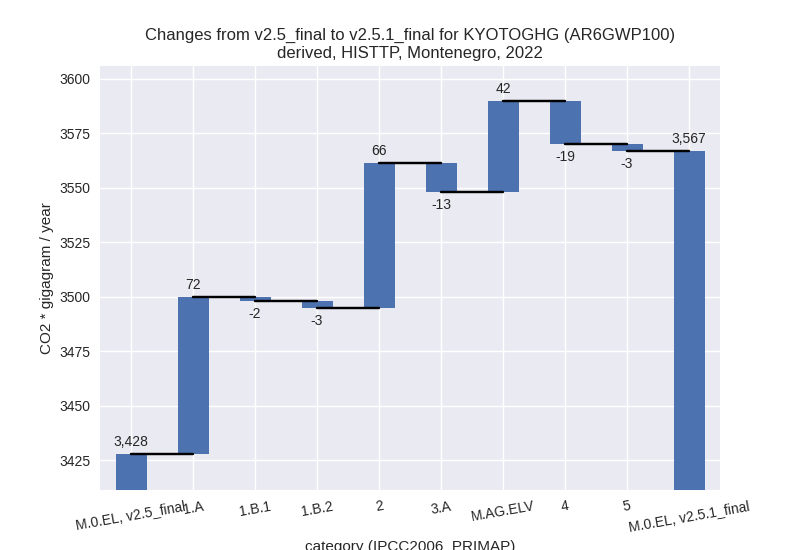
For 2022 the following sector-gas combinations have the highest absolute impact on national total KyotoGHG (AR6GWP100) emissions in 2022 (top 5):
- 1: 2, CO2 with 64.99 Gg CO2 / year (63.4%)
- 2: 1.A, CO2 with 60.49 Gg CO2 / year (2.8%)
- 3: M.AG.ELV, CO2 with 30.73 Gg CO2 / year (223.6%)
- 4: 4, CH4 with -19.18 Gg CO2 / year (-4.7%)
- 5: 3.A, CH4 with -12.04 Gg CO2 / year (-4.0%)
For 1990-2022 the following sector-gas combinations have the highest absolute impact on national total KyotoGHG (AR6GWP100) emissions in 1990-2022 (top 5):
- 1: 1.A, CO2 with -122.05 Gg CO2 / year (-6.1%)
- 2: M.AG.ELV, CO2 with 8.27 Gg CO2 / year (86.3%)
- 3: 1.B.1, CH4 with 5.96 Gg CO2 / year (6.8%)
- 4: 1.B.2, CH4 with 5.94 Gg CO2 / year (27.2%)
- 5: 2, CO2 with 4.71 Gg CO2 / year (3.0%)
Changes in the main sectors for aggregate KyotoGHG (AR6GWP100) are
- 1: Total sectoral emissions in 2022 are 2450.99 Gg
CO2 / year which is 68.7% of M.0.EL emissions. 2022 Emissions have
changed by 2.8% (67.15 Gg CO2 /
year). 1990-2022 Emissions have changed by -4.9% (-106.54 Gg CO2 / year). For 2022
the changes per gas
are:

For 1990-2022 the changes per gas are: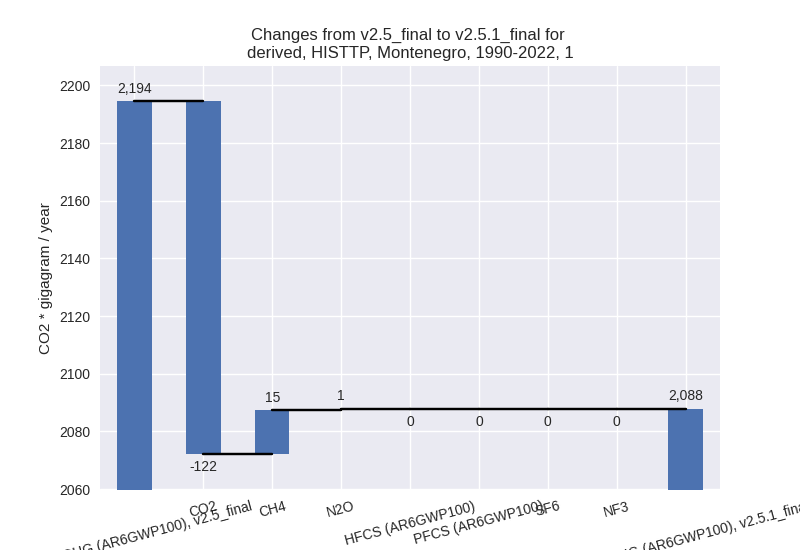
The changes come from the following subsectors:- 1.A: Total sectoral emissions in 2022 are 2329.22
Gg CO2 / year which is 95.0% of category 1 emissions. 2022 Emissions
have changed by 3.2% (71.93 Gg CO2 /
year). 1990-2022 Emissions have changed by -5.8% (-118.14 Gg CO2 / year). For 2022
the changes per gas
are:

For 1990-2022 the changes per gas are: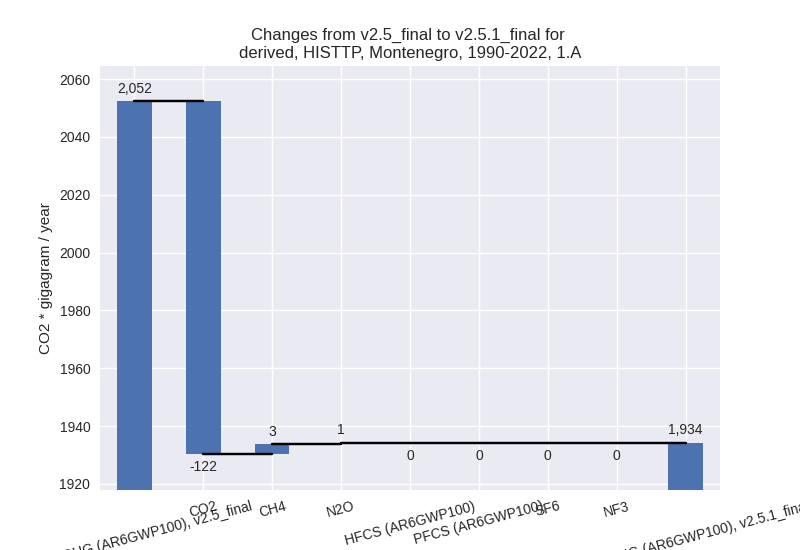
There is no subsector information available in PRIMAP-hist. - 1.B.1: Total sectoral emissions in 2022 are 92.30
Gg CO2 / year which is 3.8% of category 1 emissions. 2022 Emissions have
changed by -1.6% (-1.55 Gg CO2 /
year). 1990-2022 Emissions have changed by 4.7% (5.66 Gg CO2 / year). For 1990-2022
the changes per gas
are:
There is no subsector information available in PRIMAP-hist. - 1.B.2: Total sectoral emissions in 2022 are 29.47
Gg CO2 / year which is 1.2% of category 1 emissions. 2022 Emissions have
changed by -9.9% (-3.23 Gg CO2 /
year). 1990-2022 Emissions have changed by 26.1% (5.95 Gg CO2 / year). For 2022 the
changes per gas
are:

For 1990-2022 the changes per gas are:
There is no subsector information available in PRIMAP-hist.
- 1.A: Total sectoral emissions in 2022 are 2329.22
Gg CO2 / year which is 95.0% of category 1 emissions. 2022 Emissions
have changed by 3.2% (71.93 Gg CO2 /
year). 1990-2022 Emissions have changed by -5.8% (-118.14 Gg CO2 / year). For 2022
the changes per gas
are:
- 2: Total sectoral emissions in 2022 are 232.67 Gg
CO2 / year which is 6.5% of M.0.EL emissions. 2022 Emissions have
changed by 39.9% (66.41 Gg CO2 /
year). 1990-2022 Emissions have changed by 2.0% (4.85 Gg CO2 / year). For 2022 the
changes per gas
are:
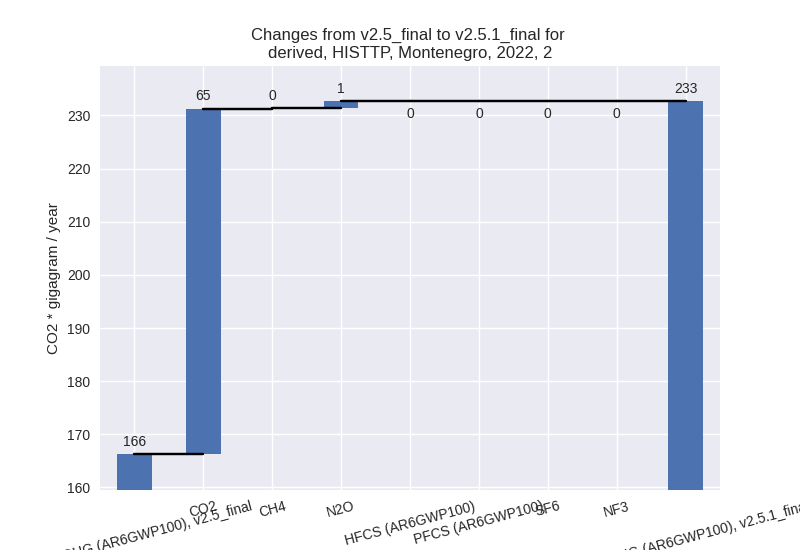
For 1990-2022 the changes per gas are:
- M.AG: Total sectoral emissions in 2022 are 438.65
Gg CO2 / year which is 12.3% of M.0.EL emissions. 2022 Emissions have
changed by 6.9% (28.40 Gg CO2 /
year). 1990-2022 Emissions have changed by 0.4% (2.51 Gg CO2 / year). For 2022 the
changes per gas
are:

The changes come from the following subsectors:- 3.A: Total sectoral emissions in 2022 are 307.84 Gg
CO2 / year which is 70.2% of category M.AG emissions. 2022 Emissions
have changed by -4.1% (-13.20 Gg CO2
/ year). 1990-2022 Emissions have changed by -0.3% (-1.36 Gg CO2 / year). For 2022 the
changes per gas
are:
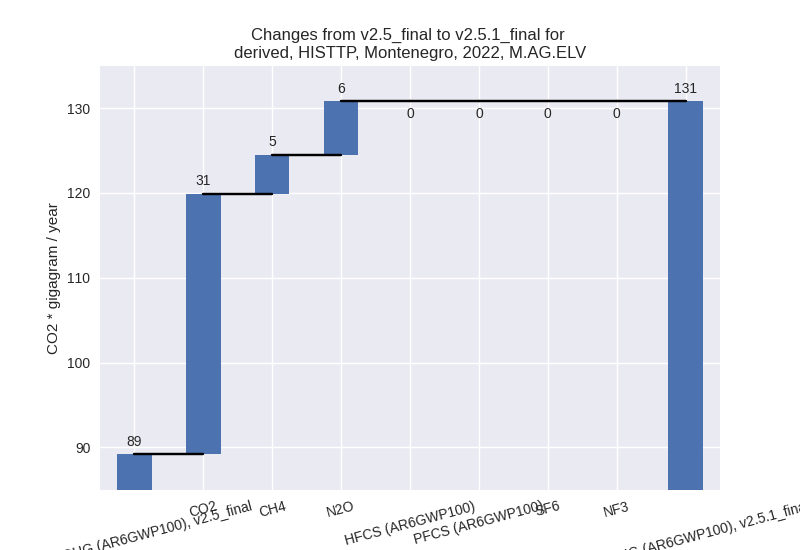
There is no subsector information available in PRIMAP-hist. - M.AG.ELV: Total sectoral emissions in 2022 are
130.81 Gg CO2 / year which is 29.8% of category M.AG emissions. 2022
Emissions have changed by 46.6%
(41.60 Gg CO2 / year). 1990-2022 Emissions have changed by 4.1% (3.87 Gg CO2 / year). For 2022 the
changes per gas
are:
For 1990-2022 the changes per gas are: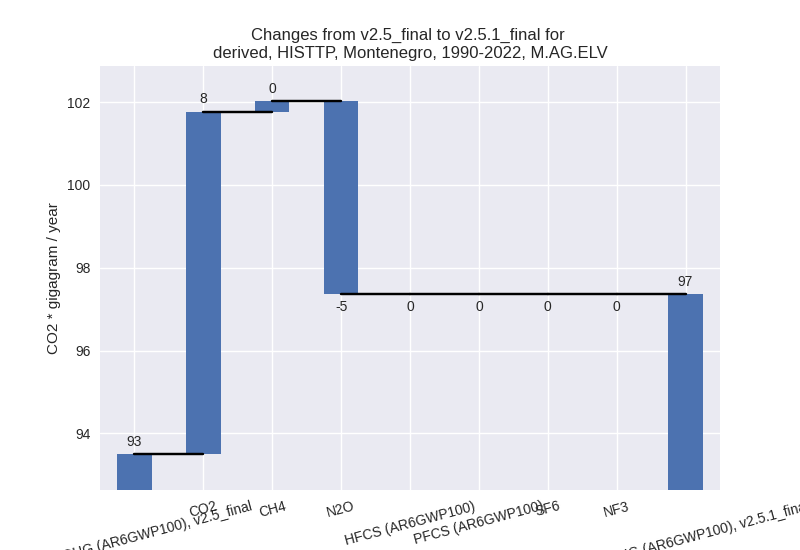
There is no subsector information available in PRIMAP-hist.
- 3.A: Total sectoral emissions in 2022 are 307.84 Gg
CO2 / year which is 70.2% of category M.AG emissions. 2022 Emissions
have changed by -4.1% (-13.20 Gg CO2
/ year). 1990-2022 Emissions have changed by -0.3% (-1.36 Gg CO2 / year). For 2022 the
changes per gas
are:
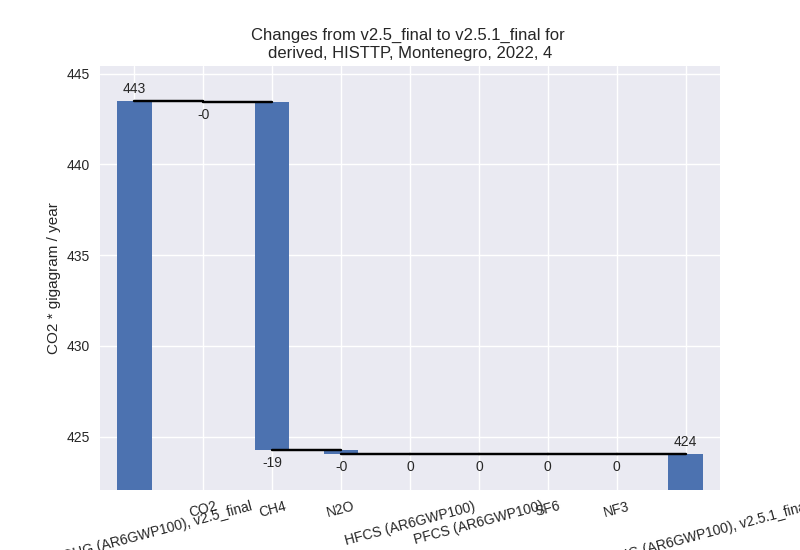
- 4: Total sectoral emissions in 2022 are 424.02 Gg
CO2 / year which is 11.9% of M.0.EL emissions. 2022 Emissions have
changed by -4.4% (-19.45 Gg CO2 /
year). 1990-2022 Emissions have changed by -0.2% (-0.59 Gg CO2 / year). For 2022 the
changes per gas
are:
- 5: Total sectoral emissions in 2022 are 20.55 Gg
CO2 / year which is 0.6% of M.0.EL emissions. 2022 Emissions have
changed by -14.0% (-3.36 Gg CO2 /
year). 1990-2022 Emissions have changed by -0.5% (-0.10 Gg CO2 / year). For 2022 the
changes per gas
are: