Changes in PRIMAP-hist v2.5.1_final compared to v2.5_final for Mongolia
2024-02-29
Johannes Gütschow
Change analysis for Mongolia for PRIMAP-hist v2.5.1_final compared to v2.5_final
Overview over emissions by sector and gas
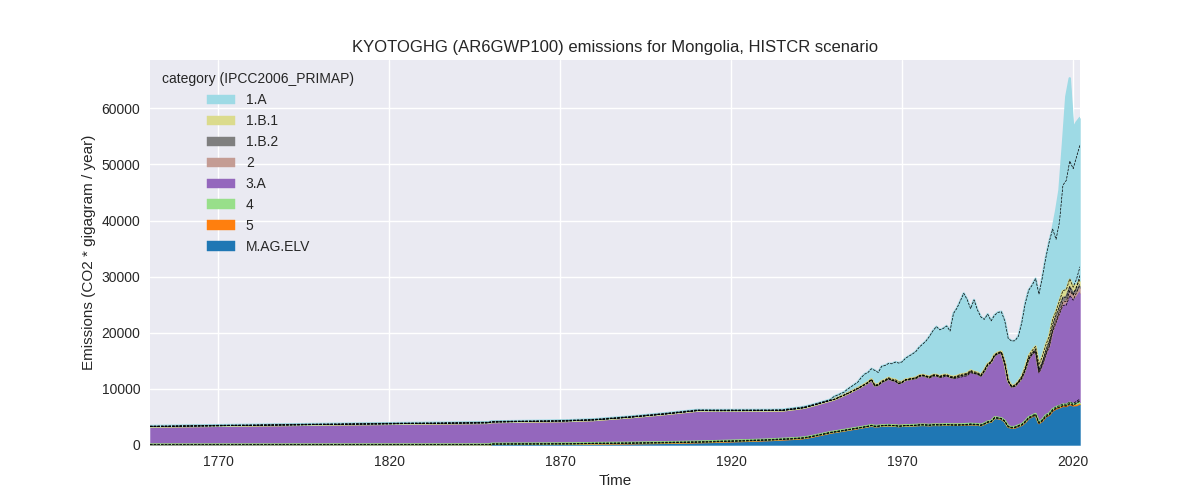
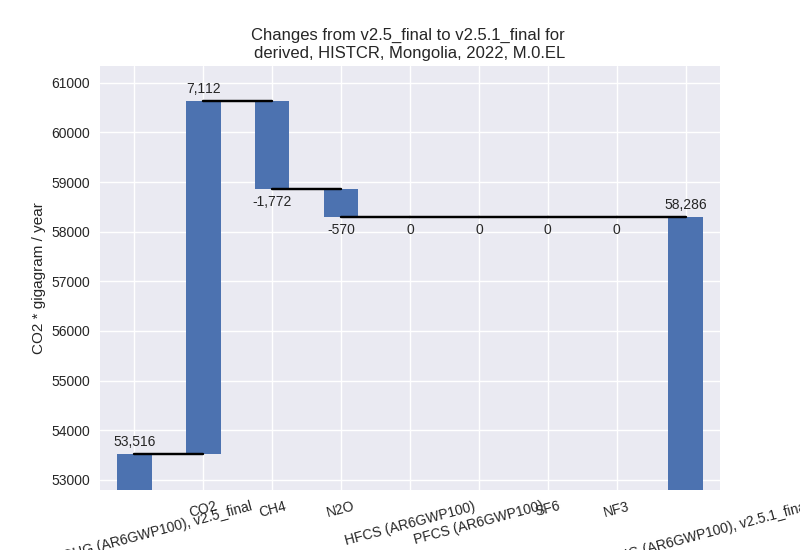
The following figures show the aggregate national total emissions excluding LULUCF AR6GWP100 for the country reported priority scenario. The dotted linesshow the v2.5_final data.


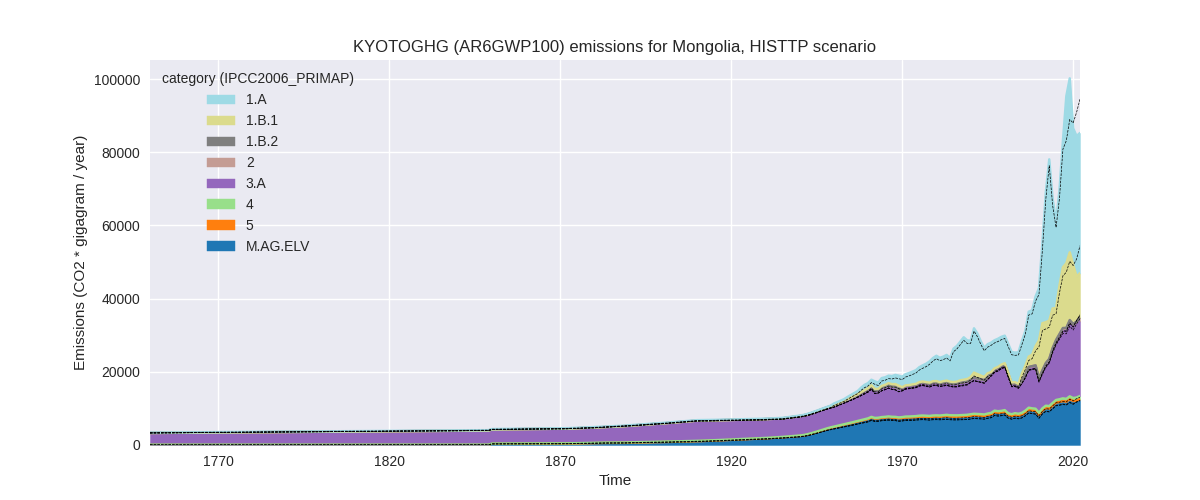
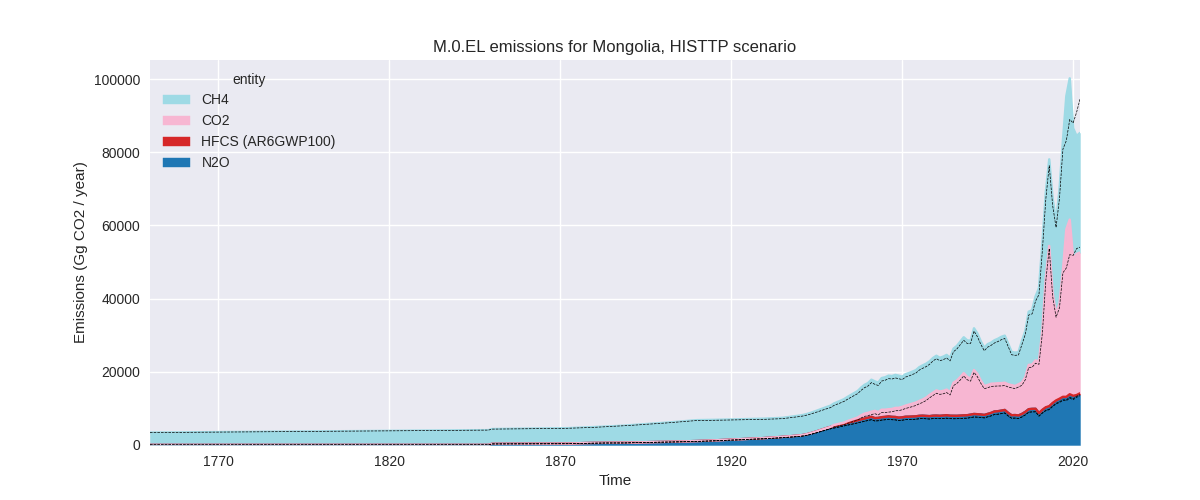
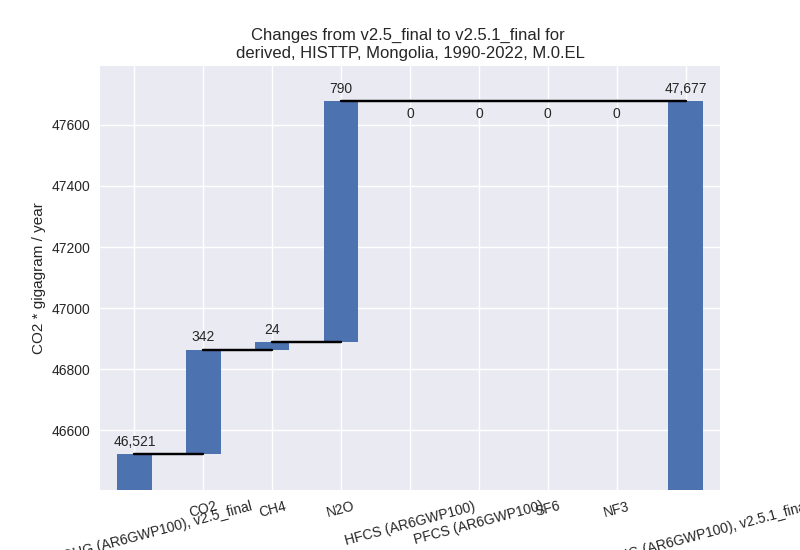
The following figures show the aggregate national total emissions excluding LULUCF AR6GWP100 for the third party priority scenario. The dotted linesshow the v2.5_final data.
Overview over changes
In the country reported priority scenario we have the following changes for aggregate Kyoto GHG and national total emissions excluding LULUCF (M.0.EL):
- Emissions in 2022 have changed by 8.9%% (4770.72 Gg CO2 / year)
- Emissions in 1990-2022 have changed by 6.5%% (1983.85 Gg CO2 / year)
In the third party priority scenario we have the following changes for aggregate Kyoto GHG and national total emissions excluding LULUCF (M.0.EL):
- Emissions in 2022 have changed by -9.8%% (-9215.66 Gg CO2 / year)
- Emissions in 1990-2022 have changed by 2.5%% (1156.01 Gg CO2 / year)
Most important changes per scenario and time frame
In the country reported priority scenario the following sector-gas combinations have the highest absolute impact on national total KyotoGHG (AR6GWP100) emissions in 2022 (top 5):
- 1: 1.A, CO2 with 7312.76 Gg CO2 / year (34.8%)
- 2: 3.A, CH4 with -897.60 Gg CO2 / year (-4.6%)
- 3: M.AG.ELV, N2O with -565.78 Gg CO2 / year (-7.2%)
- 4: 1.B.1, CH4 with -420.89 Gg CO2 / year (-40.6%)
- 5: 1.B.2, CH4 with -349.18 Gg CO2 / year (-50.6%)
In the country reported priority scenario the following sector-gas combinations have the highest absolute impact on national total KyotoGHG (AR6GWP100) emissions in 1990-2022 (top 5):
- 1: 1.A, CO2 with 2111.66 Gg CO2 / year (17.4%)
- 2: 3.A, CH4 with -49.83 Gg CO2 / year (-0.4%)
- 3: M.AG.ELV, N2O with -43.99 Gg CO2 / year (-0.9%)
- 4: 1.B.1, CH4 with -26.60 Gg CO2 / year (-6.7%)
- 5: 1.B.2, CH4 with 13.44 Gg CO2 / year (5.1%)
In the third party priority scenario the following sector-gas combinations have the highest absolute impact on national total KyotoGHG (AR6GWP100) emissions in 2022 (top 5):
- 1: 1.B.1, CH4 with -6607.36 Gg CO2 / year (-35.9%)
- 2: 1.A, CO2 with -1636.66 Gg CO2 / year (-4.2%)
- 3: 3.A, CH4 with -940.81 Gg CO2 / year (-4.6%)
- 4: M.AG.ELV, N2O with 375.03 Gg CO2 / year (3.1%)
- 5: 1.B.1, CO2 with -196.21 Gg CO2 / year (-42.7%)
In the third party priority scenario the following sector-gas combinations have the highest absolute impact on national total KyotoGHG (AR6GWP100) emissions in 1990-2022 (top 5):
- 1: M.AG.ELV, N2O with 789.86 Gg CO2 / year (9.4%)
- 2: 1.A, CO2 with 364.74 Gg CO2 / year (2.0%)
- 3: 1.B.1, CH4 with 83.69 Gg CO2 / year (1.5%)
- 4: 3.A, CH4 with -52.39 Gg CO2 / year (-0.4%)
- 5: 1.B.1, CO2 with -12.41 Gg CO2 / year (-7.8%)
Notes on data changes
Here we list notes explaining important emissions changes for the country. ’' means that the following text only applies to the TP time series, while means that it only applies to the CR scenario. Otherwise the note applies to both scenarios.
- 1.A, CO2: Emissions in CDIAC have very high fluctuations which impact the harmonization of data sources. This leads to changed emissions also for years where CDAIC 2023 data equals CDIAC 2020 data. High fluctuation CDIAC data replaces data based on EI growth rates which have less fluctuations.
- 3.A, CH4: New FAO data shows increasing emissions for 2021 after decreasing emissions for 2020 this leads to higher 2022 emissions.
- 1.B.1, CH4: EDGAR 8.0 shows a steep emissions decrease for the last years.
Changes by sector and gas
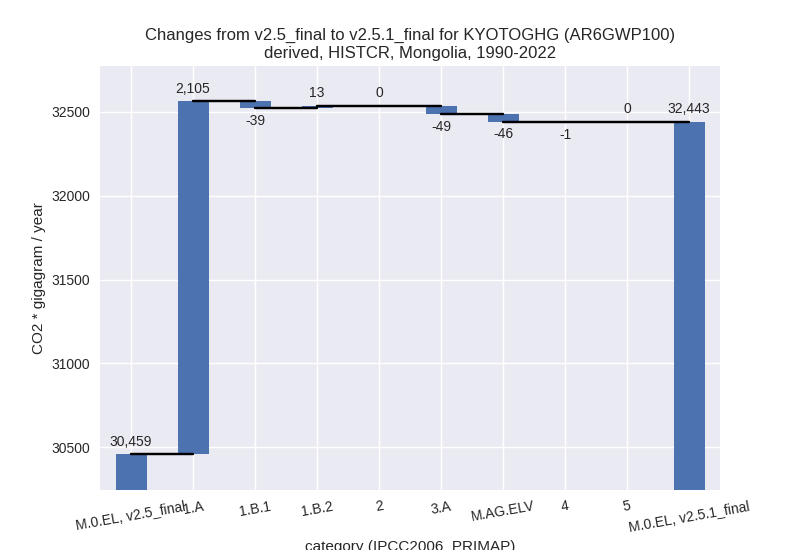
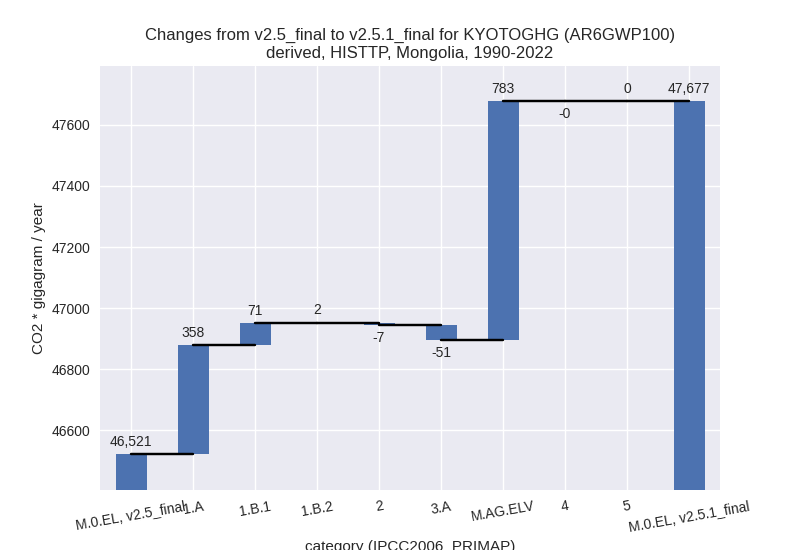
For each scenario and time frame the changes are displayed for all individual sectors and all individual gases. In the sector plot we use aggregate Kyoto GHGs in AR6GWP100. In the gas plot we usenational total emissions without LULUCF. ## country reported scenario
2022

1990-2022

third party scenario
2022


1990-2022
Detailed changes for the scenarios:
country reported scenario (HISTCR):
Most important changes per time frame
For 2022 the following sector-gas combinations have the highest absolute impact on national total KyotoGHG (AR6GWP100) emissions in 2022 (top 5):
- 1: 1.A, CO2 with 7312.76 Gg CO2 / year (34.8%)
- 2: 3.A, CH4 with -897.60 Gg CO2 / year (-4.6%)
- 3: M.AG.ELV, N2O with -565.78 Gg CO2 / year (-7.2%)
- 4: 1.B.1, CH4 with -420.89 Gg CO2 / year (-40.6%)
- 5: 1.B.2, CH4 with -349.18 Gg CO2 / year (-50.6%)
For 1990-2022 the following sector-gas combinations have the highest absolute impact on national total KyotoGHG (AR6GWP100) emissions in 1990-2022 (top 5):
- 1: 1.A, CO2 with 2111.66 Gg CO2 / year (17.4%)
- 2: 3.A, CH4 with -49.83 Gg CO2 / year (-0.4%)
- 3: M.AG.ELV, N2O with -43.99 Gg CO2 / year (-0.9%)
- 4: 1.B.1, CH4 with -26.60 Gg CO2 / year (-6.7%)
- 5: 1.B.2, CH4 with 13.44 Gg CO2 / year (5.1%)
Changes in the main sectors for aggregate KyotoGHG (AR6GWP100) are
- 1: Total sectoral emissions in 2022 are 30177.07 Gg
CO2 / year which is 51.8% of M.0.EL emissions. 2022 Emissions have
changed by 26.1% (6244.53 Gg CO2 /
year). 1990-2022 Emissions have changed by 15.6% (2079.24 Gg CO2 / year). For 2022
the changes per gas
are:

For 1990-2022 the changes per gas are: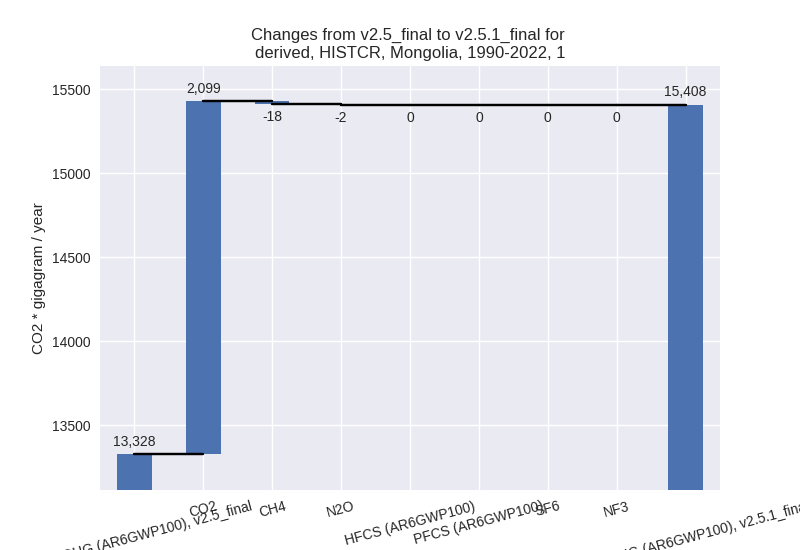
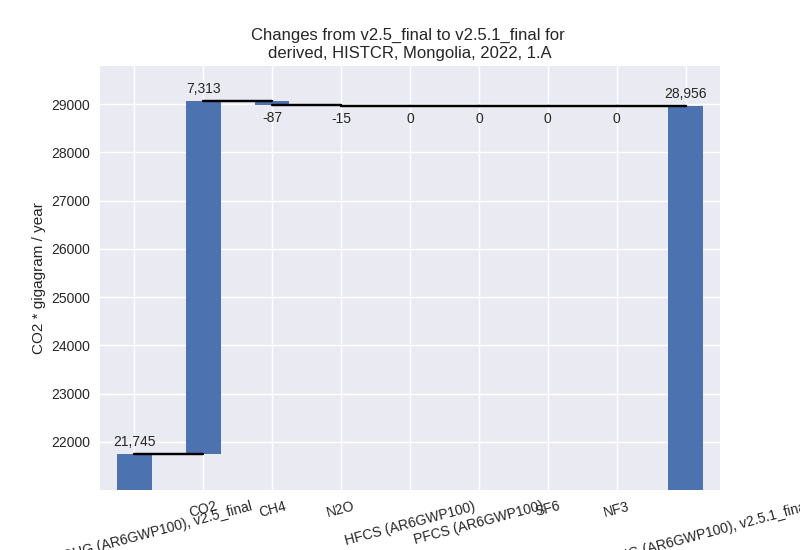
The changes come from the following subsectors:- 1.A: Total sectoral emissions in 2022 are 28955.87
Gg CO2 / year which is 96.0% of category 1 emissions. 2022 Emissions
have changed by 33.2% (7211.16 Gg
CO2 / year). 1990-2022 Emissions have changed by 16.8% (2104.81 Gg CO2 / year). For 2022
the changes per gas
are:
For 1990-2022 the changes per gas are: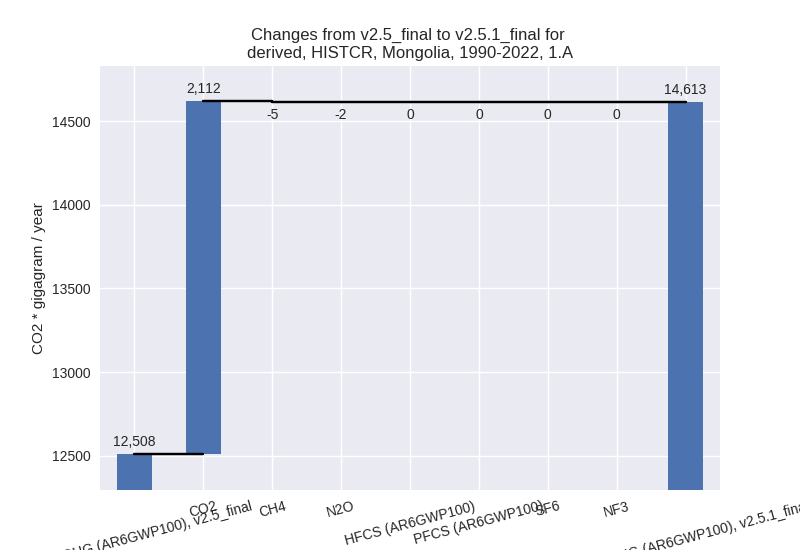
There is no subsector information available in PRIMAP-hist. - 1.B.1: Total sectoral emissions in 2022 are 879.83
Gg CO2 / year which is 2.9% of category 1 emissions. 2022 Emissions have
changed by -41.2% (-616.83 Gg CO2 /
year). 1990-2022 Emissions have changed by -7.0% (-38.99 Gg CO2 / year). For 2022 the
changes per gas
are:

For 1990-2022 the changes per gas are: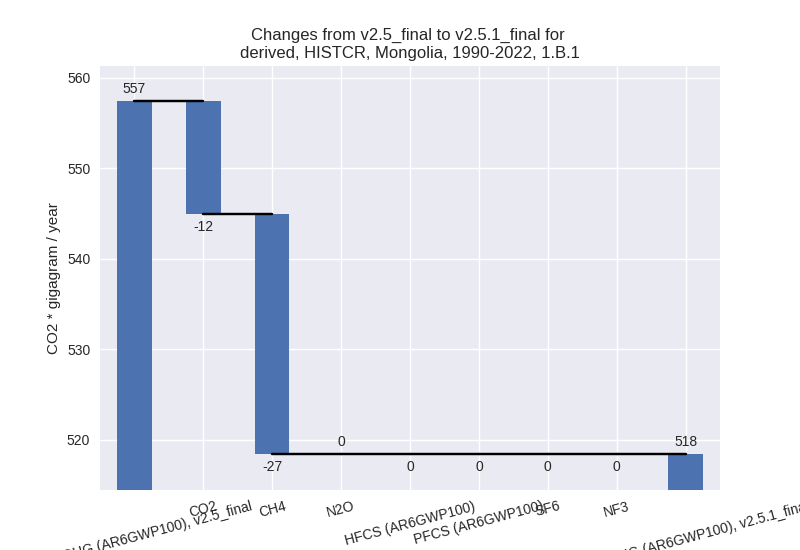
There is no subsector information available in PRIMAP-hist. - 1.B.2: Total sectoral emissions in 2022 are 341.37
Gg CO2 / year which is 1.1% of category 1 emissions. 2022 Emissions have
changed by -50.6% (-349.80 Gg CO2 /
year). 1990-2022 Emissions have changed by 5.1% (13.42 Gg CO2 / year). For 2022 the
changes per gas
are:

For 1990-2022 the changes per gas are: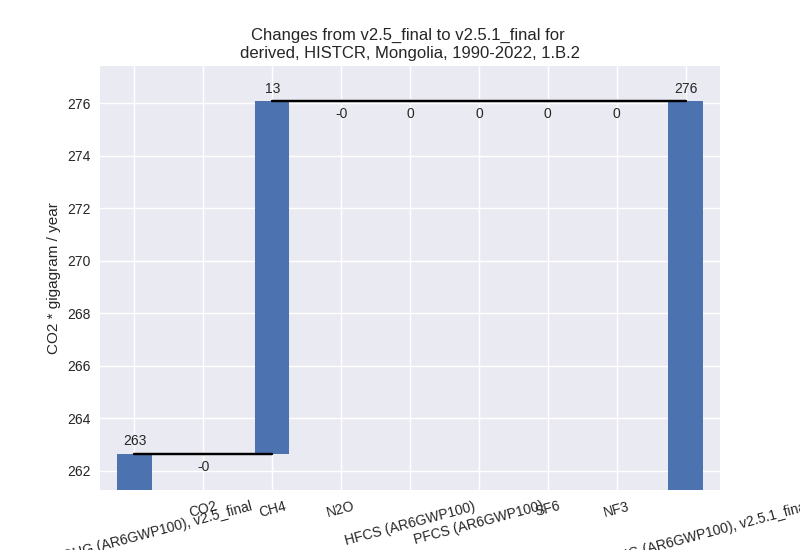
There is no subsector information available in PRIMAP-hist.
- 1.A: Total sectoral emissions in 2022 are 28955.87
Gg CO2 / year which is 96.0% of category 1 emissions. 2022 Emissions
have changed by 33.2% (7211.16 Gg
CO2 / year). 1990-2022 Emissions have changed by 16.8% (2104.81 Gg CO2 / year). For 2022
the changes per gas
are:
- 2: Total sectoral emissions in 2022 are 987.72 Gg CO2 / year which is 1.7% of M.0.EL emissions. 2022 Emissions have changed by 0.0% (0.42 Gg CO2 / year). 1990-2022 Emissions have changed by 0.0% (0.02 Gg CO2 / year).
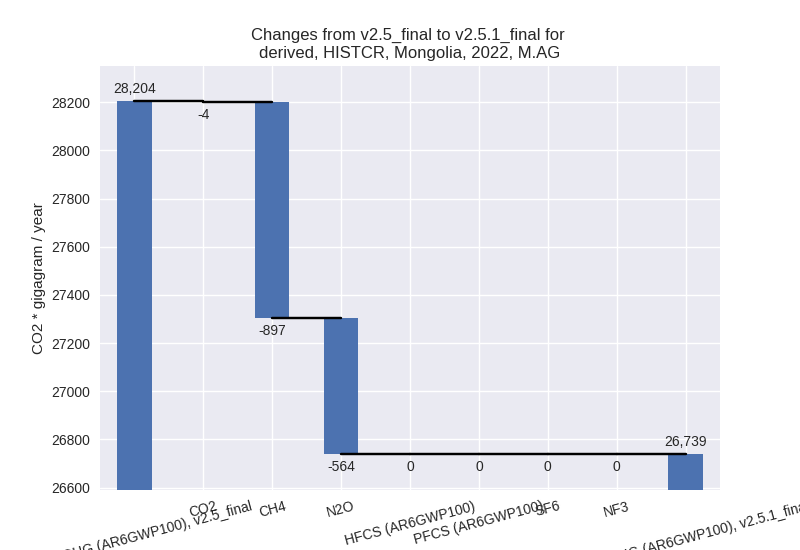
- M.AG: Total sectoral emissions in 2022 are 26738.68
Gg CO2 / year which is 45.9% of M.0.EL emissions. 2022 Emissions have
changed by -5.2% (-1465.14 Gg CO2 /
year). 1990-2022 Emissions have changed by -0.6% (-95.14 Gg CO2 / year). For 2022 the
changes per gas
are:
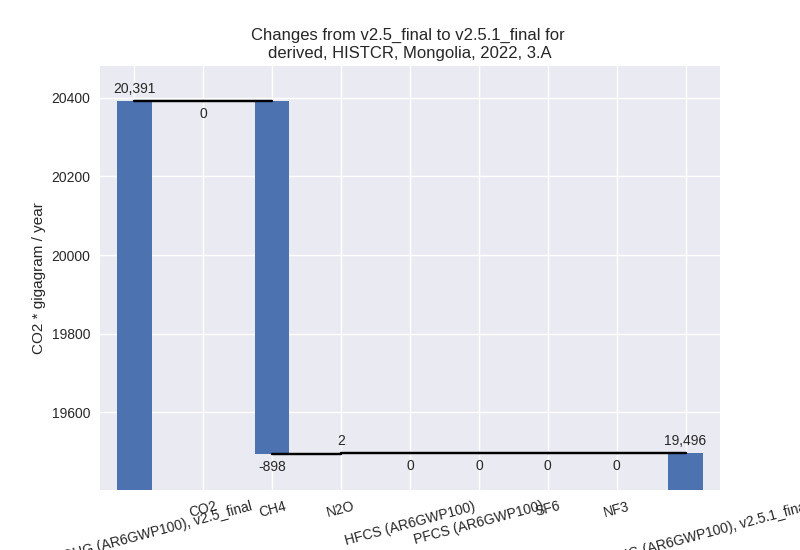
The changes come from the following subsectors:- 3.A: Total sectoral emissions in 2022 are 19495.51
Gg CO2 / year which is 72.9% of category M.AG emissions. 2022 Emissions
have changed by -4.4% (-895.49 Gg
CO2 / year). 1990-2022 Emissions have changed by -0.4% (-48.81 Gg CO2 / year). For 2022 the
changes per gas
are:
There is no subsector information available in PRIMAP-hist. - M.AG.ELV: Total sectoral emissions in 2022 are
7243.17 Gg CO2 / year which is 27.1% of category M.AG emissions. 2022
Emissions have changed by -7.3%
(-569.65 Gg CO2 / year). 1990-2022 Emissions have changed by -0.9% (-46.32 Gg CO2 / year). For 2022 the
changes per gas
are:
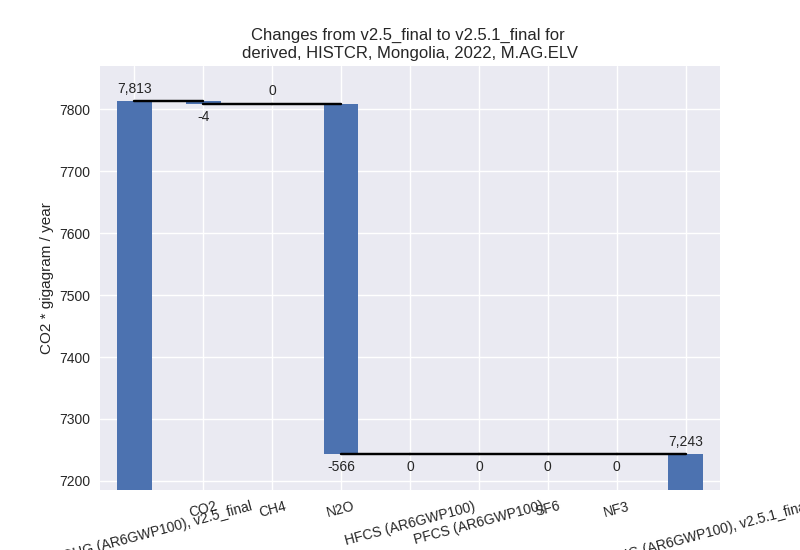
There is no subsector information available in PRIMAP-hist.
- 3.A: Total sectoral emissions in 2022 are 19495.51
Gg CO2 / year which is 72.9% of category M.AG emissions. 2022 Emissions
have changed by -4.4% (-895.49 Gg
CO2 / year). 1990-2022 Emissions have changed by -0.4% (-48.81 Gg CO2 / year). For 2022 the
changes per gas
are:
- 4: Total sectoral emissions in 2022 are 246.12 Gg
CO2 / year which is 0.4% of M.0.EL emissions. 2022 Emissions have
changed by -6.8% (-18.01 Gg CO2 /
year). 1990-2022 Emissions have changed by -0.4% (-0.55 Gg CO2 / year). For 2022 the
changes per gas
are:

- 5: Total sectoral emissions in 2022 are 136.83 Gg
CO2 / year which is 0.2% of M.0.EL emissions. 2022 Emissions have
changed by 7.0% (8.92 Gg CO2 /
year). 1990-2022 Emissions have changed by 0.4% (0.27 Gg CO2 / year). For 2022 the
changes per gas
are:

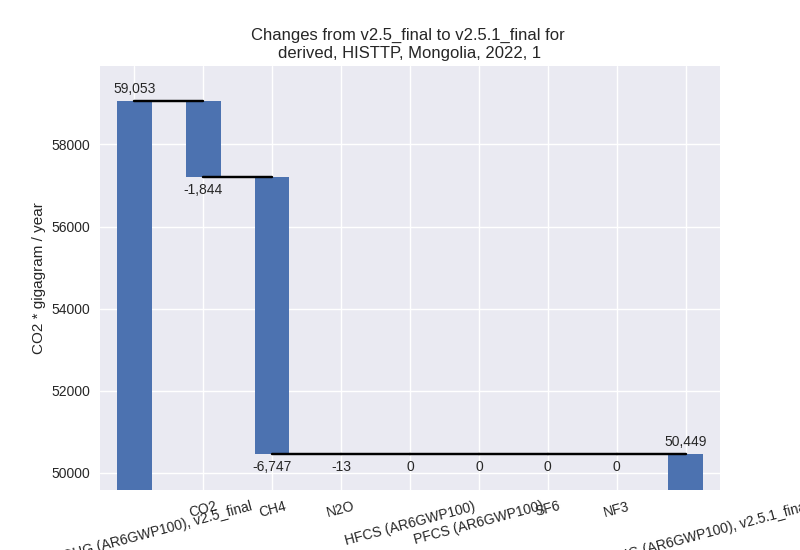
third party scenario (HISTTP):
Most important changes per time frame
For 2022 the following sector-gas combinations have the highest absolute impact on national total KyotoGHG (AR6GWP100) emissions in 2022 (top 5):
- 1: 1.B.1, CH4 with -6607.36 Gg CO2 / year (-35.9%)
- 2: 1.A, CO2 with -1636.66 Gg CO2 / year (-4.2%)
- 3: 3.A, CH4 with -940.81 Gg CO2 / year (-4.6%)
- 4: M.AG.ELV, N2O with 375.03 Gg CO2 / year (3.1%)
- 5: 1.B.1, CO2 with -196.21 Gg CO2 / year (-42.7%)
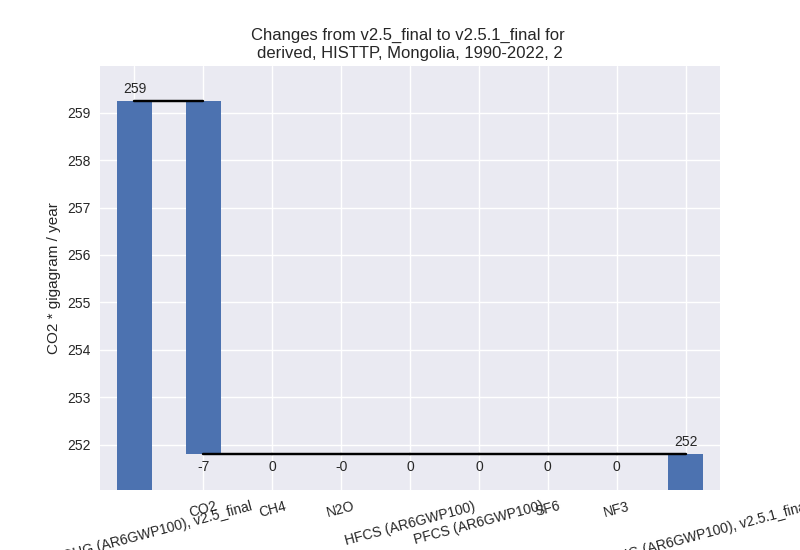
For 1990-2022 the following sector-gas combinations have the highest absolute impact on national total KyotoGHG (AR6GWP100) emissions in 1990-2022 (top 5):
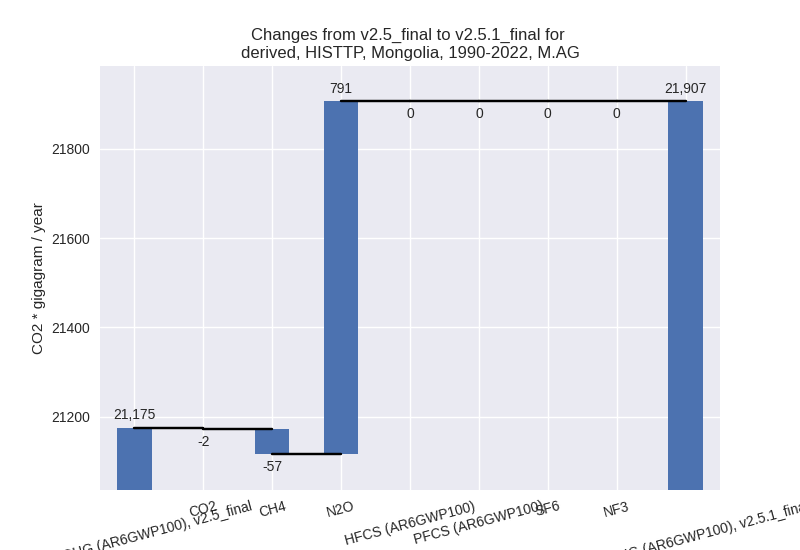
- 1: M.AG.ELV, N2O with 789.86 Gg CO2 / year (9.4%)
- 2: 1.A, CO2 with 364.74 Gg CO2 / year (2.0%)
- 3: 1.B.1, CH4 with 83.69 Gg CO2 / year (1.5%)
- 4: 3.A, CH4 with -52.39 Gg CO2 / year (-0.4%)
- 5: 1.B.1, CO2 with -12.41 Gg CO2 / year (-7.8%)
Changes in the main sectors for aggregate KyotoGHG (AR6GWP100) are
- 1: Total sectoral emissions in 2022 are 50448.71 Gg
CO2 / year which is 59.2% of M.0.EL emissions. 2022 Emissions have
changed by -14.6% (-8604.11 Gg CO2 /
year). 1990-2022 Emissions have changed by 1.8% (431.35 Gg CO2 / year). For 2022 the
changes per gas
are:
The changes come from the following subsectors:- 1.A: Total sectoral emissions in 2022 are 38312.51
Gg CO2 / year which is 75.9% of category 1 emissions. 2022 Emissions
have changed by -4.3% (-1722.29 Gg
CO2 / year). 1990-2022 Emissions have changed by 1.9% (357.77 Gg CO2 / year). For 2022 the
changes per gas
are:

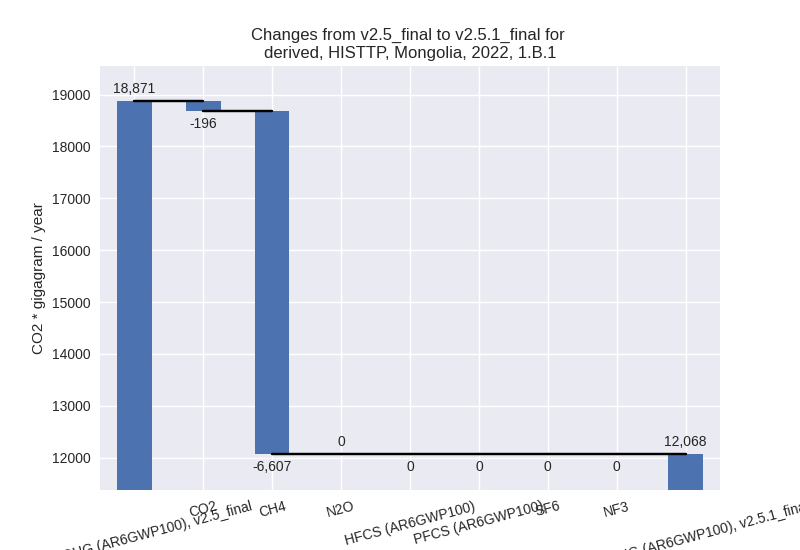
There is no subsector information available in PRIMAP-hist. - 1.B.1: Total sectoral emissions in 2022 are
12068.18 Gg CO2 / year which is 23.9% of category 1 emissions. 2022
Emissions have changed by -36.1%
(-6803.30 Gg CO2 / year). 1990-2022 Emissions have changed by 1.2% (71.30 Gg CO2 / year). For 2022 the
changes per gas
are:
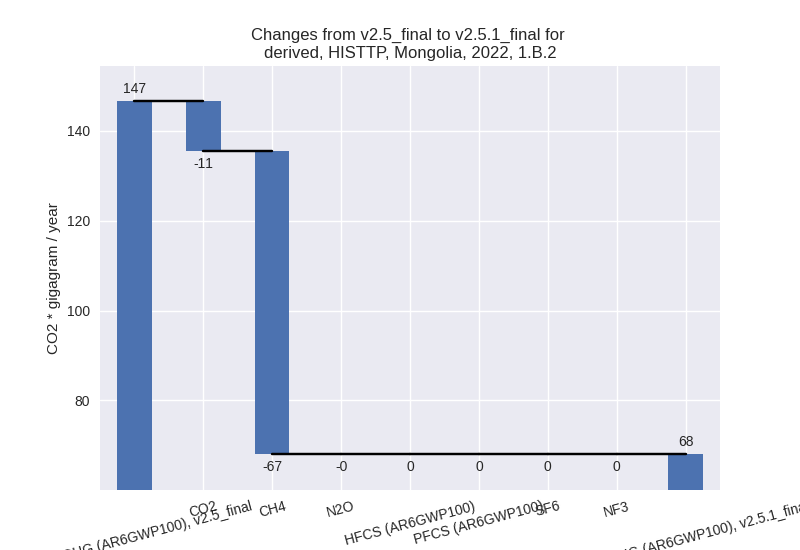
There is no subsector information available in PRIMAP-hist. - 1.B.2: Total sectoral emissions in 2022 are 68.03
Gg CO2 / year which is 0.1% of category 1 emissions. 2022 Emissions have
changed by -53.6% (-78.53 Gg CO2 /
year). 1990-2022 Emissions have changed by 4.2% (2.28 Gg CO2 / year). For 2022 the
changes per gas
are:
For 1990-2022 the changes per gas are:
There is no subsector information available in PRIMAP-hist.
- 1.A: Total sectoral emissions in 2022 are 38312.51
Gg CO2 / year which is 75.9% of category 1 emissions. 2022 Emissions
have changed by -4.3% (-1722.29 Gg
CO2 / year). 1990-2022 Emissions have changed by 1.9% (357.77 Gg CO2 / year). For 2022 the
changes per gas
are:
- 2: Total sectoral emissions in 2022 are 914.94 Gg
CO2 / year which is 1.1% of M.0.EL emissions. 2022 Emissions have
changed by -0.3% (-2.37 Gg CO2 /
year). 1990-2022 Emissions have changed by -2.9% (-7.44 Gg CO2 / year). For 1990-2022
the changes per gas
are:
- M.AG: Total sectoral emissions in 2022 are 32929.39
Gg CO2 / year which is 38.6% of M.0.EL emissions. 2022 Emissions have
changed by -1.8% (-613.11 Gg CO2 /
year). 1990-2022 Emissions have changed by 3.5% (731.98 Gg CO2 / year). For 1990-2022
the changes per gas
are:
The changes come from the following subsectors:- 3.A: Total sectoral emissions in 2022 are 20512.73
Gg CO2 / year which is 62.3% of category M.AG emissions. 2022 Emissions
have changed by -4.4% (-938.70 Gg
CO2 / year). 1990-2022 Emissions have changed by -0.4% (-51.37 Gg CO2 / year). For 2022 the
changes per gas
are:

There is no subsector information available in PRIMAP-hist. - M.AG.ELV: Total sectoral emissions in 2022 are
12416.66 Gg CO2 / year which is 37.7% of category M.AG emissions. 2022
Emissions have changed by 2.7%
(325.59 Gg CO2 / year). 1990-2022 Emissions have changed by 9.0% (783.36 Gg CO2 / year). For 2022 the
changes per gas
are:
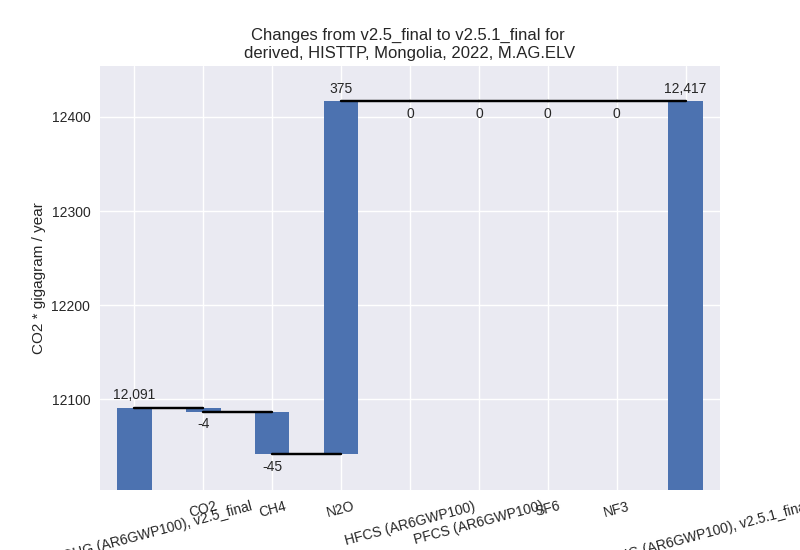
For 1990-2022 the changes per gas are: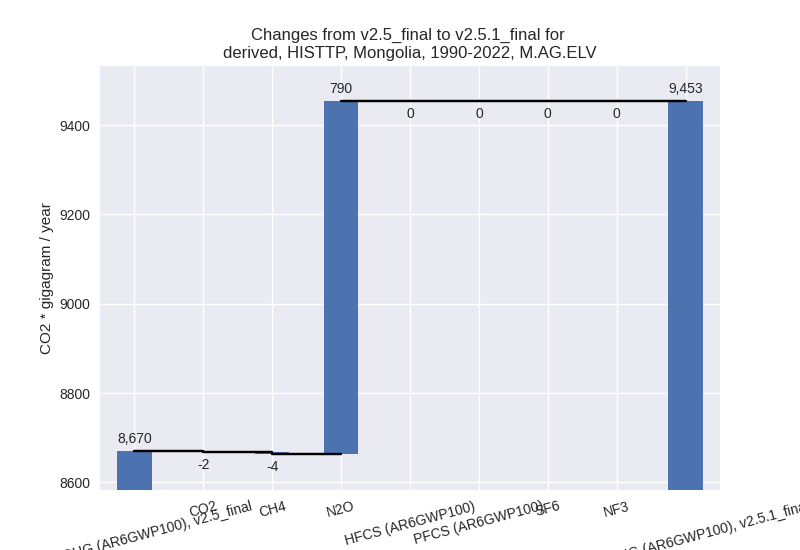
There is no subsector information available in PRIMAP-hist.
- 3.A: Total sectoral emissions in 2022 are 20512.73
Gg CO2 / year which is 62.3% of category M.AG emissions. 2022 Emissions
have changed by -4.4% (-938.70 Gg
CO2 / year). 1990-2022 Emissions have changed by -0.4% (-51.37 Gg CO2 / year). For 2022 the
changes per gas
are:
- 4: Total sectoral emissions in 2022 are 852.23 Gg CO2 / year which is 1.0% of M.0.EL emissions. 2022 Emissions have changed by -0.6% (-4.99 Gg CO2 / year). 1990-2022 Emissions have changed by -0.0% (-0.15 Gg CO2 / year).
- 5: Total sectoral emissions in 2022 are 136.83 Gg
CO2 / year which is 0.2% of M.0.EL emissions. 2022 Emissions have
changed by 7.0% (8.92 Gg CO2 /
year). 1990-2022 Emissions have changed by 0.4% (0.27 Gg CO2 / year). For 2022 the
changes per gas
are:
