Changes in PRIMAP-hist v2.5.1_final compared to v2.5_final for Mozambique
2024-02-29
Johannes Gütschow
Change analysis for Mozambique for PRIMAP-hist v2.5.1_final compared to v2.5_final
Overview over emissions by sector and gas
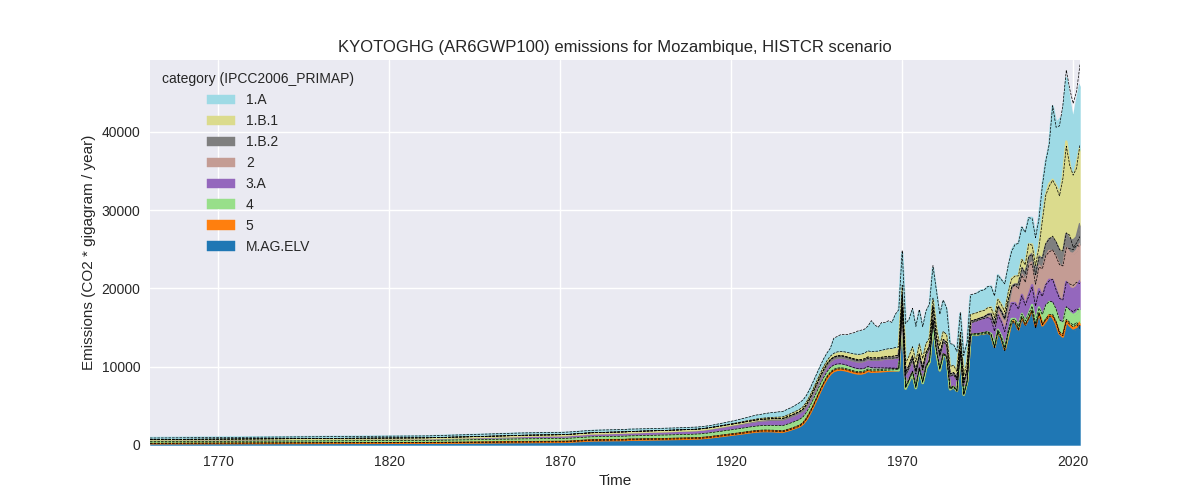
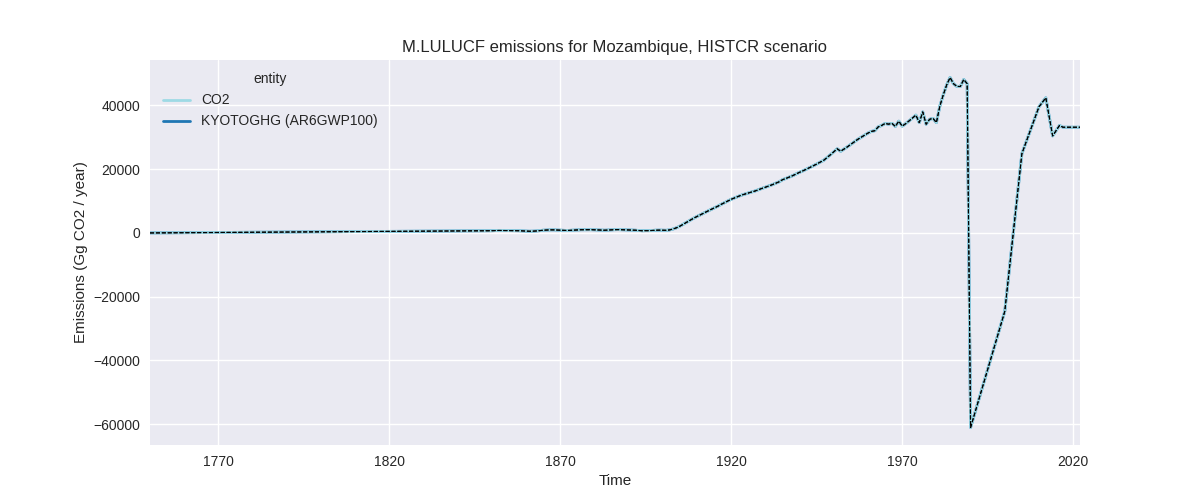
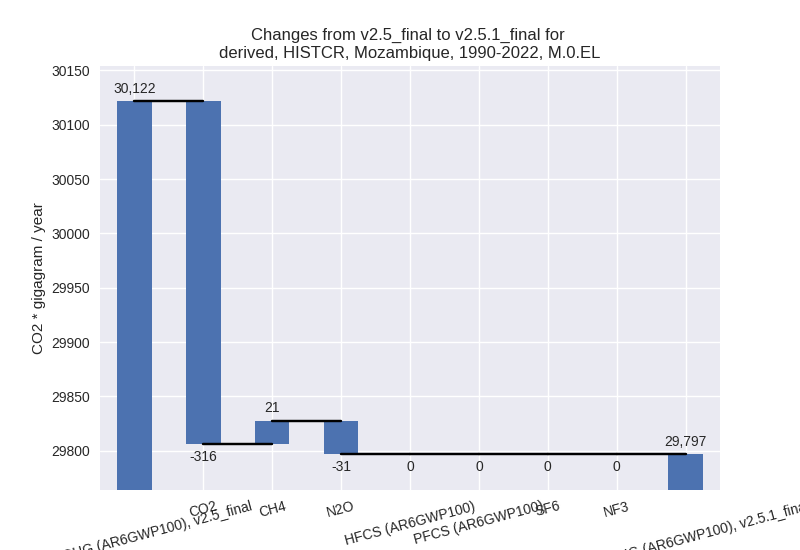
The following figures show the aggregate national total emissions excluding LULUCF AR6GWP100 for the country reported priority scenario. The dotted linesshow the v2.5_final data.

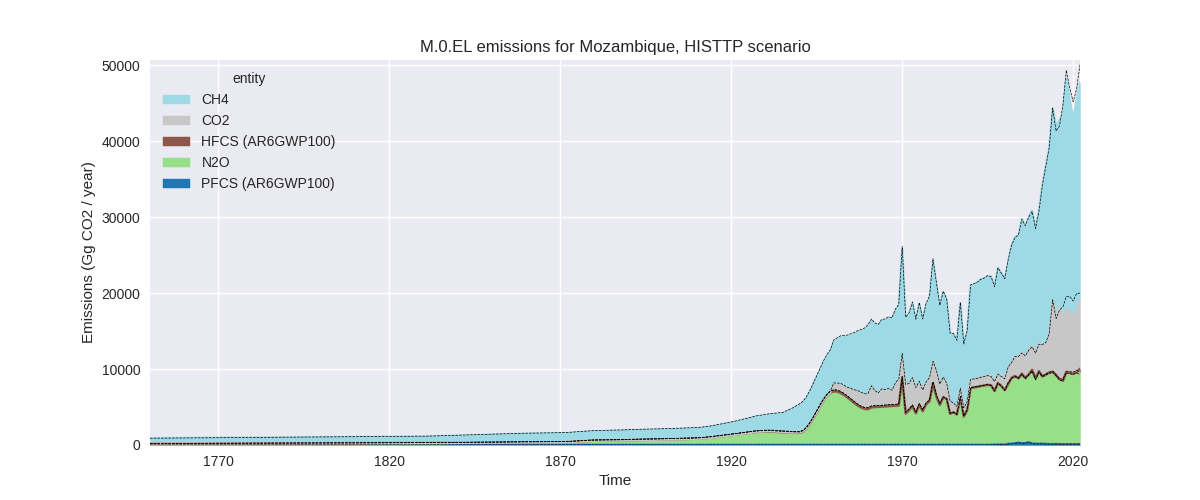
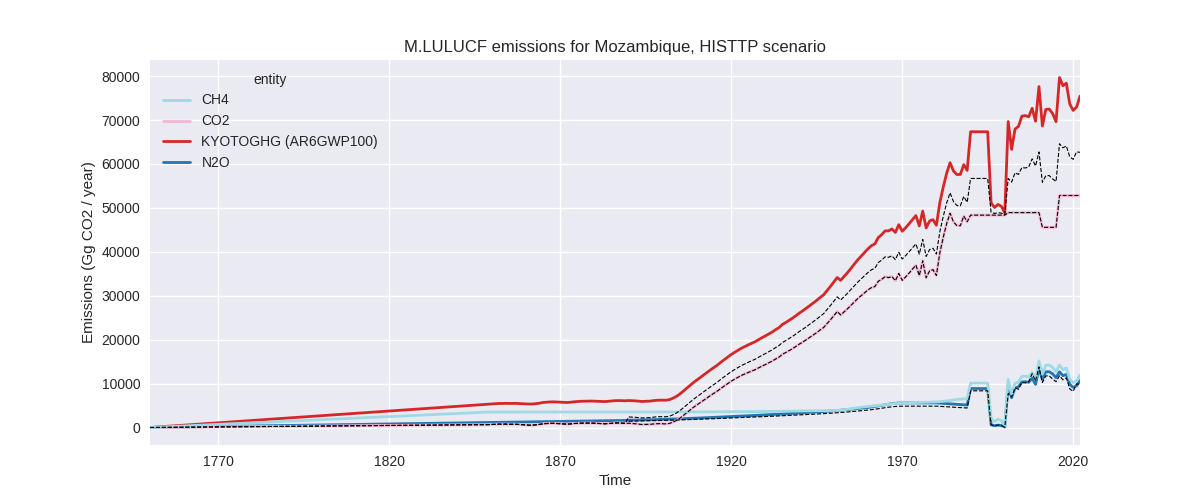
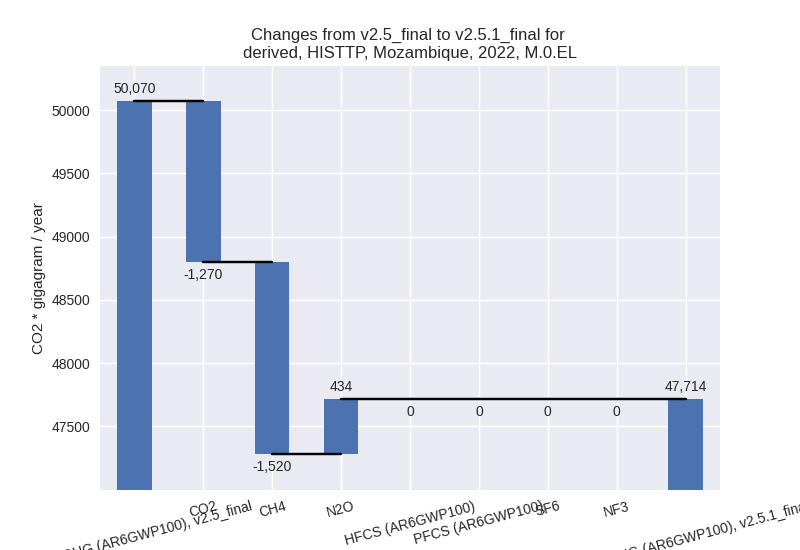
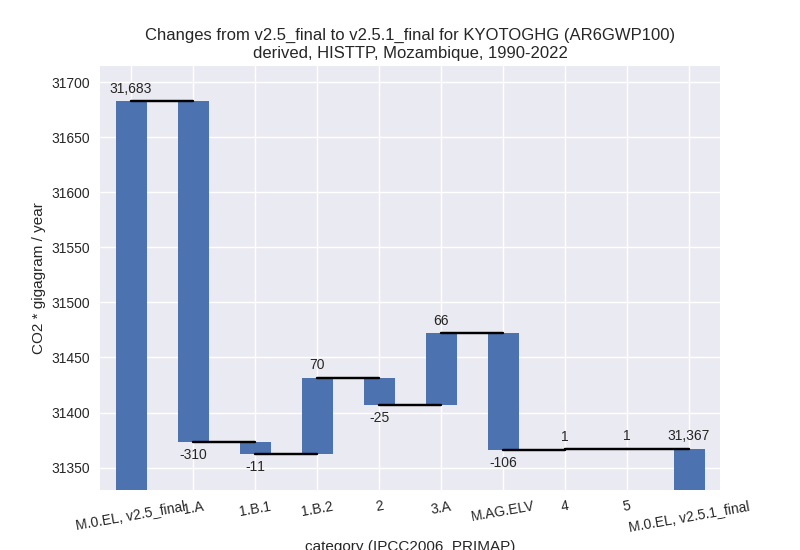
The following figures show the aggregate national total emissions excluding LULUCF AR6GWP100 for the third party priority scenario. The dotted linesshow the v2.5_final data.

Overview over changes
In the country reported priority scenario we have the following changes for aggregate Kyoto GHG and national total emissions excluding LULUCF (M.0.EL):
- Emissions in 2022 have changed by -5.5%% (-2657.74 Gg CO2 / year)
- Emissions in 1990-2022 have changed by -1.1%% (-324.84 Gg CO2 / year)
In the third party priority scenario we have the following changes for aggregate Kyoto GHG and national total emissions excluding LULUCF (M.0.EL):
- Emissions in 2022 have changed by -4.7%% (-2355.91 Gg CO2 / year)
- Emissions in 1990-2022 have changed by -1.0%% (-315.69 Gg CO2 / year)
Most important changes per scenario and time frame
In the country reported priority scenario the following sector-gas combinations have the highest absolute impact on national total KyotoGHG (AR6GWP100) emissions in 2022 (top 5):
- 1: 1.A, CO2 with -2065.00 Gg CO2 / year (-25.8%)
- 2: 1.B.1, CH4 with -2011.72 Gg CO2 / year (-17.4%)
- 3: 1.B.2, CO2 with 855.43 Gg CO2 / year (8196.0%)
- 4: M.AG.ELV, N2O with 450.83 Gg CO2 / year (5.8%)
- 5: 1.B.2, CH4 with 401.94 Gg CO2 / year (31.4%)
In the country reported priority scenario the following sector-gas combinations have the highest absolute impact on national total KyotoGHG (AR6GWP100) emissions in 1990-2022 (top 5):
- 1: 1.A, CO2 with -308.36 Gg CO2 / year (-9.8%)
- 2: M.AG.ELV, CH4 with -73.16 Gg CO2 / year (-1.0%)
- 3: 3.A, CH4 with 67.22 Gg CO2 / year (3.2%)
- 4: 1.B.2, CH4 with 43.62 Gg CO2 / year (5.8%)
- 5: M.AG.ELV, N2O with -28.59 Gg CO2 / year (-0.4%)
In the third party priority scenario the following sector-gas combinations have the highest absolute impact on national total KyotoGHG (AR6GWP100) emissions in 2022 (top 5):
- 1: 1.A, CO2 with -2065.00 Gg CO2 / year (-25.8%)
- 2: 1.B.1, CH4 with -2011.72 Gg CO2 / year (-17.4%)
- 3: 1.B.2, CO2 with 855.43 Gg CO2 / year (8196.0%)
- 4: M.AG.ELV, N2O with 450.83 Gg CO2 / year (5.8%)
- 5: 1.B.2, CH4 with 401.94 Gg CO2 / year (31.4%)
In the third party priority scenario the following sector-gas combinations have the highest absolute impact on national total KyotoGHG (AR6GWP100) emissions in 1990-2022 (top 5):
- 1: 1.A, CO2 with -308.36 Gg CO2 / year (-9.8%)
- 2: M.AG.ELV, CH4 with -73.16 Gg CO2 / year (-1.0%)
- 3: 3.A, CH4 with 67.22 Gg CO2 / year (3.2%)
- 4: 1.B.2, CH4 with 43.62 Gg CO2 / year (5.8%)
- 5: M.AG.ELV, N2O with -28.59 Gg CO2 / year (-0.4%)
Notes on data changes
Here we list notes explaining important emissions changes for the country. ’' means that the following text only applies to the TP time series, while means that it only applies to the CR scenario. Otherwise the note applies to both scenarios.
- 1.A, CO2: Updated CDIAC data show a steep emissions decline from 2017 to 2020 which is less pronounced in the EI 2023 data which was used in v2.5 to extend CDIAC 2020. Thus emissions for the last years are lower in PRIMAP-hist v2.5.1.
- 1.B.1, CH4: EDGAR 8.0 data are lower than EDGAR 7.0 for 2020 and 2021 leading to lower 2022 emissions in PRIMAP-hist v2.5.1.
Changes by sector and gas
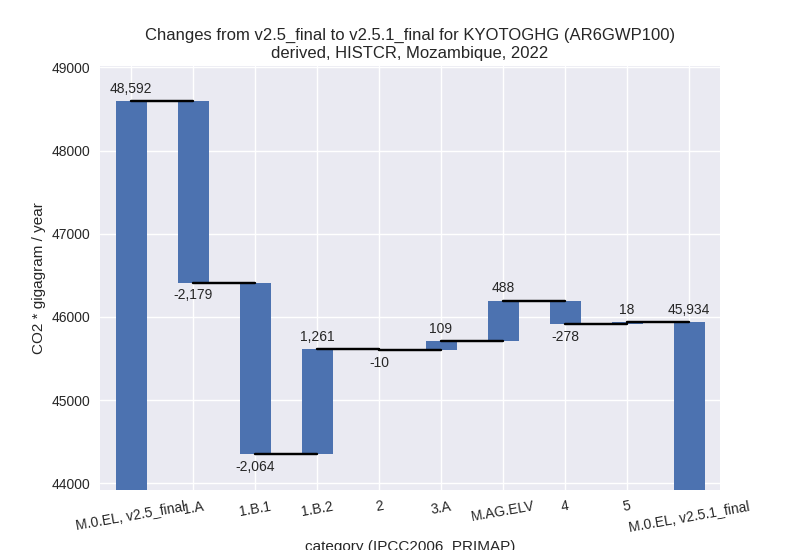
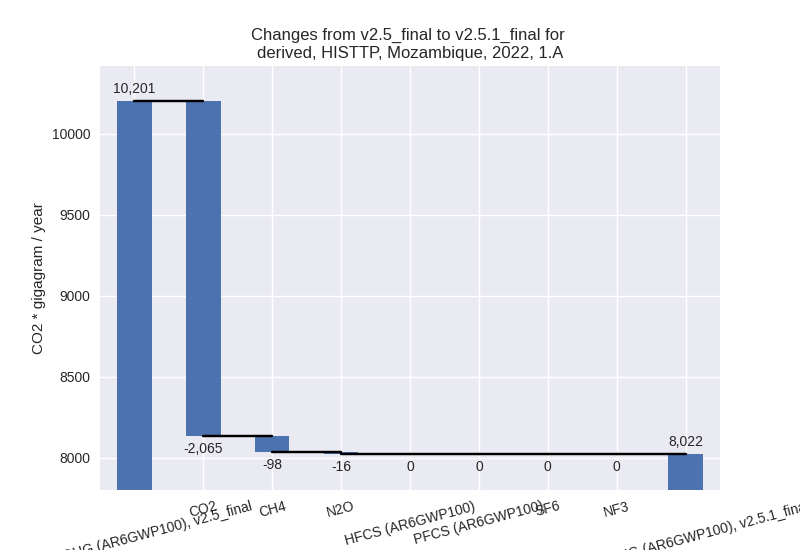
For each scenario and time frame the changes are displayed for all individual sectors and all individual gases. In the sector plot we use aggregate Kyoto GHGs in AR6GWP100. In the gas plot we usenational total emissions without LULUCF. ## country reported scenario
2022

1990-2022

third party scenario
2022

1990-2022

Detailed changes for the scenarios:
country reported scenario (HISTCR):
Most important changes per time frame
For 2022 the following sector-gas combinations have the highest absolute impact on national total KyotoGHG (AR6GWP100) emissions in 2022 (top 5):
- 1: 1.A, CO2 with -2065.00 Gg CO2 / year (-25.8%)
- 2: 1.B.1, CH4 with -2011.72 Gg CO2 / year (-17.4%)
- 3: 1.B.2, CO2 with 855.43 Gg CO2 / year (8196.0%)
- 4: M.AG.ELV, N2O with 450.83 Gg CO2 / year (5.8%)
- 5: 1.B.2, CH4 with 401.94 Gg CO2 / year (31.4%)
For 1990-2022 the following sector-gas combinations have the highest absolute impact on national total KyotoGHG (AR6GWP100) emissions in 1990-2022 (top 5):
- 1: 1.A, CO2 with -308.36 Gg CO2 / year (-9.8%)
- 2: M.AG.ELV, CH4 with -73.16 Gg CO2 / year (-1.0%)
- 3: 3.A, CH4 with 67.22 Gg CO2 / year (3.2%)
- 4: 1.B.2, CH4 with 43.62 Gg CO2 / year (5.8%)
- 5: M.AG.ELV, N2O with -28.59 Gg CO2 / year (-0.4%)
Changes in the main sectors for aggregate KyotoGHG (AR6GWP100) are
- 1: Total sectoral emissions in 2022 are 20272.45 Gg
CO2 / year which is 44.1% of M.0.EL emissions. 2022 Emissions have
changed by -12.8% (-2983.12 Gg CO2 /
year). 1990-2022 Emissions have changed by -2.7% (-250.94 Gg CO2 / year). For 2022
the changes per gas
are:

For 1990-2022 the changes per gas are:
The changes come from the following subsectors:- 1.A: Total sectoral emissions in 2022 are 8021.85
Gg CO2 / year which is 39.6% of category 1 emissions. 2022 Emissions
have changed by -21.4% (-2179.22 Gg
CO2 / year). 1990-2022 Emissions have changed by -6.1% (-309.69 Gg CO2 / year). For 2022
the changes per gas
are:

For 1990-2022 the changes per gas are:
There is no subsector information available in PRIMAP-hist. - 1.B.1: Total sectoral emissions in 2022 are 9697.85
Gg CO2 / year which is 47.8% of category 1 emissions. 2022 Emissions
have changed by -17.6% (-2064.48 Gg
CO2 / year). 1990-2022 Emissions have changed by -0.3% (-10.90 Gg CO2 / year). For 2022 the
changes per gas
are:

There is no subsector information available in PRIMAP-hist. - 1.B.2: Total sectoral emissions in 2022 are 2552.75
Gg CO2 / year which is 12.6% of category 1 emissions. 2022 Emissions
have changed by 97.6% (1260.57 Gg
CO2 / year). 1990-2022 Emissions have changed by 9.2% (69.65 Gg CO2 / year). For 2022 the
changes per gas
are:
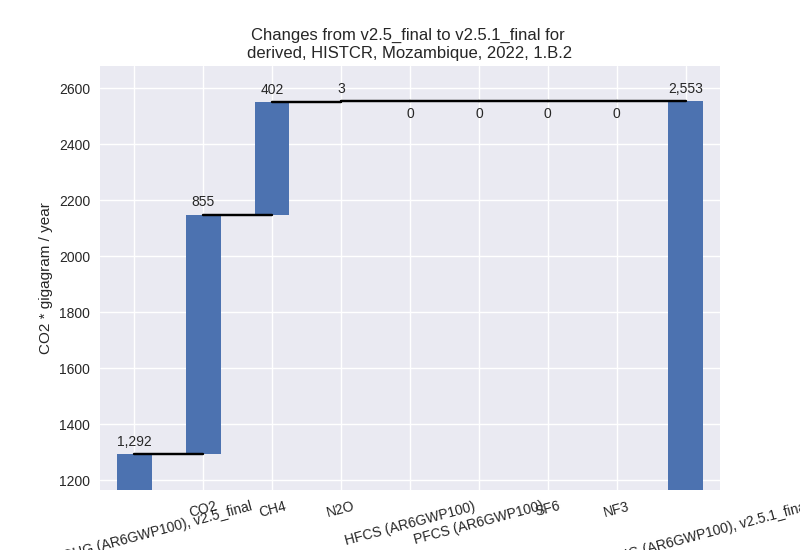
For 1990-2022 the changes per gas are:
There is no subsector information available in PRIMAP-hist.
- 1.A: Total sectoral emissions in 2022 are 8021.85
Gg CO2 / year which is 39.6% of category 1 emissions. 2022 Emissions
have changed by -21.4% (-2179.22 Gg
CO2 / year). 1990-2022 Emissions have changed by -6.1% (-309.69 Gg CO2 / year). For 2022
the changes per gas
are:
- 2: Total sectoral emissions in 2022 are 4722.48 Gg CO2 / year which is 10.3% of M.0.EL emissions. 2022 Emissions have changed by -0.2% (-10.37 Gg CO2 / year). 1990-2022 Emissions have changed by -1.0% (-25.26 Gg CO2 / year).
- M.AG: Total sectoral emissions in 2022 are 18872.79
Gg CO2 / year which is 41.1% of M.0.EL emissions. 2022 Emissions have
changed by 3.3% (596.51 Gg CO2 /
year). 1990-2022 Emissions have changed by -0.2% (-40.73 Gg CO2 / year). For 2022 the
changes per gas
are:

The changes come from the following subsectors:- 3.A: Total sectoral emissions in 2022 are 3521.09
Gg CO2 / year which is 18.7% of category M.AG emissions. 2022 Emissions
have changed by 3.2% (108.97 Gg CO2
/ year). 1990-2022 Emissions have changed by 2.8% (65.61 Gg CO2 / year). For 2022 the
changes per gas
are:

For 1990-2022 the changes per gas are: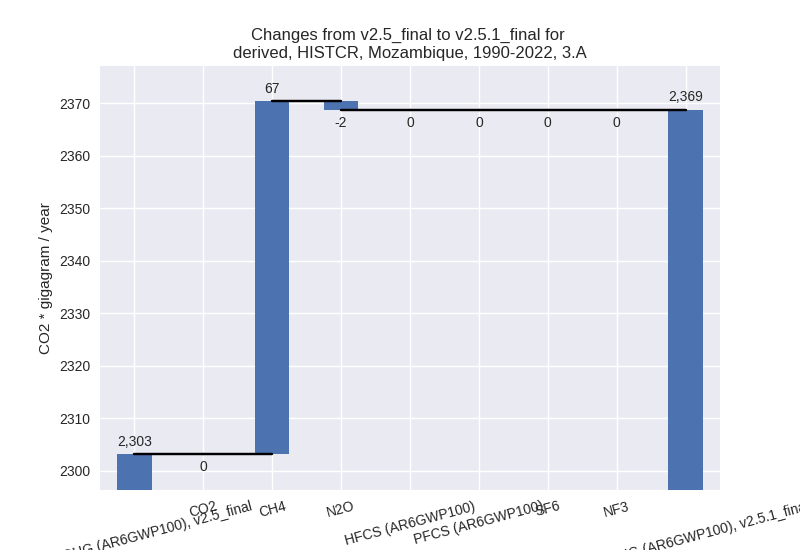
There is no subsector information available in PRIMAP-hist. - M.AG.ELV: Total sectoral emissions in 2022 are
15351.71 Gg CO2 / year which is 81.3% of category M.AG emissions. 2022
Emissions have changed by 3.3%
(487.54 Gg CO2 / year). 1990-2022 Emissions have changed by -0.7% (-106.34 Gg CO2 / year). For 2022
the changes per gas
are:
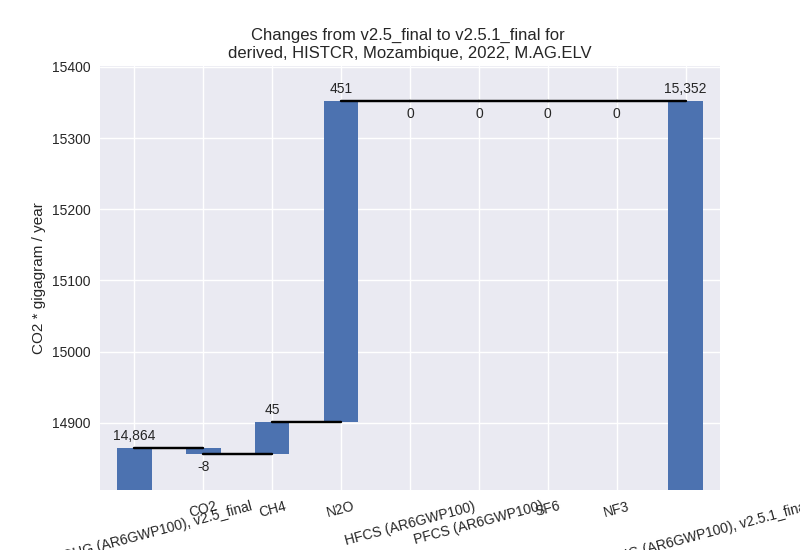
There is no subsector information available in PRIMAP-hist.
- 3.A: Total sectoral emissions in 2022 are 3521.09
Gg CO2 / year which is 18.7% of category M.AG emissions. 2022 Emissions
have changed by 3.2% (108.97 Gg CO2
/ year). 1990-2022 Emissions have changed by 2.8% (65.61 Gg CO2 / year). For 2022 the
changes per gas
are:
- 4: Total sectoral emissions in 2022 are 1788.28 Gg
CO2 / year which is 3.9% of M.0.EL emissions. 2022 Emissions have
changed by -13.5% (-278.36 Gg CO2 /
year). 1990-2022 Emissions have changed by -1.1% (-8.44 Gg CO2 / year). For 2022 the
changes per gas
are:

- 5: Total sectoral emissions in 2022 are 278.20 Gg
CO2 / year which is 0.6% of M.0.EL emissions. 2022 Emissions have
changed by 6.8% (17.60 Gg CO2 /
year). 1990-2022 Emissions have changed by 0.3% (0.53 Gg CO2 / year). For 2022 the
changes per gas
are:

third party scenario (HISTTP):
Most important changes per time frame
For 2022 the following sector-gas combinations have the highest absolute impact on national total KyotoGHG (AR6GWP100) emissions in 2022 (top 5):
- 1: 1.A, CO2 with -2065.00 Gg CO2 / year (-25.8%)
- 2: 1.B.1, CH4 with -2011.72 Gg CO2 / year (-17.4%)
- 3: 1.B.2, CO2 with 855.43 Gg CO2 / year (8196.0%)
- 4: M.AG.ELV, N2O with 450.83 Gg CO2 / year (5.8%)
- 5: 1.B.2, CH4 with 401.94 Gg CO2 / year (31.4%)
For 1990-2022 the following sector-gas combinations have the highest absolute impact on national total KyotoGHG (AR6GWP100) emissions in 1990-2022 (top 5):
- 1: 1.A, CO2 with -308.36 Gg CO2 / year (-9.8%)
- 2: M.AG.ELV, CH4 with -73.16 Gg CO2 / year (-1.0%)
- 3: 3.A, CH4 with 67.22 Gg CO2 / year (3.2%)
- 4: 1.B.2, CH4 with 43.62 Gg CO2 / year (5.8%)
- 5: M.AG.ELV, N2O with -28.59 Gg CO2 / year (-0.4%)
Changes in the main sectors for aggregate KyotoGHG (AR6GWP100) are
- 1: Total sectoral emissions in 2022 are 20272.45 Gg
CO2 / year which is 42.5% of M.0.EL emissions. 2022 Emissions have
changed by -12.8% (-2983.12 Gg CO2 /
year). 1990-2022 Emissions have changed by -2.7% (-250.94 Gg CO2 / year). For 2022
the changes per gas
are:
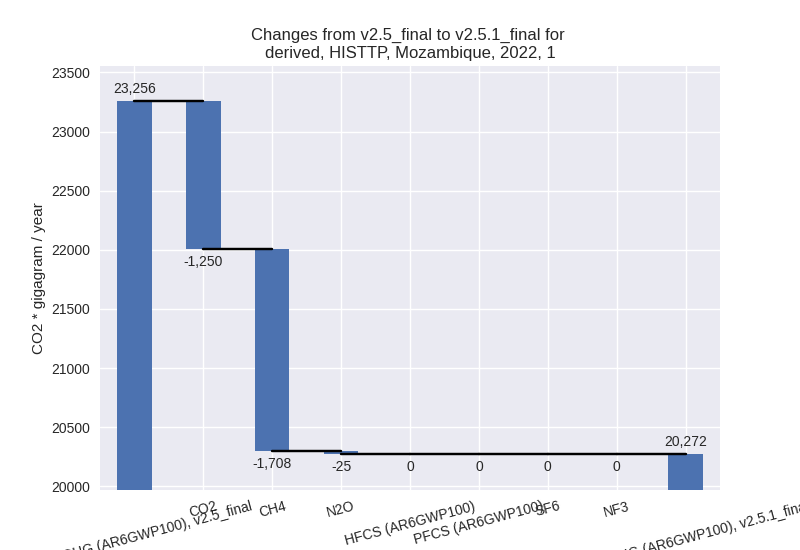
For 1990-2022 the changes per gas are: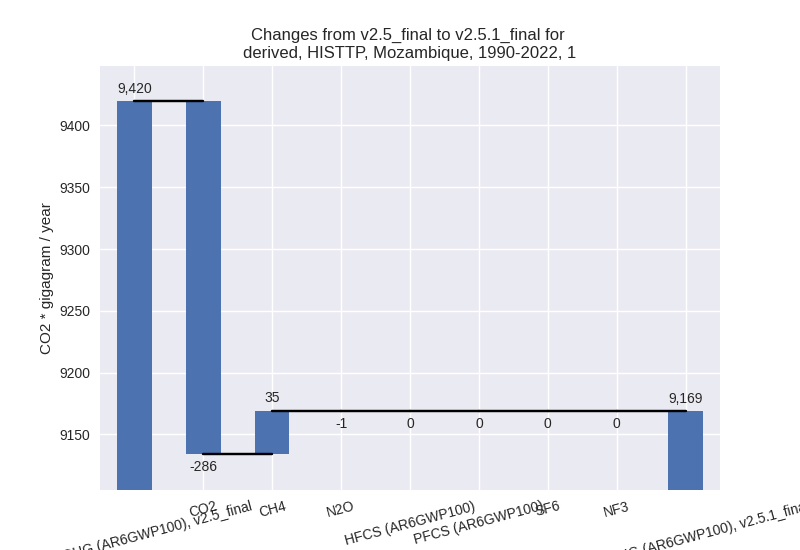
The changes come from the following subsectors:- 1.A: Total sectoral emissions in 2022 are 8021.85
Gg CO2 / year which is 39.6% of category 1 emissions. 2022 Emissions
have changed by -21.4% (-2179.22 Gg
CO2 / year). 1990-2022 Emissions have changed by -6.1% (-309.69 Gg CO2 / year). For 2022
the changes per gas
are:
For 1990-2022 the changes per gas are: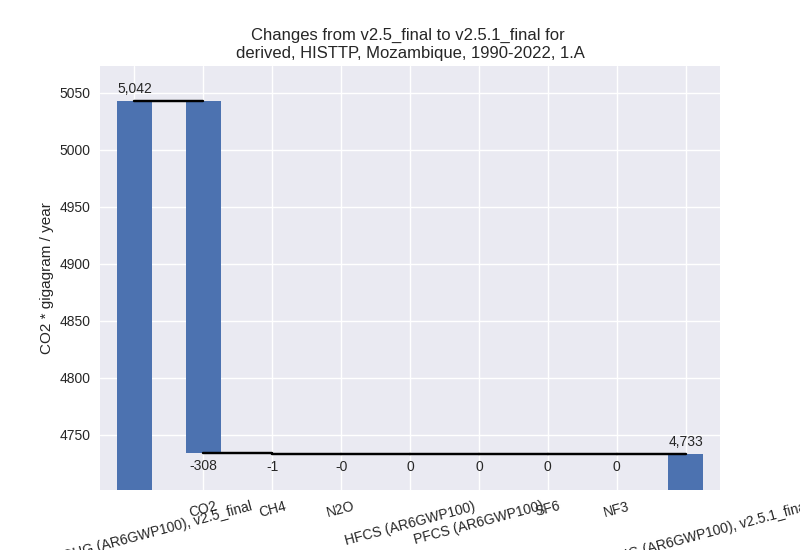
There is no subsector information available in PRIMAP-hist. - 1.B.1: Total sectoral emissions in 2022 are 9697.85
Gg CO2 / year which is 47.8% of category 1 emissions. 2022 Emissions
have changed by -17.6% (-2064.48 Gg
CO2 / year). 1990-2022 Emissions have changed by -0.3% (-10.90 Gg CO2 / year). For 2022 the
changes per gas
are:

There is no subsector information available in PRIMAP-hist. - 1.B.2: Total sectoral emissions in 2022 are 2552.75
Gg CO2 / year which is 12.6% of category 1 emissions. 2022 Emissions
have changed by 97.6% (1260.57 Gg
CO2 / year). 1990-2022 Emissions have changed by 9.2% (69.65 Gg CO2 / year). For 2022 the
changes per gas
are:

For 1990-2022 the changes per gas are:
There is no subsector information available in PRIMAP-hist.
- 1.A: Total sectoral emissions in 2022 are 8021.85
Gg CO2 / year which is 39.6% of category 1 emissions. 2022 Emissions
have changed by -21.4% (-2179.22 Gg
CO2 / year). 1990-2022 Emissions have changed by -6.1% (-309.69 Gg CO2 / year). For 2022
the changes per gas
are:
- 2: Total sectoral emissions in 2022 are 2805.15 Gg CO2 / year which is 5.9% of M.0.EL emissions. 2022 Emissions have changed by -0.4% (-10.37 Gg CO2 / year). 1990-2022 Emissions have changed by -1.8% (-25.26 Gg CO2 / year).
- M.AG: Total sectoral emissions in 2022 are 18872.79
Gg CO2 / year which is 39.6% of M.0.EL emissions. 2022 Emissions have
changed by 3.3% (596.51 Gg CO2 /
year). 1990-2022 Emissions have changed by -0.2% (-40.73 Gg CO2 / year). For 2022 the
changes per gas
are:

The changes come from the following subsectors:- 3.A: Total sectoral emissions in 2022 are 3521.09
Gg CO2 / year which is 18.7% of category M.AG emissions. 2022 Emissions
have changed by 3.2% (108.97 Gg CO2
/ year). 1990-2022 Emissions have changed by 2.8% (65.61 Gg CO2 / year). For 2022 the
changes per gas
are:

For 1990-2022 the changes per gas are:
There is no subsector information available in PRIMAP-hist. - M.AG.ELV: Total sectoral emissions in 2022 are
15351.71 Gg CO2 / year which is 81.3% of category M.AG emissions. 2022
Emissions have changed by 3.3%
(487.54 Gg CO2 / year). 1990-2022 Emissions have changed by -0.7% (-106.34 Gg CO2 / year). For 2022
the changes per gas
are:

There is no subsector information available in PRIMAP-hist.
- 3.A: Total sectoral emissions in 2022 are 3521.09
Gg CO2 / year which is 18.7% of category M.AG emissions. 2022 Emissions
have changed by 3.2% (108.97 Gg CO2
/ year). 1990-2022 Emissions have changed by 2.8% (65.61 Gg CO2 / year). For 2022 the
changes per gas
are:
- 4: Total sectoral emissions in 2022 are 5485.08 Gg CO2 / year which is 11.5% of M.0.EL emissions. 2022 Emissions have changed by 0.4% (23.47 Gg CO2 / year). 1990-2022 Emissions have changed by 0.0% (0.71 Gg CO2 / year).
- 5: Total sectoral emissions in 2022 are 278.20 Gg
CO2 / year which is 0.6% of M.0.EL emissions. 2022 Emissions have
changed by 6.8% (17.60 Gg CO2 /
year). 1990-2022 Emissions have changed by 0.3% (0.53 Gg CO2 / year). For 2022 the
changes per gas
are:
