Changes in PRIMAP-hist v2.5.1_final compared to v2.5_final for Malawi
2024-02-29
Johannes Gütschow
Change analysis for Malawi for PRIMAP-hist v2.5.1_final compared to v2.5_final
Overview over emissions by sector and gas
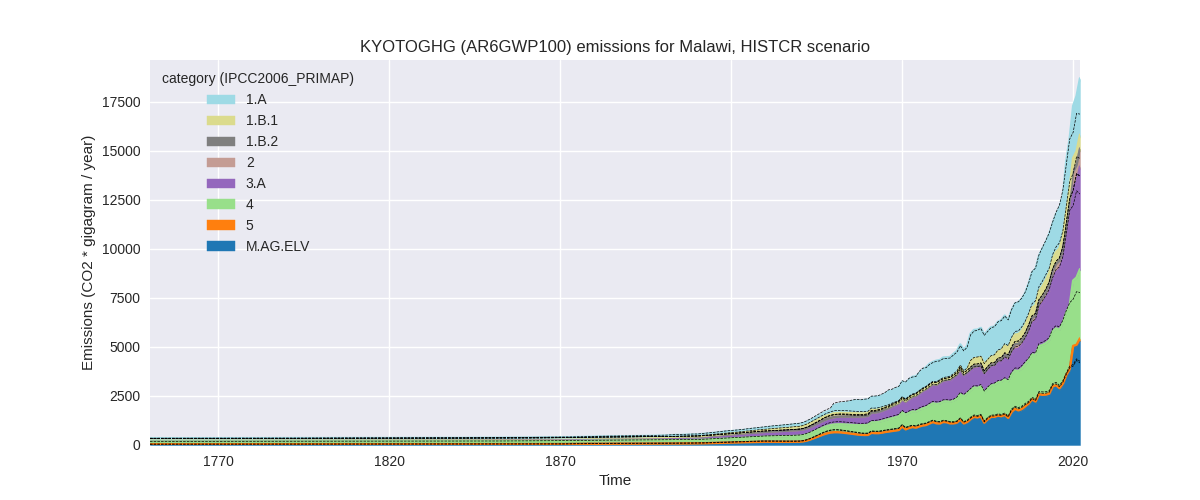
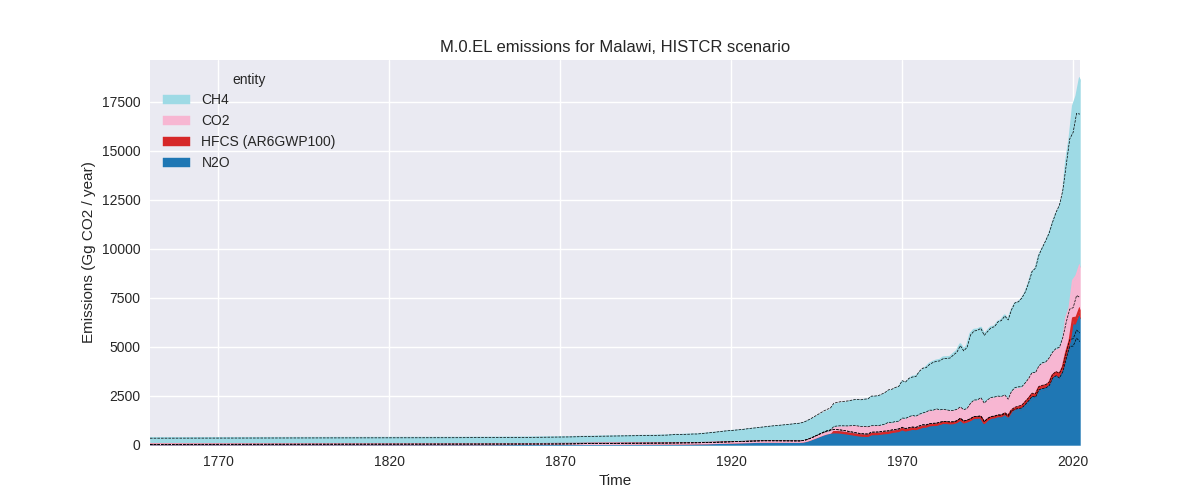
The following figures show the aggregate national total emissions excluding LULUCF AR6GWP100 for the country reported priority scenario. The dotted linesshow the v2.5_final data.
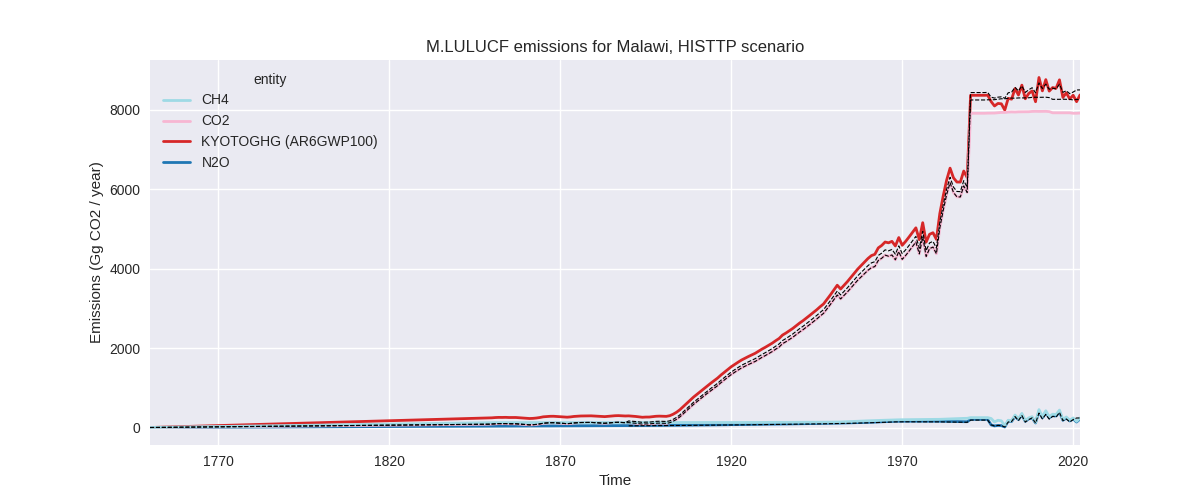
The following figures show the aggregate national total emissions excluding LULUCF AR6GWP100 for the third party priority scenario. The dotted linesshow the v2.5_final data.


Overview over changes
In the country reported priority scenario we have the following changes for aggregate Kyoto GHG and national total emissions excluding LULUCF (M.0.EL):
- Emissions in 2022 have changed by 10.8%% (1825.26 Gg CO2 / year)
- Emissions in 1990-2022 have changed by 1.1%% (102.62 Gg CO2 / year)
In the third party priority scenario we have the following changes for aggregate Kyoto GHG and national total emissions excluding LULUCF (M.0.EL):
- Emissions in 2022 have changed by 10.8%% (1825.26 Gg CO2 / year)
- Emissions in 1990-2022 have changed by 1.1%% (102.62 Gg CO2 / year)
Most important changes per scenario and time frame
In the country reported priority scenario the following sector-gas combinations have the highest absolute impact on national total KyotoGHG (AR6GWP100) emissions in 2022 (top 5):
- 1: M.AG.ELV, N2O with 1262.90 Gg CO2 / year (34.1%)
- 2: 1.A, CO2 with 446.77 Gg CO2 / year (32.2%)
- 3: 3.A, CH4 with 252.77 Gg CO2 / year (6.3%)
- 4: 1.B.1, CH4 with -193.16 Gg CO2 / year (-21.8%)
- 5: 1.A, CH4 with 134.72 Gg CO2 / year (17.6%)
In the country reported priority scenario the following sector-gas combinations have the highest absolute impact on national total KyotoGHG (AR6GWP100) emissions in 1990-2022 (top 5):
- 1: 1.A, CH4 with 123.73 Gg CO2 / year (21.1%)
- 2: 1.B.1, CH4 with -61.93 Gg CO2 / year (-10.8%)
- 3: 1.A, CO2 with 46.15 Gg CO2 / year (4.8%)
- 4: M.AG.ELV, CO2 with -36.57 Gg CO2 / year (-100.0%)
- 5: 1.A, N2O with 22.70 Gg CO2 / year (25.8%)
In the third party priority scenario the following sector-gas combinations have the highest absolute impact on national total KyotoGHG (AR6GWP100) emissions in 2022 (top 5):
- 1: M.AG.ELV, N2O with 1262.90 Gg CO2 / year (34.1%)
- 2: 1.A, CO2 with 446.77 Gg CO2 / year (32.2%)
- 3: 3.A, CH4 with 252.77 Gg CO2 / year (6.3%)
- 4: 1.B.1, CH4 with -193.16 Gg CO2 / year (-21.8%)
- 5: 1.A, CH4 with 134.72 Gg CO2 / year (17.6%)
In the third party priority scenario the following sector-gas combinations have the highest absolute impact on national total KyotoGHG (AR6GWP100) emissions in 1990-2022 (top 5):
- 1: 1.A, CH4 with 123.73 Gg CO2 / year (21.1%)
- 2: 1.B.1, CH4 with -61.93 Gg CO2 / year (-10.8%)
- 3: 1.A, CO2 with 46.15 Gg CO2 / year (4.8%)
- 4: M.AG.ELV, CO2 with -36.57 Gg CO2 / year (-100.0%)
- 5: 1.A, N2O with 22.70 Gg CO2 / year (25.8%)
Notes on data changes
Here we list notes explaining important emissions changes for the country. ’' means that the following text only applies to the TP time series, while means that it only applies to the CR scenario. Otherwise the note applies to both scenarios.
General note: We have no country reported data for Malawi, thus CR and TP time-series are identical except for LULUCF.
- M.AG.ELV, N2O: 2020 emissions are much higher in FAO 2023 than in FAO 2022 which was used in PRIMAP-hist v2.5 leading to higher emissions starting in 2020 in v2.5.1.
- 1.A, CO2: 2017 emissions in CDIAC 2023 are lower than in CDIAC 2020. 2018 emissions are much higher than 2017 leading to an overall increase in emissions in the latest years.
- 1.A, CH4: Emissions in EDGAR 8.0 are higher than in EDGAR 7.0 which was used in PRIMAP-hist v2.5. Thus cumulative and 2022 emissions in PRIMAP-hist v2.5.1 are higher.
- 1.B.1, CH4: Emissions in EDGAR 8.0 are lower than in EDGAR 7.0 after 2000. Cumulative and 2022 emissions in PRIMAP-hist v2.5.1 are lower.
- 3.A, CH4: 2022 emissions have changed due to new FAO and EDGAR
Changes by sector and gas
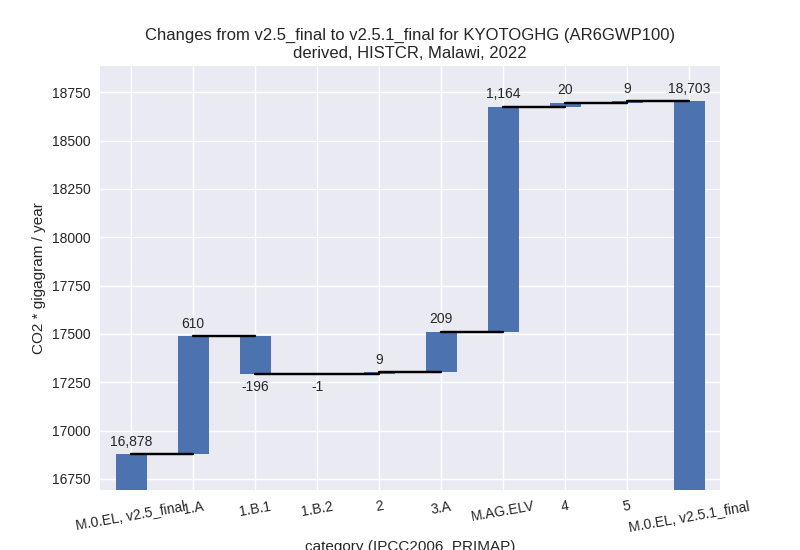
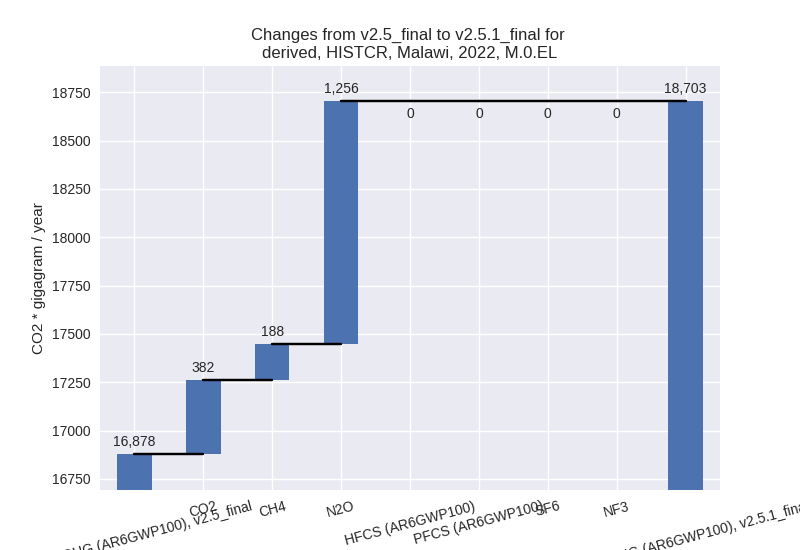
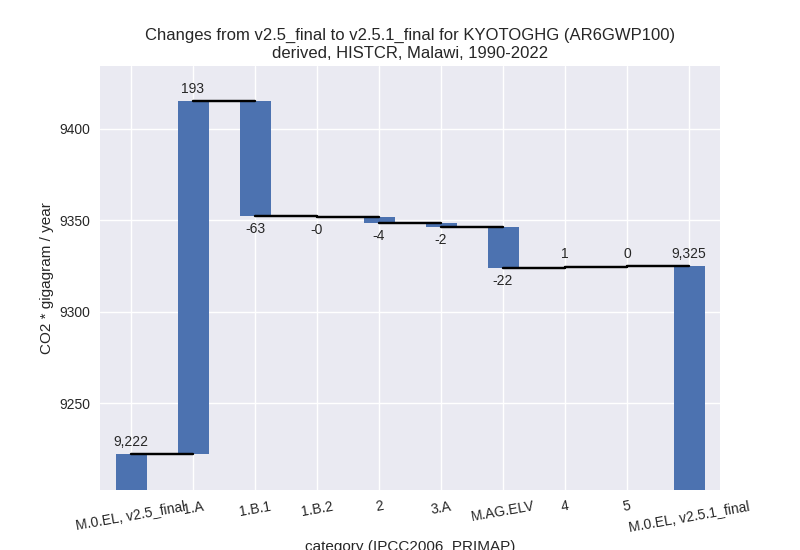
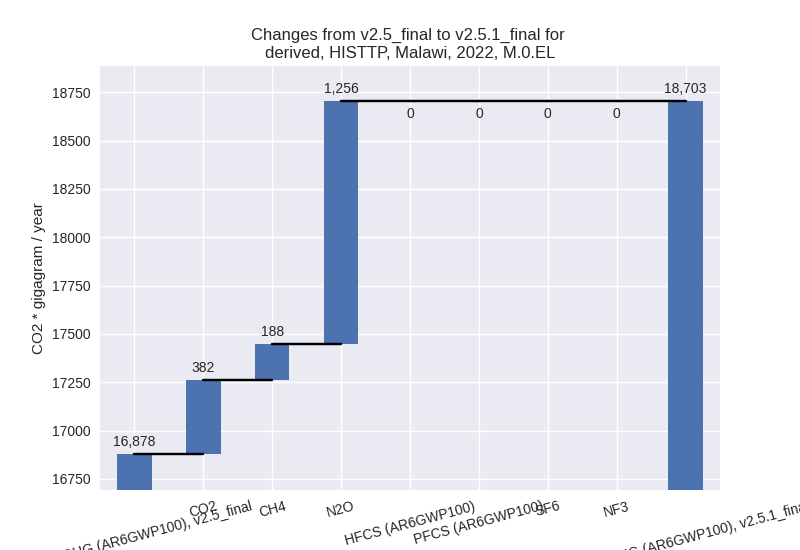
For each scenario and time frame the changes are displayed for all individual sectors and all individual gases. In the sector plot we use aggregate Kyoto GHGs in AR6GWP100. In the gas plot we usenational total emissions without LULUCF. ## country reported scenario
2022
1990-2022

third party scenario
2022

1990-2022


Detailed changes for the scenarios:
country reported scenario (HISTCR):
Most important changes per time frame
For 2022 the following sector-gas combinations have the highest absolute impact on national total KyotoGHG (AR6GWP100) emissions in 2022 (top 5):
- 1: M.AG.ELV, N2O with 1262.90 Gg CO2 / year (34.1%)
- 2: 1.A, CO2 with 446.77 Gg CO2 / year (32.2%)
- 3: 3.A, CH4 with 252.77 Gg CO2 / year (6.3%)
- 4: 1.B.1, CH4 with -193.16 Gg CO2 / year (-21.8%)
- 5: 1.A, CH4 with 134.72 Gg CO2 / year (17.6%)
For 1990-2022 the following sector-gas combinations have the highest absolute impact on national total KyotoGHG (AR6GWP100) emissions in 1990-2022 (top 5):
- 1: 1.A, CH4 with 123.73 Gg CO2 / year (21.1%)
- 2: 1.B.1, CH4 with -61.93 Gg CO2 / year (-10.8%)
- 3: 1.A, CO2 with 46.15 Gg CO2 / year (4.8%)
- 4: M.AG.ELV, CO2 with -36.57 Gg CO2 / year (-100.0%)
- 5: 1.A, N2O with 22.70 Gg CO2 / year (25.8%)
Changes in the main sectors for aggregate KyotoGHG (AR6GWP100) are
- 1: Total sectoral emissions in 2022 are 3581.53 Gg
CO2 / year which is 19.1% of M.0.EL emissions. 2022 Emissions have
changed by 13.0% (413.41 Gg CO2 /
year). 1990-2022 Emissions have changed by 5.8% (129.54 Gg CO2 / year). For 2022 the
changes per gas
are:

For 1990-2022 the changes per gas are: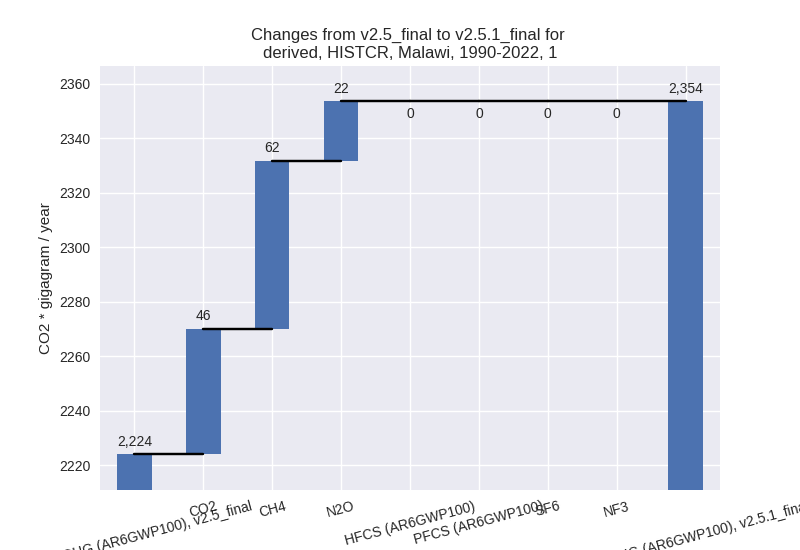
The changes come from the following subsectors:- 1.A: Total sectoral emissions in 2022 are 2878.78
Gg CO2 / year which is 80.4% of category 1 emissions. 2022 Emissions
have changed by 26.9% (609.86 Gg CO2
/ year). 1990-2022 Emissions have changed by 11.7% (192.58 Gg CO2 / year). For 2022 the
changes per gas
are:

For 1990-2022 the changes per gas are: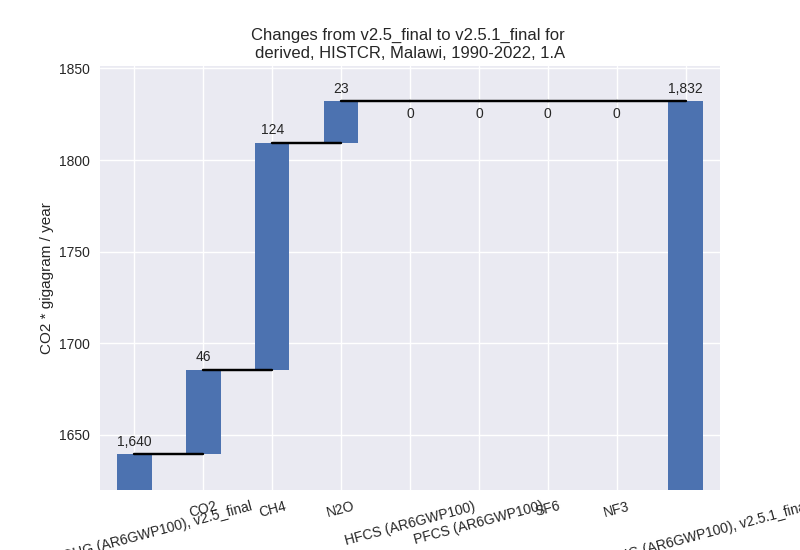
There is no subsector information available in PRIMAP-hist. - 1.B.1: Total sectoral emissions in 2022 are 702.67
Gg CO2 / year which is 19.6% of category 1 emissions. 2022 Emissions
have changed by -21.8% (-195.74 Gg
CO2 / year). 1990-2022 Emissions have changed by -10.8% (-62.82 Gg CO2 / year). For 2022
the changes per gas
are:

For 1990-2022 the changes per gas are:
There is no subsector information available in PRIMAP-hist. - 1.B.2: Total sectoral emissions in 2022 are 0.08 Gg
CO2 / year which is 0.0% of category 1 emissions. 2022 Emissions have
changed by -89.5% (-0.71 Gg CO2 /
year). 1990-2022 Emissions have changed by -27.1% (-0.22 Gg CO2 / year). For 2022 the
changes per gas
are:

For 1990-2022 the changes per gas are:
There is no subsector information available in PRIMAP-hist.
- 1.A: Total sectoral emissions in 2022 are 2878.78
Gg CO2 / year which is 80.4% of category 1 emissions. 2022 Emissions
have changed by 26.9% (609.86 Gg CO2
/ year). 1990-2022 Emissions have changed by 11.7% (192.58 Gg CO2 / year). For 2022 the
changes per gas
are:
- 2: Total sectoral emissions in 2022 are 918.58 Gg CO2 / year which is 4.9% of M.0.EL emissions. 2022 Emissions have changed by 1.0% (9.43 Gg CO2 / year). 1990-2022 Emissions have changed by -1.1% (-3.59 Gg CO2 / year).
- M.AG: Total sectoral emissions in 2022 are 10581.86
Gg CO2 / year which is 56.6% of M.0.EL emissions. 2022 Emissions have
changed by 14.9% (1373.89 Gg CO2 /
year). 1990-2022 Emissions have changed by -0.6% (-24.20 Gg CO2 / year). For 2022 the
changes per gas
are:

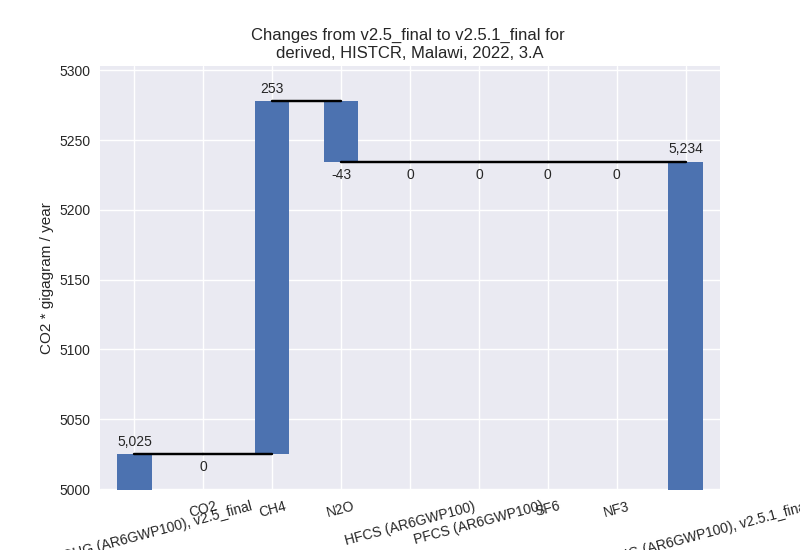
The changes come from the following subsectors:- 3.A: Total sectoral emissions in 2022 are 5234.35
Gg CO2 / year which is 49.5% of category M.AG emissions. 2022 Emissions
have changed by 4.2% (209.39 Gg CO2
/ year). 1990-2022 Emissions have changed by -0.1% (-2.22 Gg CO2 / year). For 2022 the
changes per gas
are:
There is no subsector information available in PRIMAP-hist. - M.AG.ELV: Total sectoral emissions in 2022 are
5347.51 Gg CO2 / year which is 50.5% of category M.AG emissions. 2022
Emissions have changed by 27.8%
(1164.50 Gg CO2 / year). 1990-2022 Emissions have changed by -0.9% (-21.98 Gg CO2 / year). For 2022 the
changes per gas
are:

There is no subsector information available in PRIMAP-hist.
- 3.A: Total sectoral emissions in 2022 are 5234.35
Gg CO2 / year which is 49.5% of category M.AG emissions. 2022 Emissions
have changed by 4.2% (209.39 Gg CO2
/ year). 1990-2022 Emissions have changed by -0.1% (-2.22 Gg CO2 / year). For 2022 the
changes per gas
are:
- 4: Total sectoral emissions in 2022 are 3530.45 Gg CO2 / year which is 18.9% of M.0.EL emissions. 2022 Emissions have changed by 0.6% (19.94 Gg CO2 / year). 1990-2022 Emissions have changed by 0.0% (0.60 Gg CO2 / year).
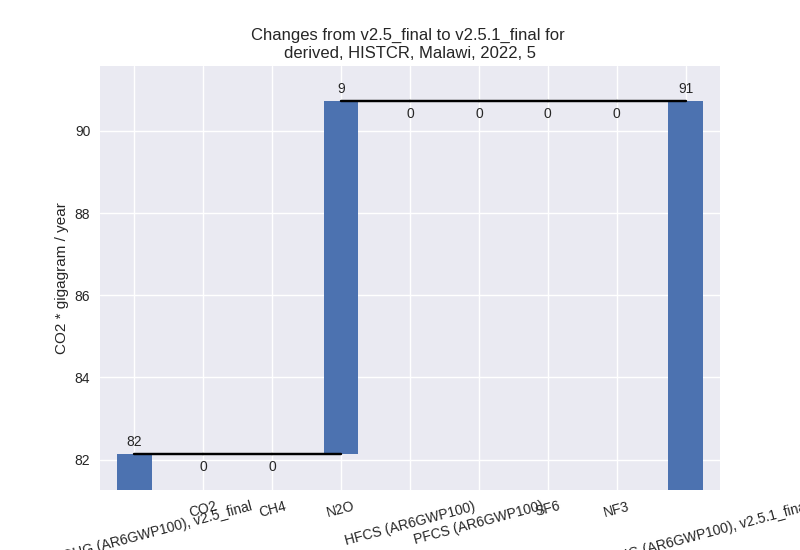
- 5: Total sectoral emissions in 2022 are 90.72 Gg
CO2 / year which is 0.5% of M.0.EL emissions. 2022 Emissions have
changed by 10.5% (8.59 Gg CO2 /
year). 1990-2022 Emissions have changed by 0.4% (0.26 Gg CO2 / year). For 2022 the
changes per gas
are:
third party scenario (HISTTP):
Most important changes per time frame
For 2022 the following sector-gas combinations have the highest absolute impact on national total KyotoGHG (AR6GWP100) emissions in 2022 (top 5):
- 1: M.AG.ELV, N2O with 1262.90 Gg CO2 / year (34.1%)
- 2: 1.A, CO2 with 446.77 Gg CO2 / year (32.2%)
- 3: 3.A, CH4 with 252.77 Gg CO2 / year (6.3%)
- 4: 1.B.1, CH4 with -193.16 Gg CO2 / year (-21.8%)
- 5: 1.A, CH4 with 134.72 Gg CO2 / year (17.6%)
For 1990-2022 the following sector-gas combinations have the highest absolute impact on national total KyotoGHG (AR6GWP100) emissions in 1990-2022 (top 5):
- 1: 1.A, CH4 with 123.73 Gg CO2 / year (21.1%)
- 2: 1.B.1, CH4 with -61.93 Gg CO2 / year (-10.8%)
- 3: 1.A, CO2 with 46.15 Gg CO2 / year (4.8%)
- 4: M.AG.ELV, CO2 with -36.57 Gg CO2 / year (-100.0%)
- 5: 1.A, N2O with 22.70 Gg CO2 / year (25.8%)
Changes in the main sectors for aggregate KyotoGHG (AR6GWP100) are
- 1: Total sectoral emissions in 2022 are 3581.53 Gg
CO2 / year which is 19.1% of M.0.EL emissions. 2022 Emissions have
changed by 13.0% (413.41 Gg CO2 /
year). 1990-2022 Emissions have changed by 5.8% (129.54 Gg CO2 / year). For 2022 the
changes per gas
are:

For 1990-2022 the changes per gas are:
The changes come from the following subsectors:- 1.A: Total sectoral emissions in 2022 are 2878.78
Gg CO2 / year which is 80.4% of category 1 emissions. 2022 Emissions
have changed by 26.9% (609.86 Gg CO2
/ year). 1990-2022 Emissions have changed by 11.7% (192.58 Gg CO2 / year). For 2022 the
changes per gas
are:

For 1990-2022 the changes per gas are:
There is no subsector information available in PRIMAP-hist. - 1.B.1: Total sectoral emissions in 2022 are 702.67
Gg CO2 / year which is 19.6% of category 1 emissions. 2022 Emissions
have changed by -21.8% (-195.74 Gg
CO2 / year). 1990-2022 Emissions have changed by -10.8% (-62.82 Gg CO2 / year). For 2022
the changes per gas
are:
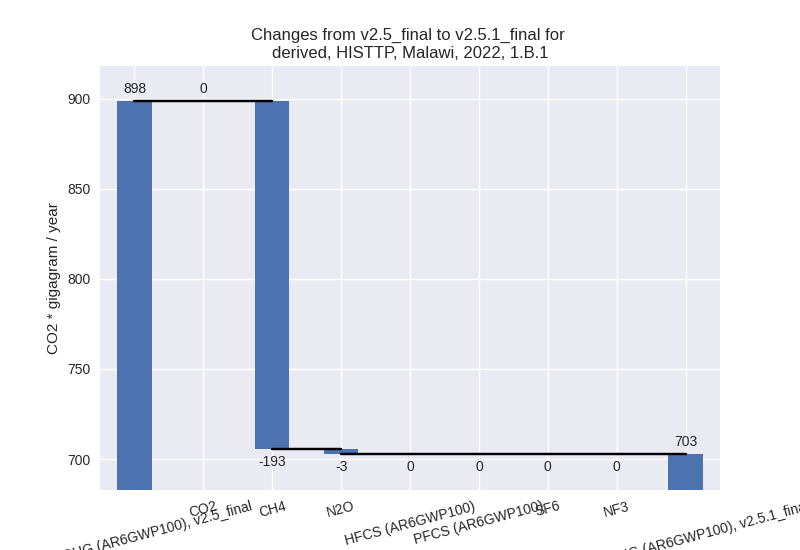
For 1990-2022 the changes per gas are:
There is no subsector information available in PRIMAP-hist. - 1.B.2: Total sectoral emissions in 2022 are 0.08 Gg
CO2 / year which is 0.0% of category 1 emissions. 2022 Emissions have
changed by -89.5% (-0.71 Gg CO2 /
year). 1990-2022 Emissions have changed by -27.1% (-0.22 Gg CO2 / year). For 2022 the
changes per gas
are:
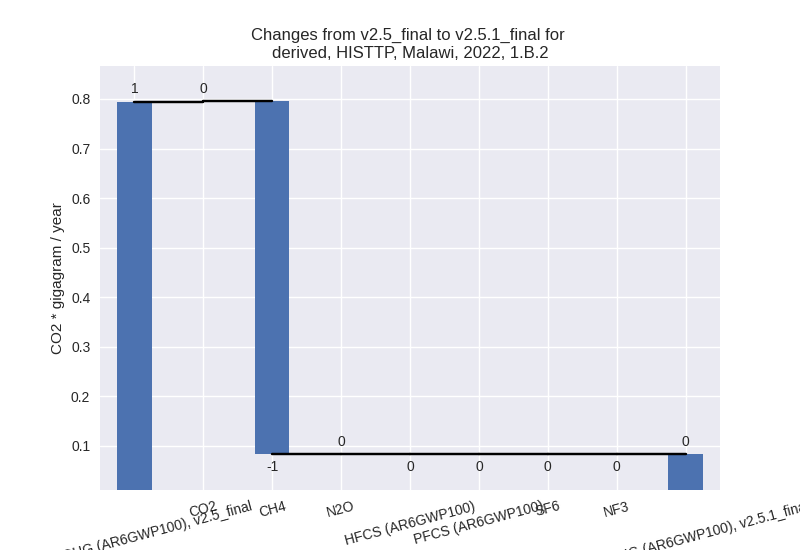
For 1990-2022 the changes per gas are:
There is no subsector information available in PRIMAP-hist.
- 1.A: Total sectoral emissions in 2022 are 2878.78
Gg CO2 / year which is 80.4% of category 1 emissions. 2022 Emissions
have changed by 26.9% (609.86 Gg CO2
/ year). 1990-2022 Emissions have changed by 11.7% (192.58 Gg CO2 / year). For 2022 the
changes per gas
are:
- 2: Total sectoral emissions in 2022 are 918.58 Gg CO2 / year which is 4.9% of M.0.EL emissions. 2022 Emissions have changed by 1.0% (9.43 Gg CO2 / year). 1990-2022 Emissions have changed by -1.1% (-3.59 Gg CO2 / year).
- M.AG: Total sectoral emissions in 2022 are 10581.86
Gg CO2 / year which is 56.6% of M.0.EL emissions. 2022 Emissions have
changed by 14.9% (1373.89 Gg CO2 /
year). 1990-2022 Emissions have changed by -0.6% (-24.20 Gg CO2 / year). For 2022 the
changes per gas
are:

The changes come from the following subsectors:- 3.A: Total sectoral emissions in 2022 are 5234.35
Gg CO2 / year which is 49.5% of category M.AG emissions. 2022 Emissions
have changed by 4.2% (209.39 Gg CO2
/ year). 1990-2022 Emissions have changed by -0.1% (-2.22 Gg CO2 / year). For 2022 the
changes per gas
are:

There is no subsector information available in PRIMAP-hist. - M.AG.ELV: Total sectoral emissions in 2022 are
5347.51 Gg CO2 / year which is 50.5% of category M.AG emissions. 2022
Emissions have changed by 27.8%
(1164.50 Gg CO2 / year). 1990-2022 Emissions have changed by -0.9% (-21.98 Gg CO2 / year). For 2022 the
changes per gas
are:
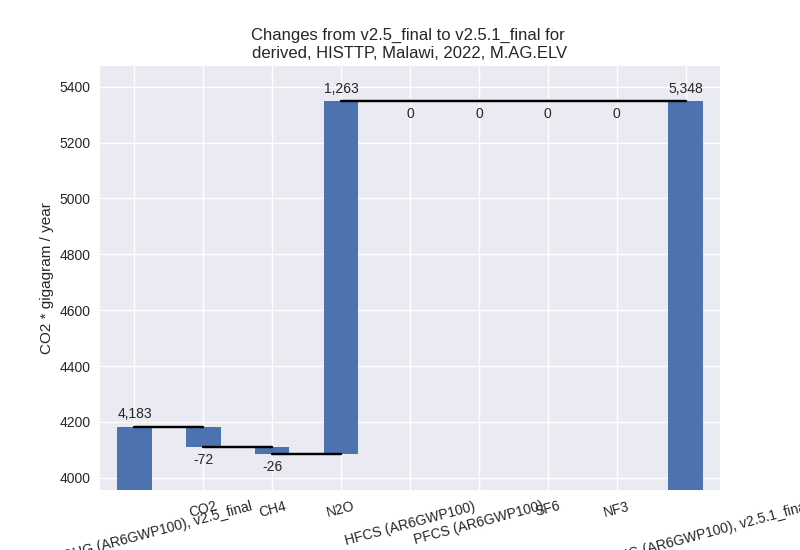
There is no subsector information available in PRIMAP-hist.
- 3.A: Total sectoral emissions in 2022 are 5234.35
Gg CO2 / year which is 49.5% of category M.AG emissions. 2022 Emissions
have changed by 4.2% (209.39 Gg CO2
/ year). 1990-2022 Emissions have changed by -0.1% (-2.22 Gg CO2 / year). For 2022 the
changes per gas
are:
- 4: Total sectoral emissions in 2022 are 3530.45 Gg CO2 / year which is 18.9% of M.0.EL emissions. 2022 Emissions have changed by 0.6% (19.94 Gg CO2 / year). 1990-2022 Emissions have changed by 0.0% (0.60 Gg CO2 / year).
- 5: Total sectoral emissions in 2022 are 90.72 Gg
CO2 / year which is 0.5% of M.0.EL emissions. 2022 Emissions have
changed by 10.5% (8.59 Gg CO2 /
year). 1990-2022 Emissions have changed by 0.4% (0.26 Gg CO2 / year). For 2022 the
changes per gas
are:
