Changes in PRIMAP-hist v2.5.1_final compared to v2.5_final for Niger
2024-02-29
Johannes Gütschow
Change analysis for Niger for PRIMAP-hist v2.5.1_final compared to v2.5_final
Overview over emissions by sector and gas
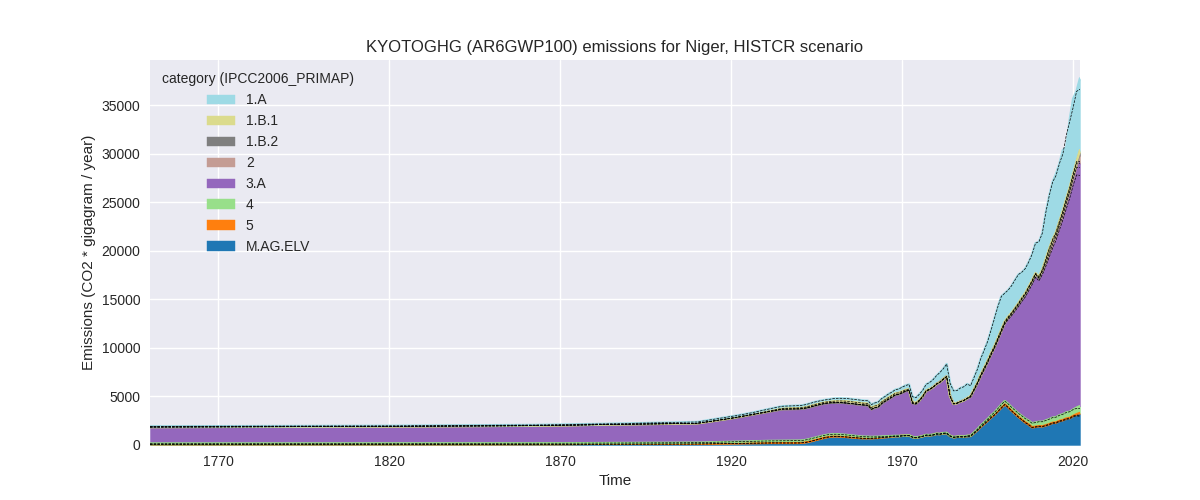
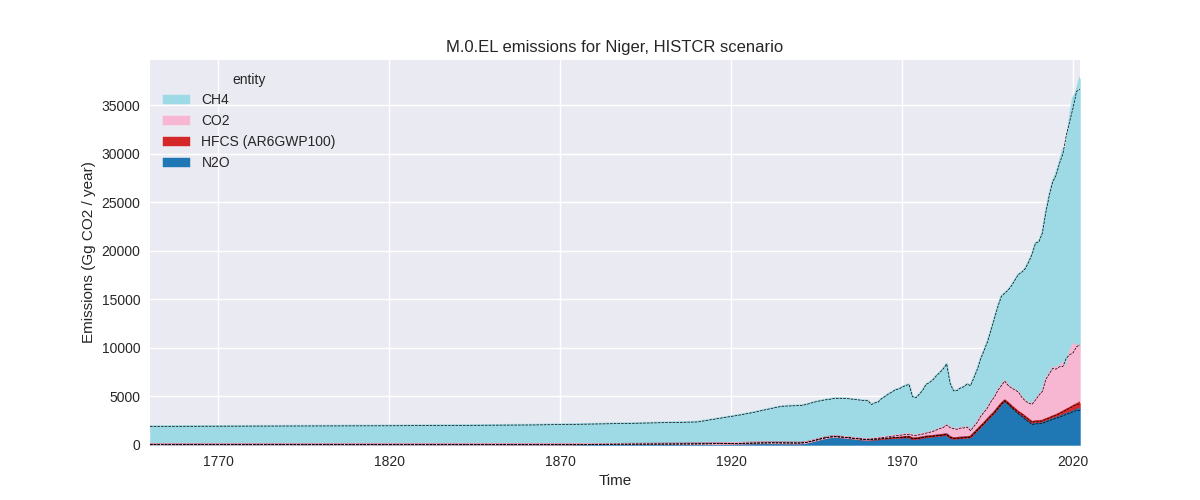
The following figures show the aggregate national total emissions excluding LULUCF AR6GWP100 for the country reported priority scenario. The dotted linesshow the v2.5_final data.
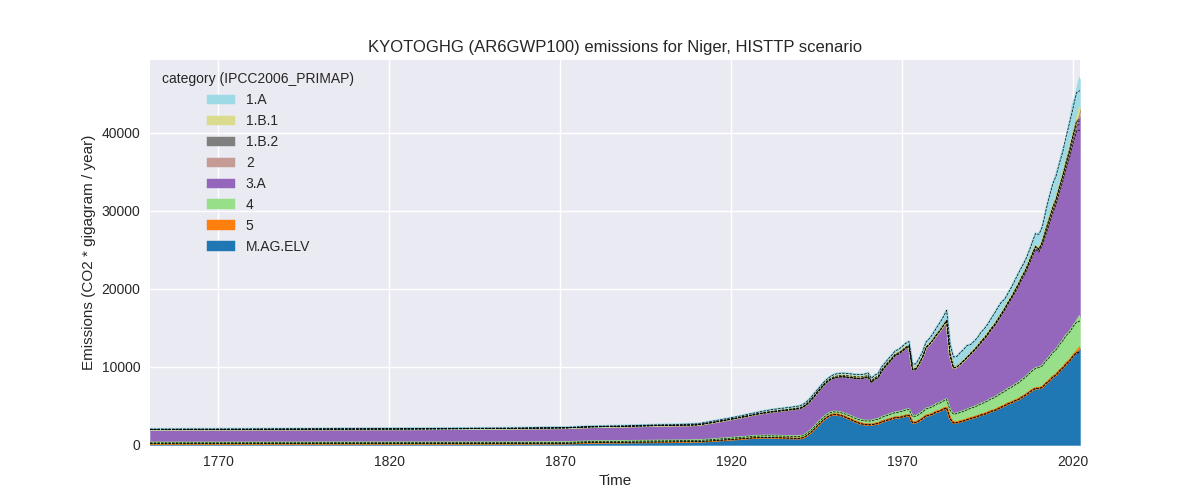
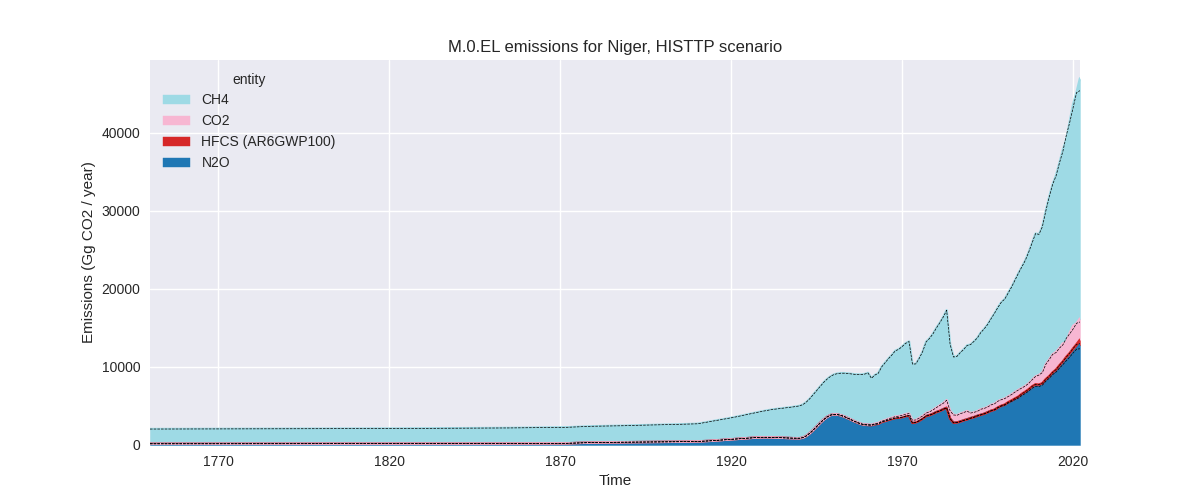
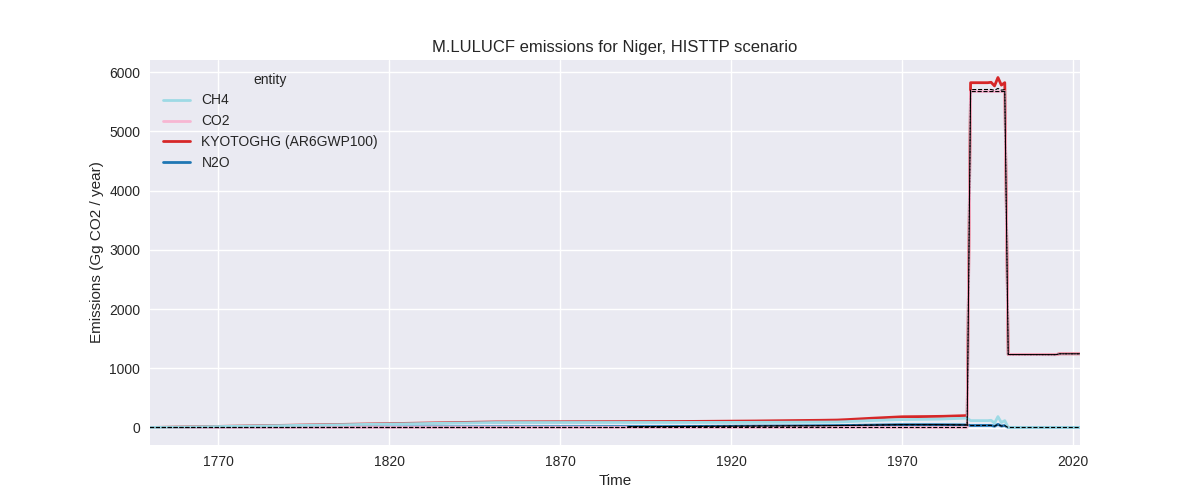
The following figures show the aggregate national total emissions excluding LULUCF AR6GWP100 for the third party priority scenario. The dotted linesshow the v2.5_final data.
Overview over changes
In the country reported priority scenario we have the following changes for aggregate Kyoto GHG and national total emissions excluding LULUCF (M.0.EL):
- Emissions in 2022 have changed by 3.1%% (1121.07 Gg CO2 / year)
- Emissions in 1990-2022 have changed by 0.2%% (41.43 Gg CO2 / year)
In the third party priority scenario we have the following changes for aggregate Kyoto GHG and national total emissions excluding LULUCF (M.0.EL):
- Emissions in 2022 have changed by 3.5%% (1575.69 Gg CO2 / year)
- Emissions in 1990-2022 have changed by 0.2%% (52.31 Gg CO2 / year)
Most important changes per scenario and time frame
In the country reported priority scenario the following sector-gas combinations have the highest absolute impact on national total KyotoGHG (AR6GWP100) emissions in 2022 (top 5):
- 1: 3.A, CH4 with 1085.88 Gg CO2 / year (4.5%)
- 2: M.AG.ELV, N2O with 172.47 Gg CO2 / year (6.3%)
- 3: 1.B.2, CH4 with -144.52 Gg CO2 / year (-44.1%)
- 4: 1.A, CO2 with -97.21 Gg CO2 / year (-1.7%)
- 5: M.AG.ELV, CH4 with 96.80 Gg CO2 / year (41.7%)
In the country reported priority scenario the following sector-gas combinations have the highest absolute impact on national total KyotoGHG (AR6GWP100) emissions in 1990-2022 (top 5):
- 1: 3.A, CH4 with 34.97 Gg CO2 / year (0.3%)
- 2: 1.B.2, CH4 with -11.42 Gg CO2 / year (-15.3%)
- 3: 1.A, CH4 with 7.76 Gg CO2 / year (0.8%)
- 4: M.AG.ELV, N2O with 5.50 Gg CO2 / year (0.2%)
- 5: M.AG.ELV, CH4 with 3.92 Gg CO2 / year (2.7%)
In the third party priority scenario the following sector-gas combinations have the highest absolute impact on national total KyotoGHG (AR6GWP100) emissions in 2022 (top 5):
- 1: 3.A, CH4 with 1145.85 Gg CO2 / year (4.7%)
- 2: M.AG.ELV, N2O with 520.50 Gg CO2 / year (4.5%)
- 3: 1.B.2, CH4 with -144.52 Gg CO2 / year (-44.1%)
- 4: M.AG.ELV, CH4 with 84.44 Gg CO2 / year (45.7%)
- 5: 1.B.2, CO2 with -45.37 Gg CO2 / year (-37.6%)
In the third party priority scenario the following sector-gas combinations have the highest absolute impact on national total KyotoGHG (AR6GWP100) emissions in 1990-2022 (top 5):
- 1: 3.A, CH4 with 36.83 Gg CO2 / year (0.3%)
- 2: M.AG.ELV, N2O with 17.68 Gg CO2 / year (0.3%)
- 3: 1.B.2, CH4 with -11.42 Gg CO2 / year (-15.3%)
- 4: M.AG.ELV, CH4 with 4.99 Gg CO2 / year (3.3%)
- 5: 1.A, CH4 with 4.99 Gg CO2 / year (0.8%)
Notes on data changes
No country specific notes present for this changelog.
Changes by sector and gas
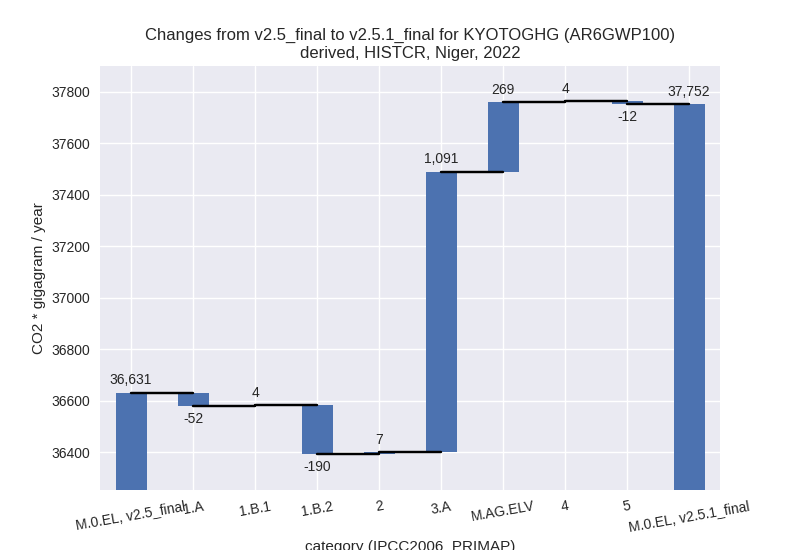
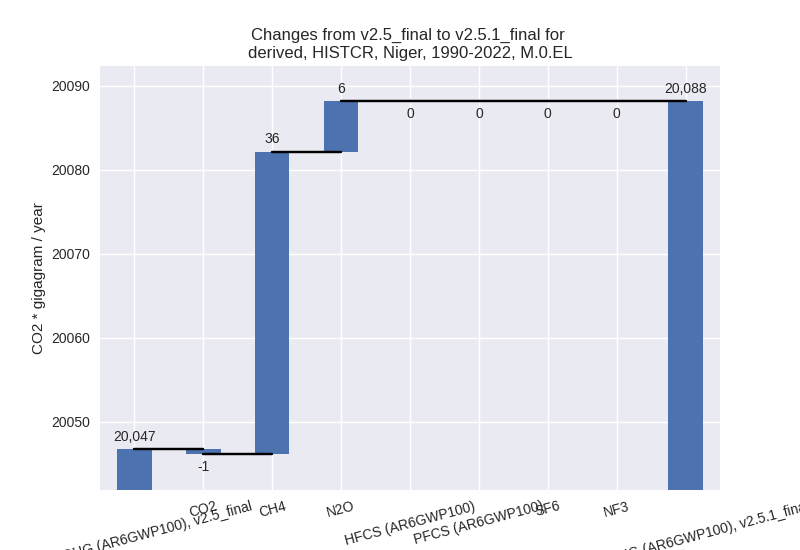
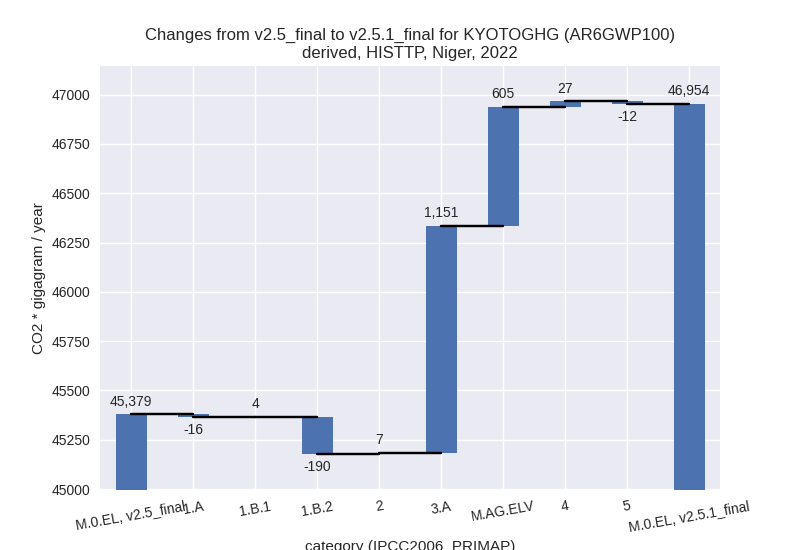
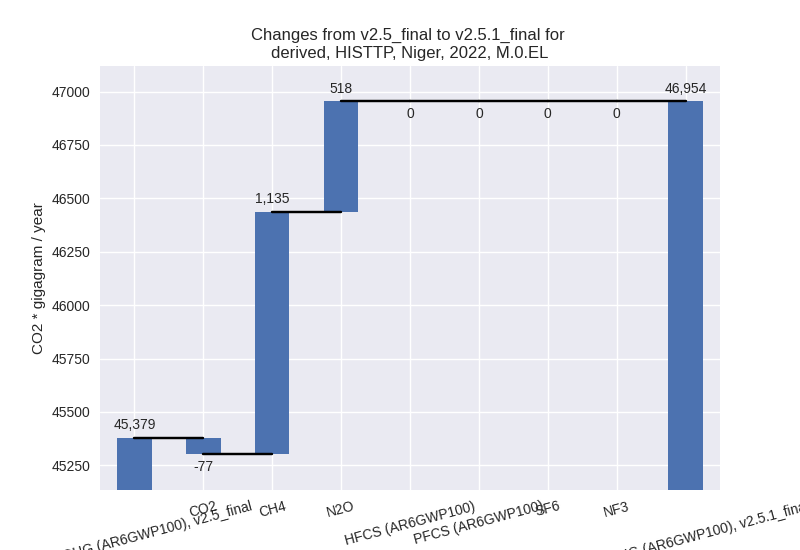
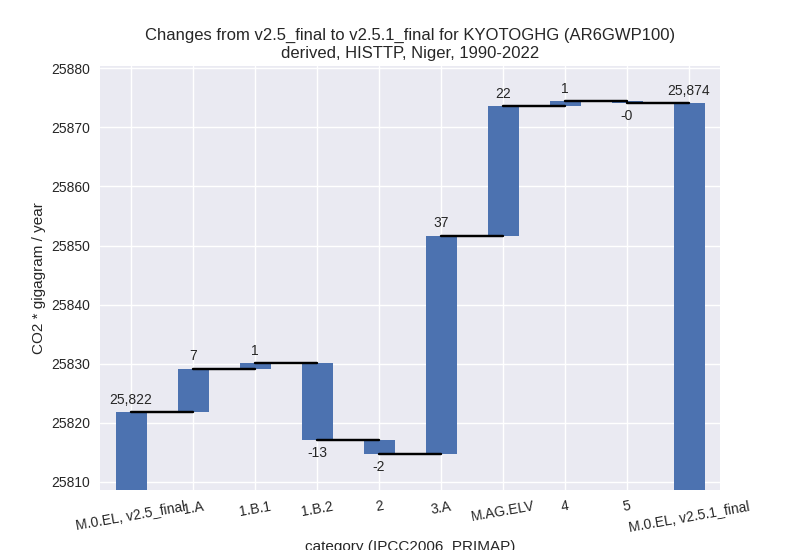
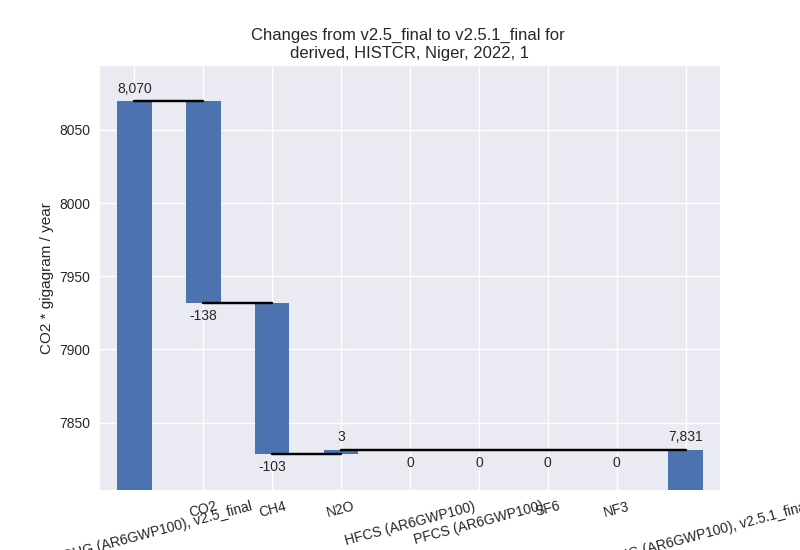
For each scenario and time frame the changes are displayed for all individual sectors and all individual gases. In the sector plot we use aggregate Kyoto GHGs in AR6GWP100. In the gas plot we usenational total emissions without LULUCF. ## country reported scenario
2022

1990-2022

third party scenario
2022
1990-2022

Detailed changes for the scenarios:
country reported scenario (HISTCR):
Most important changes per time frame
For 2022 the following sector-gas combinations have the highest absolute impact on national total KyotoGHG (AR6GWP100) emissions in 2022 (top 5):
- 1: 3.A, CH4 with 1085.88 Gg CO2 / year (4.5%)
- 2: M.AG.ELV, N2O with 172.47 Gg CO2 / year (6.3%)
- 3: 1.B.2, CH4 with -144.52 Gg CO2 / year (-44.1%)
- 4: 1.A, CO2 with -97.21 Gg CO2 / year (-1.7%)
- 5: M.AG.ELV, CH4 with 96.80 Gg CO2 / year (41.7%)
For 1990-2022 the following sector-gas combinations have the highest absolute impact on national total KyotoGHG (AR6GWP100) emissions in 1990-2022 (top 5):
- 1: 3.A, CH4 with 34.97 Gg CO2 / year (0.3%)
- 2: 1.B.2, CH4 with -11.42 Gg CO2 / year (-15.3%)
- 3: 1.A, CH4 with 7.76 Gg CO2 / year (0.8%)
- 4: M.AG.ELV, N2O with 5.50 Gg CO2 / year (0.2%)
- 5: M.AG.ELV, CH4 with 3.92 Gg CO2 / year (2.7%)
Changes in the main sectors for aggregate KyotoGHG (AR6GWP100) are
- 1: Total sectoral emissions in 2022 are 7831.34 Gg
CO2 / year which is 20.7% of M.0.EL emissions. 2022 Emissions have
changed by -3.0% (-238.26 Gg CO2 /
year). 1990-2022 Emissions have changed by 0.0% (0.23 Gg CO2 / year). For 2022 the
changes per gas
are:
The changes come from the following subsectors:- 1.A: Total sectoral emissions in 2022 are 7388.65 Gg CO2 / year which is 94.3% of category 1 emissions. 2022 Emissions have changed by -0.7% (-52.10 Gg CO2 / year). 1990-2022 Emissions have changed by 0.3% (12.30 Gg CO2 / year).
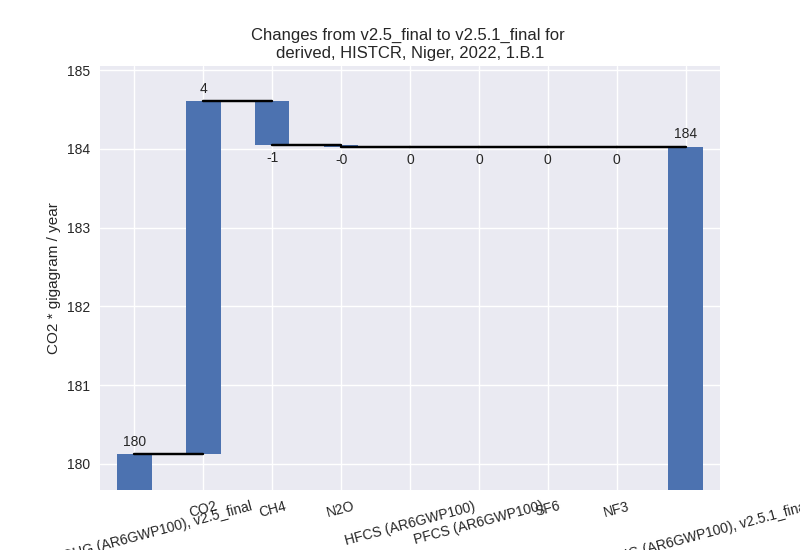
- 1.B.1: Total sectoral emissions in 2022 are 184.03
Gg CO2 / year which is 2.3% of category 1 emissions. 2022 Emissions have
changed by 2.2% (3.90 Gg CO2 /
year). 1990-2022 Emissions have changed by 0.8% (0.94 Gg CO2 / year). For 2022 the
changes per gas
are:
There is no subsector information available in PRIMAP-hist. - 1.B.2: Total sectoral emissions in 2022 are 258.65
Gg CO2 / year which is 3.3% of category 1 emissions. 2022 Emissions have
changed by -42.4% (-190.07 Gg CO2 /
year). 1990-2022 Emissions have changed by -9.4% (-13.01 Gg CO2 / year). For 2022 the
changes per gas
are:

For 1990-2022 the changes per gas are: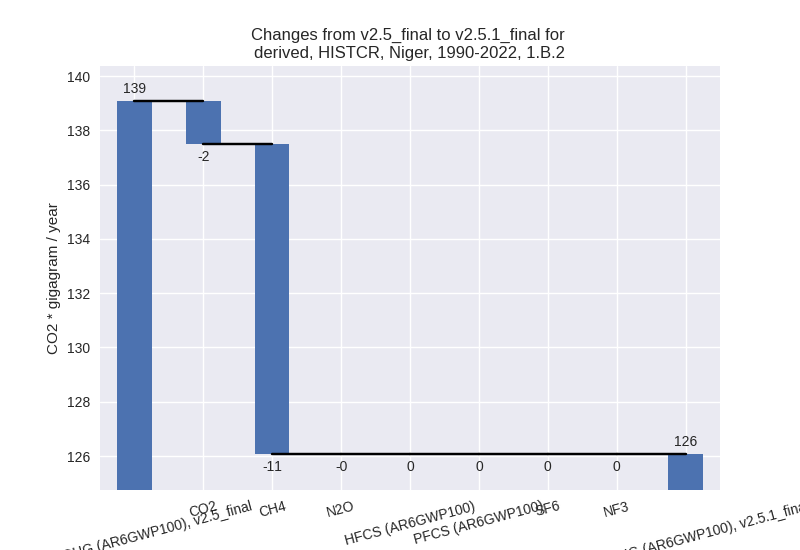
There is no subsector information available in PRIMAP-hist.
- 2: Total sectoral emissions in 2022 are 808.04 Gg CO2 / year which is 2.1% of M.0.EL emissions. 2022 Emissions have changed by 0.9% (7.41 Gg CO2 / year). 1990-2022 Emissions have changed by -0.8% (-2.39 Gg CO2 / year).
- M.AG: Total sectoral emissions in 2022 are 28327.82
Gg CO2 / year which is 75.0% of M.0.EL emissions. 2022 Emissions have
changed by 5.0% (1359.58 Gg CO2 /
year). 1990-2022 Emissions have changed by 0.3% (43.82 Gg CO2 / year). For 2022 the
changes per gas
are:

The changes come from the following subsectors:- 3.A: Total sectoral emissions in 2022 are 25107.25
Gg CO2 / year which is 88.6% of category M.AG emissions. 2022 Emissions
have changed by 4.5% (1090.67 Gg CO2
/ year). 1990-2022 Emissions have changed by 0.3% (35.10 Gg CO2 / year). For 2022 the
changes per gas
are:

There is no subsector information available in PRIMAP-hist. - M.AG.ELV: Total sectoral emissions in 2022 are
3220.57 Gg CO2 / year which is 11.4% of category M.AG emissions. 2022
Emissions have changed by 9.1%
(268.91 Gg CO2 / year). 1990-2022 Emissions have changed by 0.3% (8.72 Gg CO2 / year). For 2022 the
changes per gas
are:
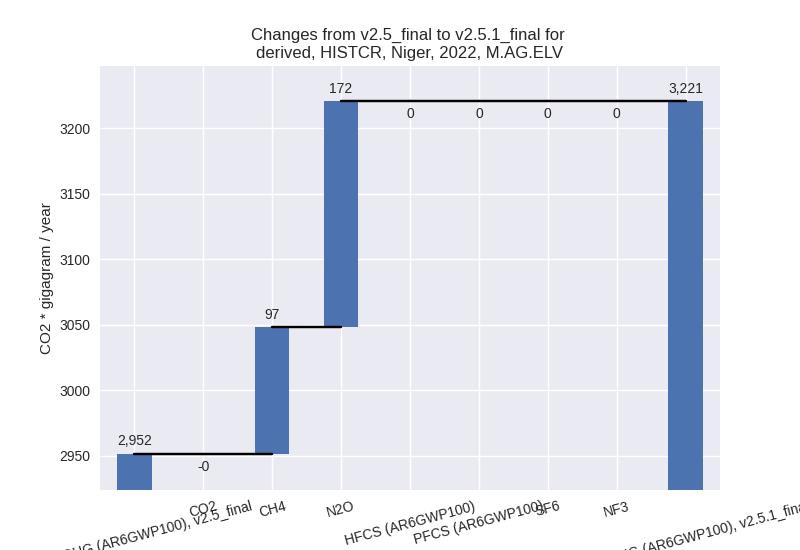
There is no subsector information available in PRIMAP-hist.
- 3.A: Total sectoral emissions in 2022 are 25107.25
Gg CO2 / year which is 88.6% of category M.AG emissions. 2022 Emissions
have changed by 4.5% (1090.67 Gg CO2
/ year). 1990-2022 Emissions have changed by 0.3% (35.10 Gg CO2 / year). For 2022 the
changes per gas
are:
- 4: Total sectoral emissions in 2022 are 703.18 Gg CO2 / year which is 1.9% of M.0.EL emissions. 2022 Emissions have changed by 0.6% (4.11 Gg CO2 / year). 1990-2022 Emissions have changed by 0.0% (0.12 Gg CO2 / year).
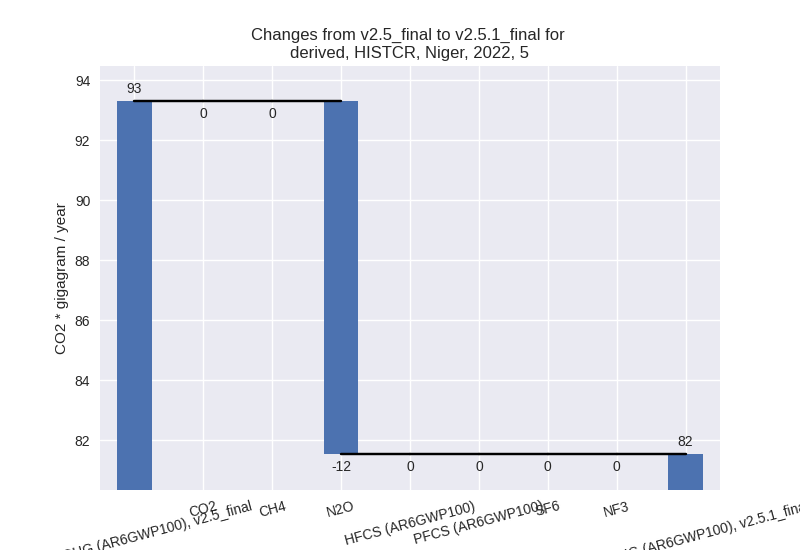
- 5: Total sectoral emissions in 2022 are 81.53 Gg
CO2 / year which is 0.2% of M.0.EL emissions. 2022 Emissions have
changed by -12.6% (-11.76 Gg CO2 /
year). 1990-2022 Emissions have changed by -0.6% (-0.36 Gg CO2 / year). For 2022 the
changes per gas
are:
third party scenario (HISTTP):
Most important changes per time frame
For 2022 the following sector-gas combinations have the highest absolute impact on national total KyotoGHG (AR6GWP100) emissions in 2022 (top 5):
- 1: 3.A, CH4 with 1145.85 Gg CO2 / year (4.7%)
- 2: M.AG.ELV, N2O with 520.50 Gg CO2 / year (4.5%)
- 3: 1.B.2, CH4 with -144.52 Gg CO2 / year (-44.1%)
- 4: M.AG.ELV, CH4 with 84.44 Gg CO2 / year (45.7%)
- 5: 1.B.2, CO2 with -45.37 Gg CO2 / year (-37.6%)
For 1990-2022 the following sector-gas combinations have the highest absolute impact on national total KyotoGHG (AR6GWP100) emissions in 1990-2022 (top 5):
- 1: 3.A, CH4 with 36.83 Gg CO2 / year (0.3%)
- 2: M.AG.ELV, N2O with 17.68 Gg CO2 / year (0.3%)
- 3: 1.B.2, CH4 with -11.42 Gg CO2 / year (-15.3%)
- 4: M.AG.ELV, CH4 with 4.99 Gg CO2 / year (3.3%)
- 5: 1.A, CH4 with 4.99 Gg CO2 / year (0.8%)
Changes in the main sectors for aggregate KyotoGHG (AR6GWP100) are
- 1: Total sectoral emissions in 2022 are 4118.03 Gg
CO2 / year which is 8.8% of M.0.EL emissions. 2022 Emissions have
changed by -4.7% (-202.06 Gg CO2 /
year). 1990-2022 Emissions have changed by -0.2% (-4.69 Gg CO2 / year). For 2022 the
changes per gas
are:
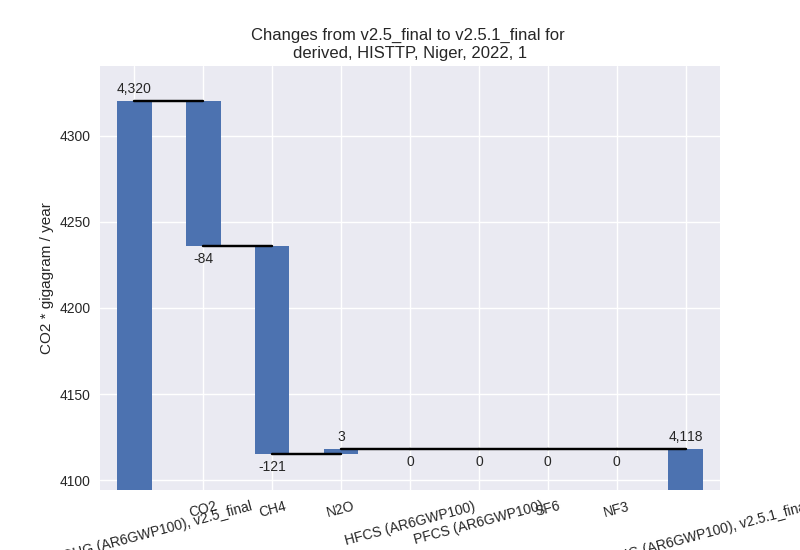
The changes come from the following subsectors:- 1.A: Total sectoral emissions in 2022 are 3675.35 Gg CO2 / year which is 89.3% of category 1 emissions. 2022 Emissions have changed by -0.4% (-15.90 Gg CO2 / year). 1990-2022 Emissions have changed by 0.4% (7.37 Gg CO2 / year).
- 1.B.1: Total sectoral emissions in 2022 are 184.03
Gg CO2 / year which is 4.5% of category 1 emissions. 2022 Emissions have
changed by 2.2% (3.90 Gg CO2 /
year). 1990-2022 Emissions have changed by 0.8% (0.94 Gg CO2 / year). For 2022 the
changes per gas
are:

There is no subsector information available in PRIMAP-hist. - 1.B.2: Total sectoral emissions in 2022 are 258.65
Gg CO2 / year which is 6.3% of category 1 emissions. 2022 Emissions have
changed by -42.4% (-190.07 Gg CO2 /
year). 1990-2022 Emissions have changed by -9.4% (-13.01 Gg CO2 / year). For 2022 the
changes per gas
are:
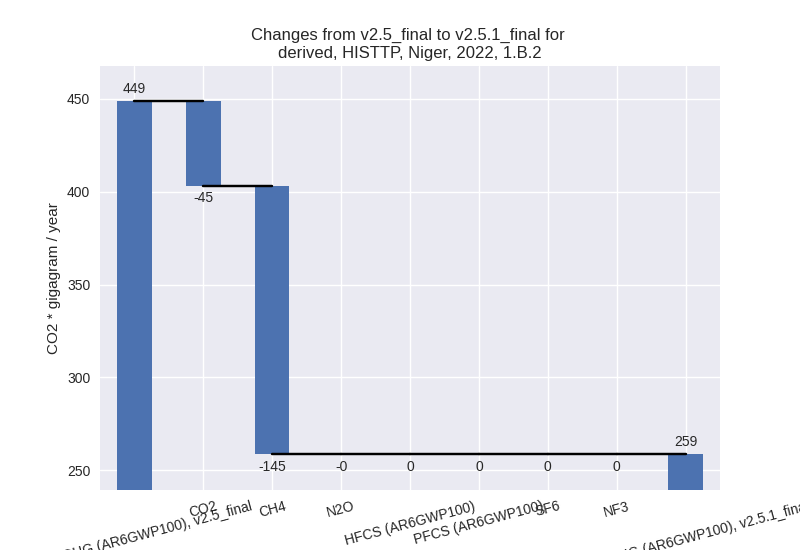
For 1990-2022 the changes per gas are:
There is no subsector information available in PRIMAP-hist.
- 2: Total sectoral emissions in 2022 are 738.98 Gg CO2 / year which is 1.6% of M.0.EL emissions. 2022 Emissions have changed by 1.0% (7.41 Gg CO2 / year). 1990-2022 Emissions have changed by -0.9% (-2.39 Gg CO2 / year).
- M.AG: Total sectoral emissions in 2022 are 38010.30
Gg CO2 / year which is 81.0% of M.0.EL emissions. 2022 Emissions have
changed by 4.8% (1755.22 Gg CO2 /
year). 1990-2022 Emissions have changed by 0.3% (58.93 Gg CO2 / year). For 2022 the
changes per gas
are:

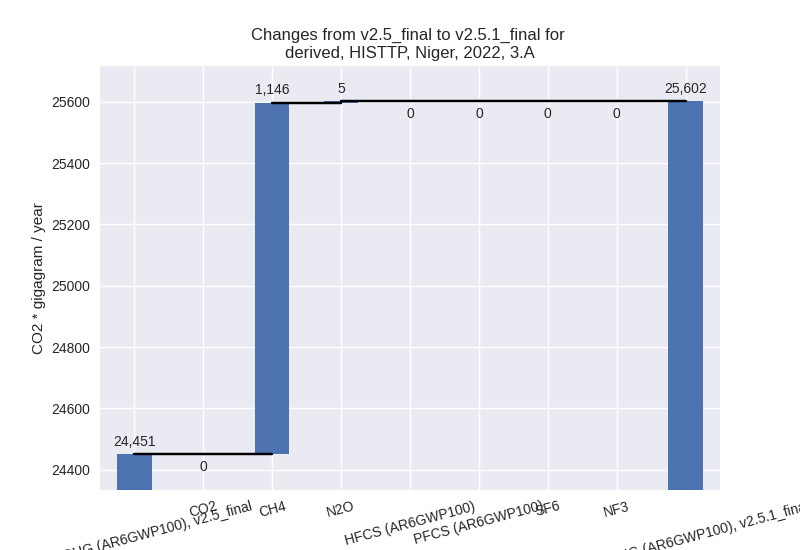
The changes come from the following subsectors:- 3.A: Total sectoral emissions in 2022 are 25601.53
Gg CO2 / year which is 67.4% of category M.AG emissions. 2022 Emissions
have changed by 4.7% (1150.64 Gg CO2
/ year). 1990-2022 Emissions have changed by 0.3% (36.96 Gg CO2 / year). For 2022 the
changes per gas
are:
There is no subsector information available in PRIMAP-hist. - M.AG.ELV: Total sectoral emissions in 2022 are
12408.77 Gg CO2 / year which is 32.6% of category M.AG emissions. 2022
Emissions have changed by 5.1%
(604.58 Gg CO2 / year). 1990-2022 Emissions have changed by 0.3% (21.97 Gg CO2 / year). For 2022 the
changes per gas
are:

There is no subsector information available in PRIMAP-hist.
- 3.A: Total sectoral emissions in 2022 are 25601.53
Gg CO2 / year which is 67.4% of category M.AG emissions. 2022 Emissions
have changed by 4.7% (1150.64 Gg CO2
/ year). 1990-2022 Emissions have changed by 0.3% (36.96 Gg CO2 / year). For 2022 the
changes per gas
are:
- 4: Total sectoral emissions in 2022 are 4005.58 Gg CO2 / year which is 8.5% of M.0.EL emissions. 2022 Emissions have changed by 0.7% (26.88 Gg CO2 / year). 1990-2022 Emissions have changed by 0.0% (0.81 Gg CO2 / year).
- 5: Total sectoral emissions in 2022 are 81.53 Gg
CO2 / year which is 0.2% of M.0.EL emissions. 2022 Emissions have
changed by -12.6% (-11.76 Gg CO2 /
year). 1990-2022 Emissions have changed by -0.6% (-0.36 Gg CO2 / year). For 2022 the
changes per gas
are:
