Changes in PRIMAP-hist v2.5.1_final compared to v2.5_final for Nigeria
2024-02-29
Johannes Gütschow
Change analysis for Nigeria for PRIMAP-hist v2.5.1_final compared to v2.5_final
Overview over emissions by sector and gas
The following figures show the aggregate national total emissions excluding LULUCF AR6GWP100 for the country reported priority scenario. The dotted linesshow the v2.5_final data.


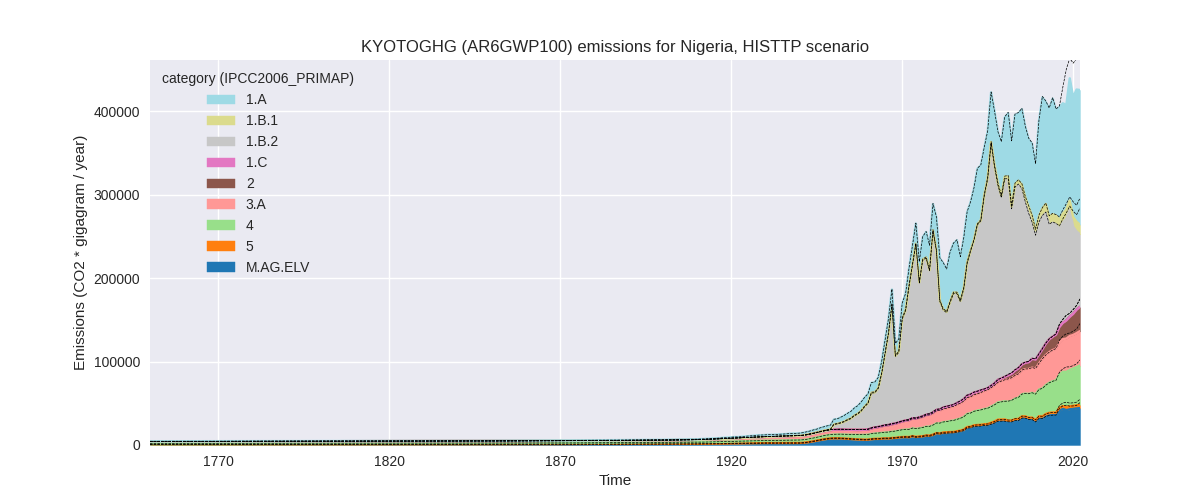
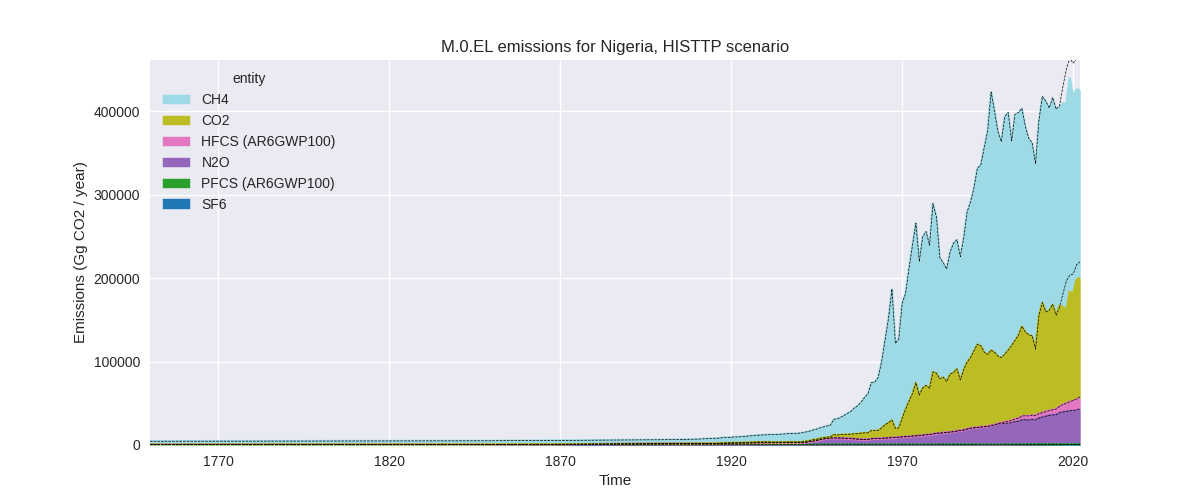
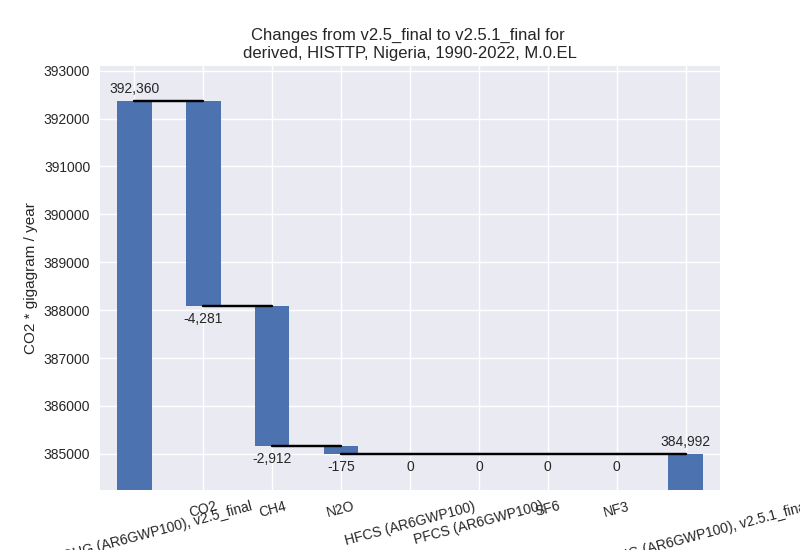
The following figures show the aggregate national total emissions excluding LULUCF AR6GWP100 for the third party priority scenario. The dotted linesshow the v2.5_final data.
Overview over changes
In the country reported priority scenario we have the following changes for aggregate Kyoto GHG and national total emissions excluding LULUCF (M.0.EL):
- Emissions in 2022 have changed by -6.1%% (-25996.06 Gg CO2 / year)
- Emissions in 1990-2022 have changed by -1.1%% (-3022.14 Gg CO2 / year)
In the third party priority scenario we have the following changes for aggregate Kyoto GHG and national total emissions excluding LULUCF (M.0.EL):
- Emissions in 2022 have changed by -10.8%% (-51550.70 Gg CO2 / year)
- Emissions in 1990-2022 have changed by -1.9%% (-7367.94 Gg CO2 / year)
Most important changes per scenario and time frame
In the country reported priority scenario the following sector-gas combinations have the highest absolute impact on national total KyotoGHG (AR6GWP100) emissions in 2022 (top 5):
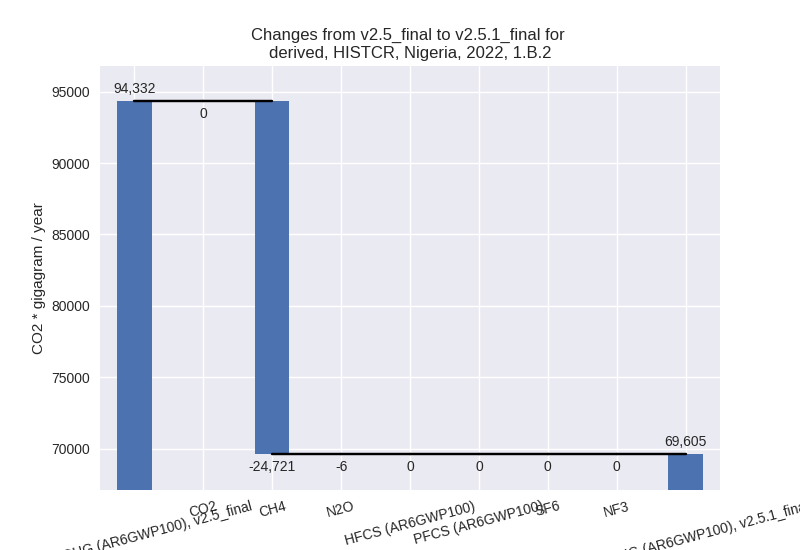
- 1: 1.B.2, CH4 with -24721.49 Gg CO2 / year (-27.2%)
- 2: 3.A, CH4 with -1833.17 Gg CO2 / year (-4.5%)
- 3: 1.A, CO2 with 1582.93 Gg CO2 / year (1.0%)
- 4: M.AG.ELV, CH4 with -873.77 Gg CO2 / year (-8.9%)
- 5: M.AG.ELV, N2O with -621.35 Gg CO2 / year (-2.6%)
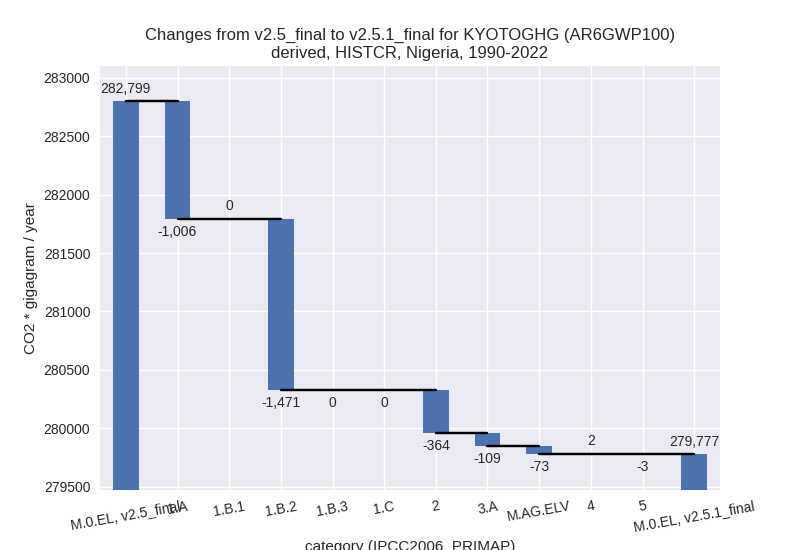
In the country reported priority scenario the following sector-gas combinations have the highest absolute impact on national total KyotoGHG (AR6GWP100) emissions in 1990-2022 (top 5):
- 1: 1.B.2, CH4 with -1470.44 Gg CO2 / year (-1.7%)
- 2: 1.A, CO2 with -1042.51 Gg CO2 / year (-1.3%)
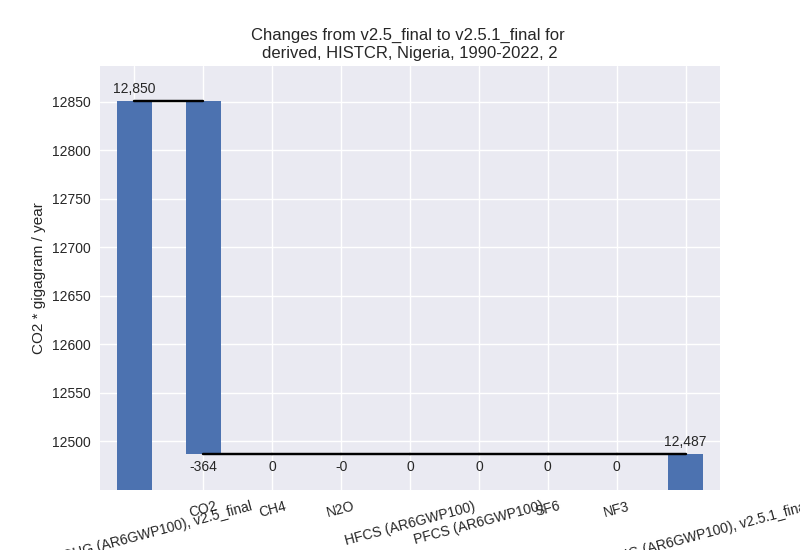
- 3: 2, CO2 with -363.56 Gg CO2 / year (-4.6%)
- 4: 3.A, CH4 with -107.71 Gg CO2 / year (-0.4%)
- 5: M.AG.ELV, CH4 with -70.98 Gg CO2 / year (-1.0%)
In the third party priority scenario the following sector-gas combinations have the highest absolute impact on national total KyotoGHG (AR6GWP100) emissions in 2022 (top 5):
- 1: 1.B.2, CH4 with -22133.01 Gg CO2 / year (-22.5%)
- 2: 1.A, CO2 with -18149.00 Gg CO2 / year (-13.4%)
- 3: M.AG.ELV, CH4 with -6029.97 Gg CO2 / year (-29.1%)
- 4: 3.A, CH4 with -2341.78 Gg CO2 / year (-5.5%)
- 5: 1.A, CH4 with -1209.31 Gg CO2 / year (-3.1%)
In the third party priority scenario the following sector-gas combinations have the highest absolute impact on national total KyotoGHG (AR6GWP100) emissions in 1990-2022 (top 5):
- 1: 1.A, CO2 with -3864.56 Gg CO2 / year (-5.6%)
- 2: 1.B.2, CH4 with -1835.80 Gg CO2 / year (-1.3%)
- 3: M.AG.ELV, CH4 with -959.49 Gg CO2 / year (-8.4%)
- 4: 2, CO2 with -485.48 Gg CO2 / year (-8.1%)
- 5: M.AG.ELV, N2O with -173.52 Gg CO2 / year (-0.8%)
Notes on data changes
Here we list notes explaining important emissions changes for the country. ’' means that the following text only applies to the TP time series, while means that it only applies to the CR scenario. Otherwise the note applies to both scenarios.
- 1.B.2, CH4: Emissions for 2019-2021 are lower in EDGAR 8.0 than in EDGAR 7.0 leading to lower 2022 emissions in PRIMAP-hist v2.5.1
- 3.A, CH4: FAO 2023 emissions are slightly lower for 2020 then FAO 2022 leading to lower 2022 emissions in PRIMAP-hist.
- 1.A, CO2: CDIAC 2023 data are lower for 2017 than CDIAC 2020. This leads to lower 2017 to 2022 emissions in the TP scenario and lower 2018-2020 emissions in the CR scenario.
- M.AG.ELV, CH4: New FAO data are much lower starting in 2016.
Changes by sector and gas
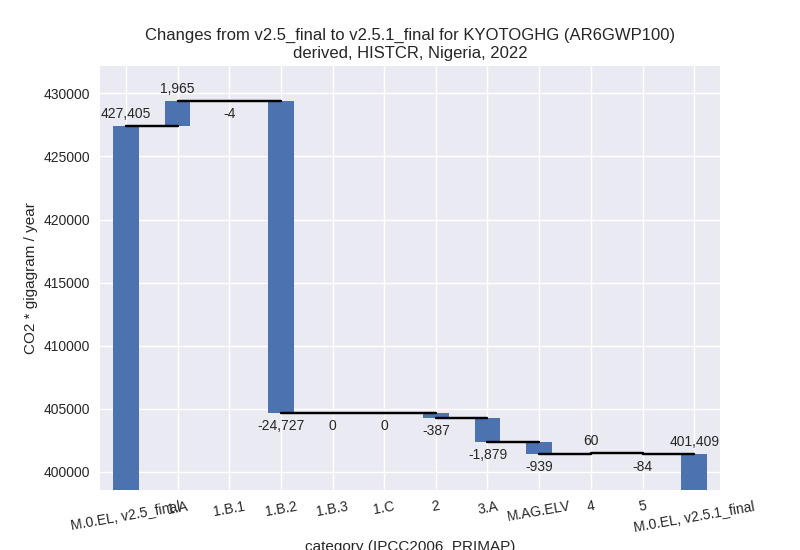
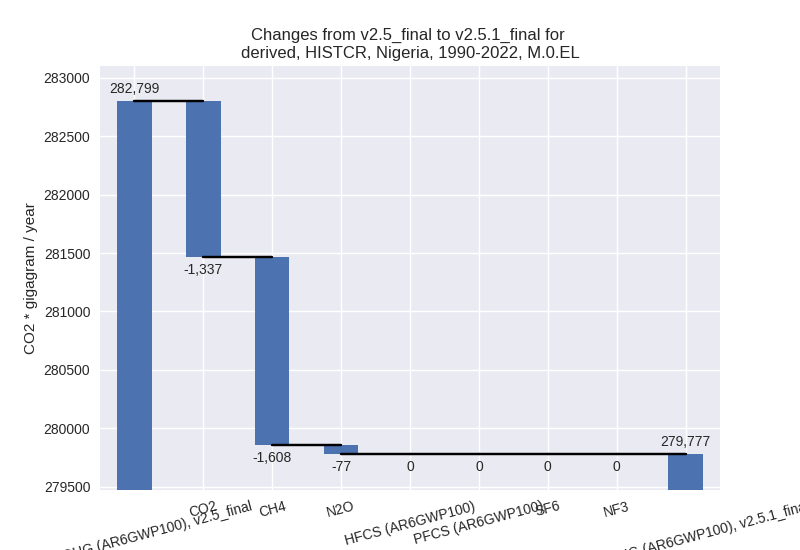
For each scenario and time frame the changes are displayed for all individual sectors and all individual gases. In the sector plot we use aggregate Kyoto GHGs in AR6GWP100. In the gas plot we usenational total emissions without LULUCF. ## country reported scenario
2022

1990-2022
third party scenario
2022

1990-2022
Detailed changes for the scenarios:
country reported scenario (HISTCR):
Most important changes per time frame
For 2022 the following sector-gas combinations have the highest absolute impact on national total KyotoGHG (AR6GWP100) emissions in 2022 (top 5):
- 1: 1.B.2, CH4 with -24721.49 Gg CO2 / year (-27.2%)
- 2: 3.A, CH4 with -1833.17 Gg CO2 / year (-4.5%)
- 3: 1.A, CO2 with 1582.93 Gg CO2 / year (1.0%)
- 4: M.AG.ELV, CH4 with -873.77 Gg CO2 / year (-8.9%)
- 5: M.AG.ELV, N2O with -621.35 Gg CO2 / year (-2.6%)
For 1990-2022 the following sector-gas combinations have the highest absolute impact on national total KyotoGHG (AR6GWP100) emissions in 1990-2022 (top 5):
- 1: 1.B.2, CH4 with -1470.44 Gg CO2 / year (-1.7%)
- 2: 1.A, CO2 with -1042.51 Gg CO2 / year (-1.3%)
- 3: 2, CO2 with -363.56 Gg CO2 / year (-4.6%)
- 4: 3.A, CH4 with -107.71 Gg CO2 / year (-0.4%)
- 5: M.AG.ELV, CH4 with -70.98 Gg CO2 / year (-1.0%)
Changes in the main sectors for aggregate KyotoGHG (AR6GWP100) are
- 1: Total sectoral emissions in 2022 are 257729.74
Gg CO2 / year which is 64.2% of M.0.EL emissions. 2022 Emissions have
changed by -8.1% (-22766.40 Gg CO2 /
year). 1990-2022 Emissions have changed by -1.3% (-2476.25 Gg CO2 / year). For 2022
the changes per gas
are:

The changes come from the following subsectors:- 1.A: Total sectoral emissions in 2022 are 187949.93 Gg CO2 / year which is 72.9% of category 1 emissions. 2022 Emissions have changed by 1.1% (1965.13 Gg CO2 / year). 1990-2022 Emissions have changed by -1.0% (-1005.77 Gg CO2 / year).
- 1.B.1: Total sectoral emissions in 2022 are 174.97
Gg CO2 / year which is 0.1% of category 1 emissions. 2022 Emissions have
changed by -2.3% (-4.06 Gg CO2 /
year). 1990-2022 Emissions have changed by 0.1% (0.14 Gg CO2 / year). For 2022 the
changes per gas
are:

There is no subsector information available in PRIMAP-hist. - 1.B.2: Total sectoral emissions in 2022 are
69604.84 Gg CO2 / year which is 27.0% of category 1 emissions. 2022
Emissions have changed by -26.2%
(-24727.48 Gg CO2 / year). 1990-2022 Emissions have changed by -1.6% (-1470.62 Gg CO2 / year). For 2022
the changes per gas
are:
There is no subsector information available in PRIMAP-hist.
- 2: Total sectoral emissions in 2022 are 30161.31 Gg
CO2 / year which is 7.5% of M.0.EL emissions. 2022 Emissions have
changed by -1.3% (-387.12 Gg CO2 /
year). 1990-2022 Emissions have changed by -2.8% (-363.56 Gg CO2 / year). For
1990-2022 the changes per gas
are:
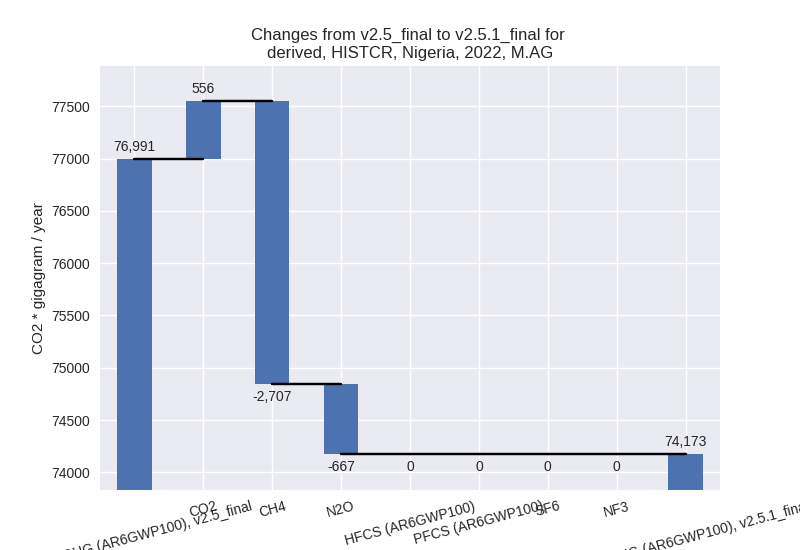
- M.AG: Total sectoral emissions in 2022 are 74172.94
Gg CO2 / year which is 18.5% of M.0.EL emissions. 2022 Emissions have
changed by -3.7% (-2818.56 Gg CO2 /
year). 1990-2022 Emissions have changed by -0.3% (-181.61 Gg CO2 / year). For 2022
the changes per gas
are:
The changes come from the following subsectors:- 3.A: Total sectoral emissions in 2022 are 40513.27
Gg CO2 / year which is 54.6% of category M.AG emissions. 2022 Emissions
have changed by -4.4% (-1879.22 Gg
CO2 / year). 1990-2022 Emissions have changed by -0.4% (-109.10 Gg CO2 / year). For 2022
the changes per gas
are:

There is no subsector information available in PRIMAP-hist. - M.AG.ELV: Total sectoral emissions in 2022 are
33659.67 Gg CO2 / year which is 45.4% of category M.AG emissions. 2022
Emissions have changed by -2.7%
(-939.33 Gg CO2 / year). 1990-2022 Emissions have changed by -0.3% (-72.50 Gg CO2 / year). For 2022 the
changes per gas
are:

There is no subsector information available in PRIMAP-hist.
- 3.A: Total sectoral emissions in 2022 are 40513.27
Gg CO2 / year which is 54.6% of category M.AG emissions. 2022 Emissions
have changed by -4.4% (-1879.22 Gg
CO2 / year). 1990-2022 Emissions have changed by -0.4% (-109.10 Gg CO2 / year). For 2022
the changes per gas
are:
- 4: Total sectoral emissions in 2022 are 35464.82 Gg CO2 / year which is 8.8% of M.0.EL emissions. 2022 Emissions have changed by 0.2% (60.47 Gg CO2 / year). 1990-2022 Emissions have changed by 0.0% (1.83 Gg CO2 / year).
- 5: Total sectoral emissions in 2022 are 3879.88 Gg
CO2 / year which is 1.0% of M.0.EL emissions. 2022 Emissions have
changed by -2.1% (-84.45 Gg CO2 /
year). 1990-2022 Emissions have changed by -0.1% (-2.56 Gg CO2 / year). For 2022 the
changes per gas
are:

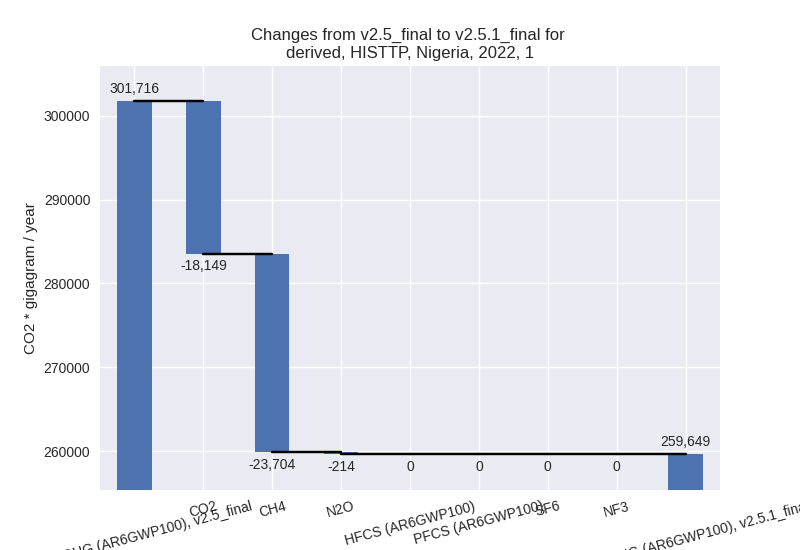
third party scenario (HISTTP):
Most important changes per time frame
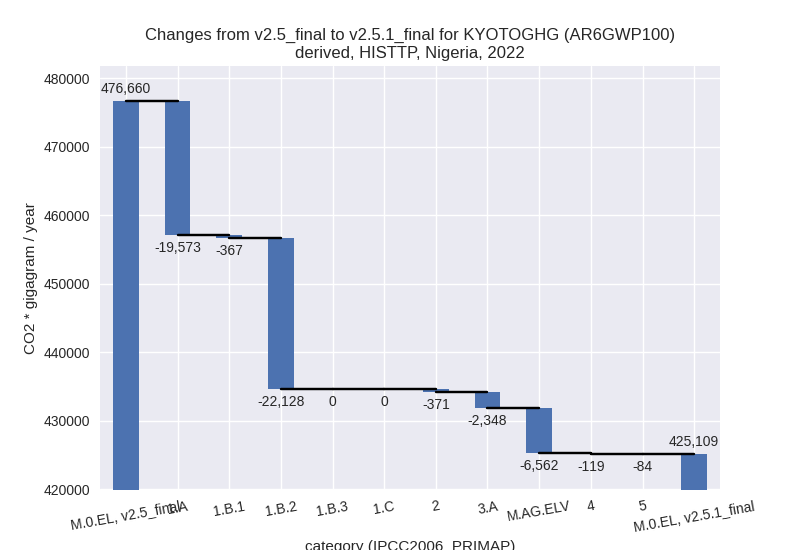
For 2022 the following sector-gas combinations have the highest absolute impact on national total KyotoGHG (AR6GWP100) emissions in 2022 (top 5):
- 1: 1.B.2, CH4 with -22133.01 Gg CO2 / year (-22.5%)
- 2: 1.A, CO2 with -18149.00 Gg CO2 / year (-13.4%)
- 3: M.AG.ELV, CH4 with -6029.97 Gg CO2 / year (-29.1%)
- 4: 3.A, CH4 with -2341.78 Gg CO2 / year (-5.5%)
- 5: 1.A, CH4 with -1209.31 Gg CO2 / year (-3.1%)
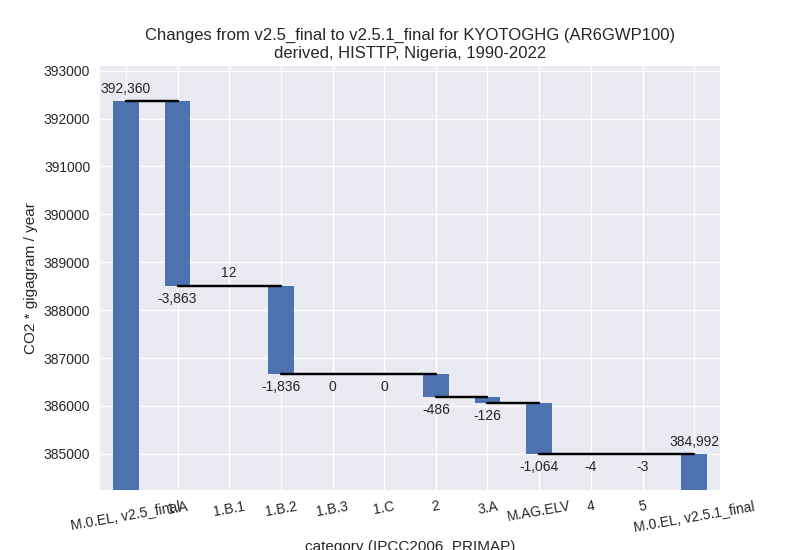
For 1990-2022 the following sector-gas combinations have the highest absolute impact on national total KyotoGHG (AR6GWP100) emissions in 1990-2022 (top 5):
- 1: 1.A, CO2 with -3864.56 Gg CO2 / year (-5.6%)
- 2: 1.B.2, CH4 with -1835.80 Gg CO2 / year (-1.3%)
- 3: M.AG.ELV, CH4 with -959.49 Gg CO2 / year (-8.4%)
- 4: 2, CO2 with -485.48 Gg CO2 / year (-8.1%)
- 5: M.AG.ELV, N2O with -173.52 Gg CO2 / year (-0.8%)
Changes in the main sectors for aggregate KyotoGHG (AR6GWP100) are
- 1: Total sectoral emissions in 2022 are 259648.90
Gg CO2 / year which is 61.1% of M.0.EL emissions. 2022 Emissions have
changed by -13.9% (-42067.38 Gg CO2
/ year). 1990-2022 Emissions have changed by -2.0% (-5686.67 Gg CO2 / year). For 2022
the changes per gas
are:
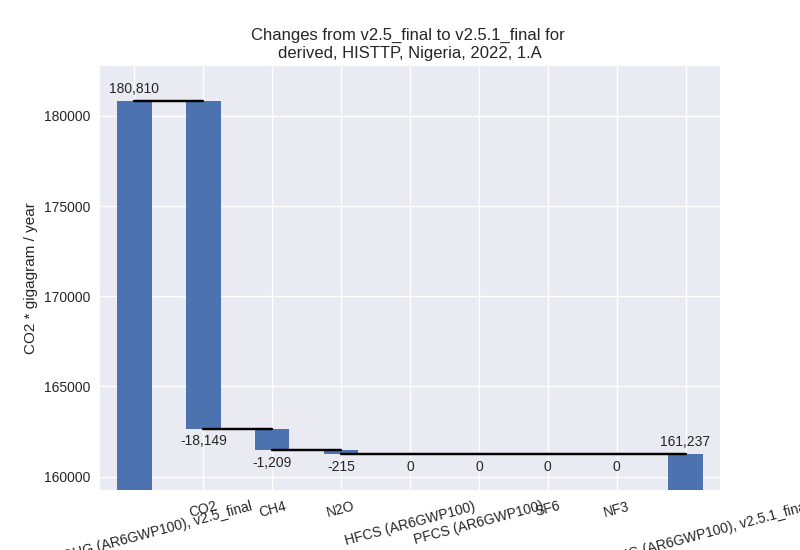
The changes come from the following subsectors:- 1.A: Total sectoral emissions in 2022 are 161236.93
Gg CO2 / year which is 62.1% of category 1 emissions. 2022 Emissions
have changed by -10.8% (-19572.98 Gg
CO2 / year). 1990-2022 Emissions have changed by -3.8% (-3863.25 Gg CO2 / year). For 2022
the changes per gas
are:
For 1990-2022 the changes per gas are:
There is no subsector information available in PRIMAP-hist. - 1.B.1: Total sectoral emissions in 2022 are
11639.90 Gg CO2 / year which is 4.5% of category 1 emissions. 2022
Emissions have changed by -3.1%
(-366.82 Gg CO2 / year). 1990-2022 Emissions have changed by 0.2% (12.28 Gg CO2 / year). For 2022 the
changes per gas
are:

There is no subsector information available in PRIMAP-hist. - 1.B.2: Total sectoral emissions in 2022 are
86772.07 Gg CO2 / year which is 33.4% of category 1 emissions. 2022
Emissions have changed by -20.3%
(-22127.57 Gg CO2 / year). 1990-2022 Emissions have changed by -1.0% (-1835.70 Gg CO2 / year). For 2022
the changes per gas
are:
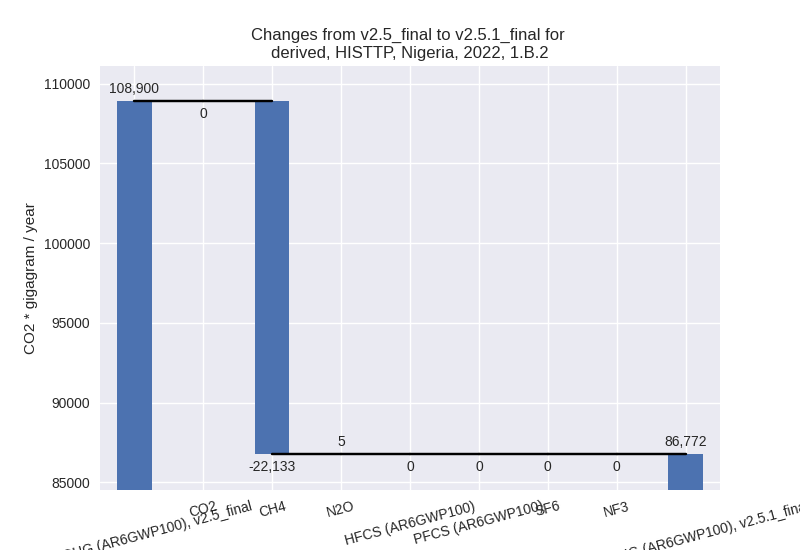
There is no subsector information available in PRIMAP-hist.
- 1.A: Total sectoral emissions in 2022 are 161236.93
Gg CO2 / year which is 62.1% of category 1 emissions. 2022 Emissions
have changed by -10.8% (-19572.98 Gg
CO2 / year). 1990-2022 Emissions have changed by -3.8% (-3863.25 Gg CO2 / year). For 2022
the changes per gas
are:
- 2: Total sectoral emissions in 2022 are 29053.50 Gg
CO2 / year which is 6.8% of M.0.EL emissions. 2022 Emissions have
changed by -1.3% (-370.52 Gg CO2 /
year). 1990-2022 Emissions have changed by -4.4% (-485.50 Gg CO2 / year). For
1990-2022 the changes per gas
are:

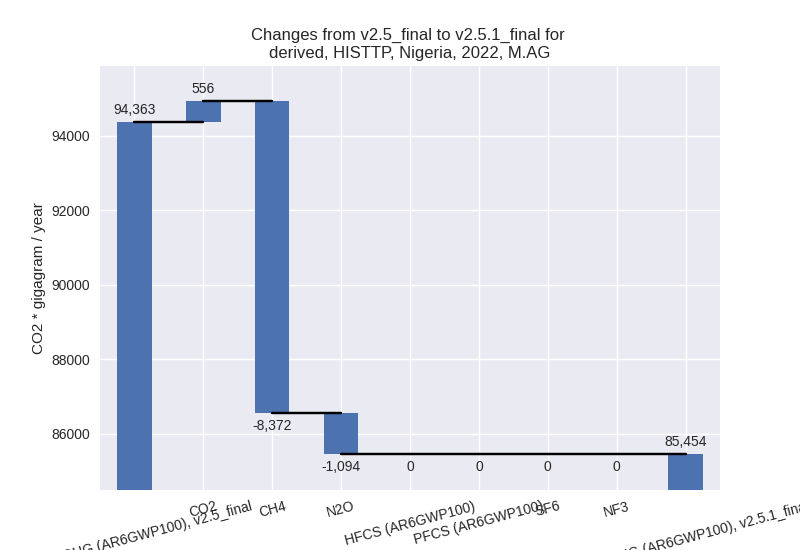
- M.AG: Total sectoral emissions in 2022 are 85453.85
Gg CO2 / year which is 20.1% of M.0.EL emissions. 2022 Emissions have
changed by -9.4% (-8909.63 Gg CO2 /
year). 1990-2022 Emissions have changed by -1.9% (-1189.61 Gg CO2 / year). For 2022
the changes per gas
are:
The changes come from the following subsectors:- 3.A: Total sectoral emissions in 2022 are 41228.39
Gg CO2 / year which is 48.2% of category M.AG emissions. 2022 Emissions
have changed by -5.4% (-2348.12 Gg
CO2 / year). 1990-2022 Emissions have changed by -0.4% (-125.83 Gg CO2 / year). For 2022
the changes per gas
are:

There is no subsector information available in PRIMAP-hist. - M.AG.ELV: Total sectoral emissions in 2022 are
44225.45 Gg CO2 / year which is 51.8% of category M.AG emissions. 2022
Emissions have changed by -12.9%
(-6561.52 Gg CO2 / year). 1990-2022 Emissions have changed by -3.3% (-1063.78 Gg CO2 / year). For 2022
the changes per gas
are:

For 1990-2022 the changes per gas are:
There is no subsector information available in PRIMAP-hist.
- 3.A: Total sectoral emissions in 2022 are 41228.39
Gg CO2 / year which is 48.2% of category M.AG emissions. 2022 Emissions
have changed by -5.4% (-2348.12 Gg
CO2 / year). 1990-2022 Emissions have changed by -0.4% (-125.83 Gg CO2 / year). For 2022
the changes per gas
are:
- 4: Total sectoral emissions in 2022 are 47072.98 Gg CO2 / year which is 11.1% of M.0.EL emissions. 2022 Emissions have changed by -0.3% (-118.71 Gg CO2 / year). 1990-2022 Emissions have changed by -0.0% (-3.60 Gg CO2 / year).
- 5: Total sectoral emissions in 2022 are 3879.88 Gg
CO2 / year which is 0.9% of M.0.EL emissions. 2022 Emissions have
changed by -2.1% (-84.45 Gg CO2 /
year). 1990-2022 Emissions have changed by -0.1% (-2.56 Gg CO2 / year). For 2022 the
changes per gas
are:
