Changes in PRIMAP-hist v2.5.1_final compared to v2.5_final for Netherlands
2024-02-29
Johannes Gütschow
Change analysis for Netherlands for PRIMAP-hist v2.5.1_final compared to v2.5_final
Overview over emissions by sector and gas
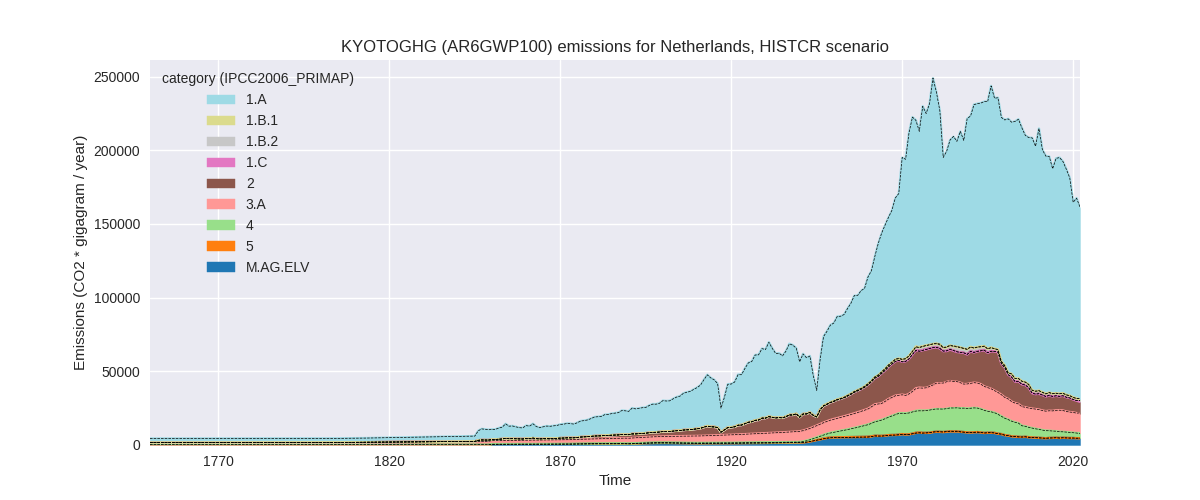
The following figures show the aggregate national total emissions excluding LULUCF AR6GWP100 for the country reported priority scenario. The dotted linesshow the v2.5_final data.

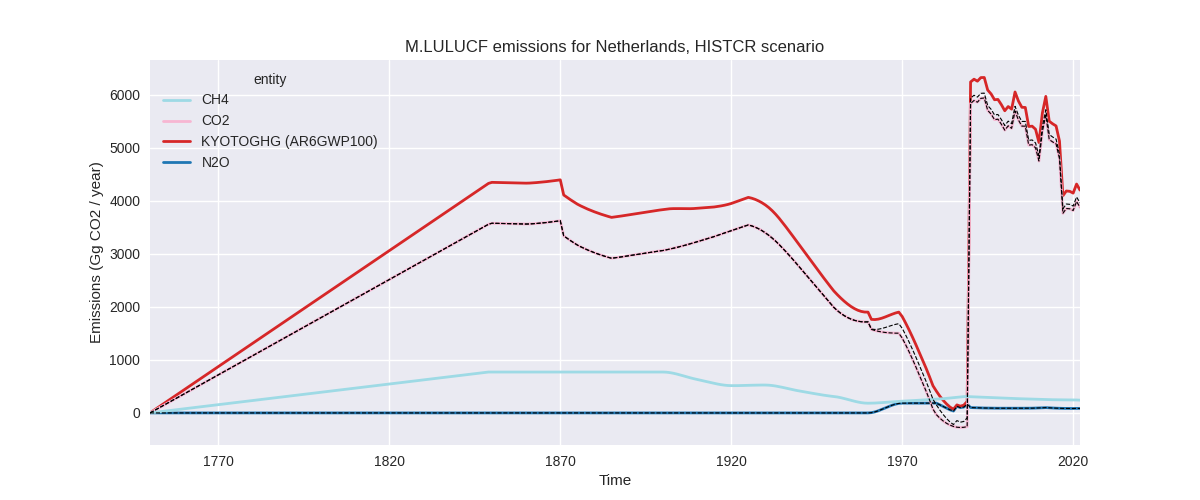
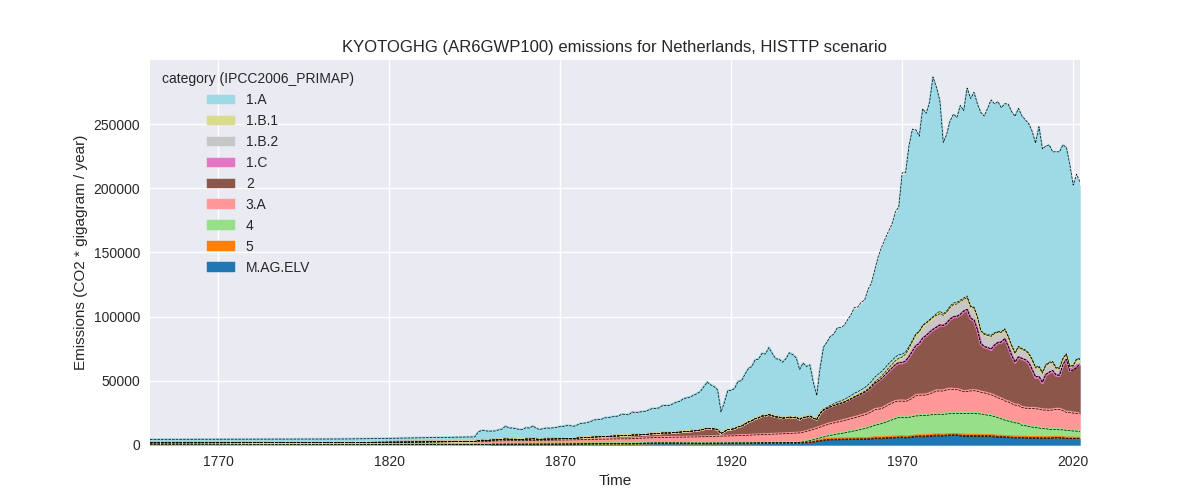
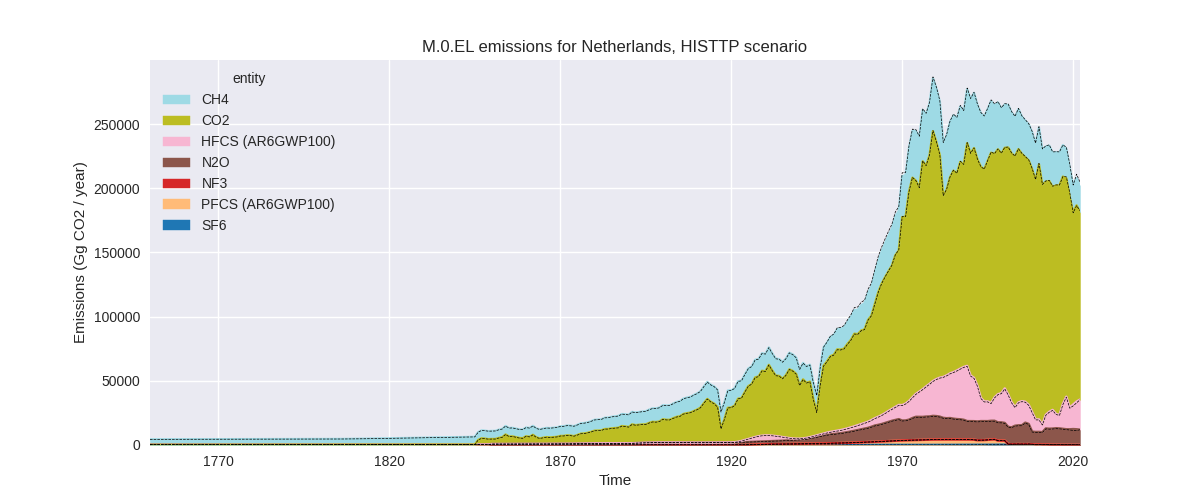
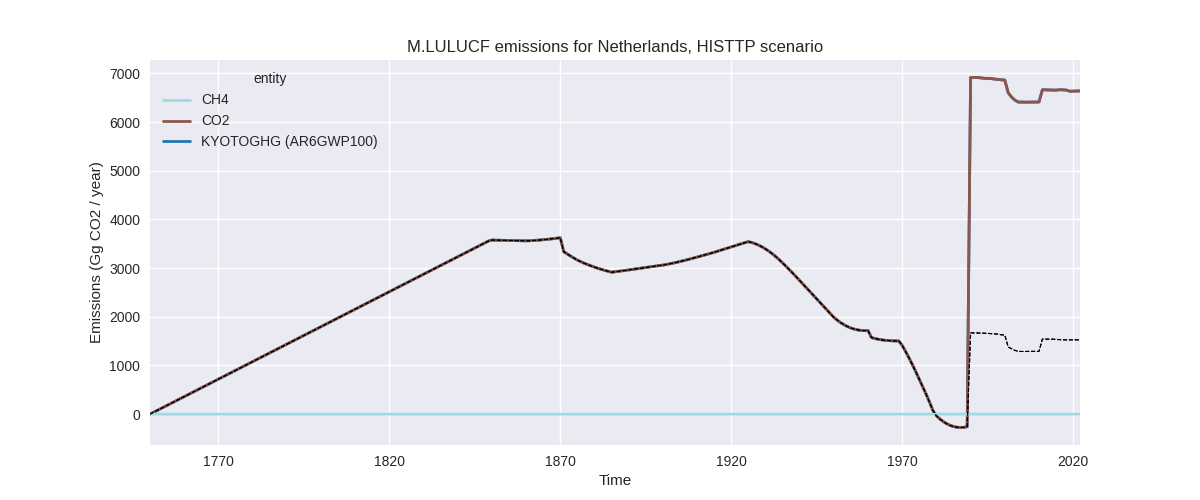
The following figures show the aggregate national total emissions excluding LULUCF AR6GWP100 for the third party priority scenario. The dotted linesshow the v2.5_final data.
Overview over changes
In the country reported priority scenario we have the following changes for aggregate Kyoto GHG and national total emissions excluding LULUCF (M.0.EL):
- Emissions in 2022 have changed by -0.4%% (-709.21 Gg CO2 / year)
- Emissions in 1990-2022 have changed by -0.0%% (-21.49 Gg CO2 / year)
In the third party priority scenario we have the following changes for aggregate Kyoto GHG and national total emissions excluding LULUCF (M.0.EL):
- Emissions in 2022 have changed by -1.5%% (-2980.53 Gg CO2 / year)
- Emissions in 1990-2022 have changed by -0.4%% (-931.56 Gg CO2 / year)
Most important changes per scenario and time frame
In the country reported priority scenario the following sector-gas combinations have the highest absolute impact on national total KyotoGHG (AR6GWP100) emissions in 2022 (top 5):
- 1: 3.A, CH4 with -957.28 Gg CO2 / year (-7.0%)
- 2: 4, CH4 with 472.44 Gg CO2 / year (21.3%)
- 3: 2, CO2 with -462.83 Gg CO2 / year (-8.0%)
- 4: 2, N2O with 237.91 Gg CO2 / year (33.5%)
- 5: 1.A, CH4 with 164.87 Gg CO2 / year (8.8%)
In the country reported priority scenario the following sector-gas combinations have the highest absolute impact on national total KyotoGHG (AR6GWP100) emissions in 1990-2022 (top 5):
- 1: 3.A, CH4 with -29.01 Gg CO2 / year (-0.2%)
- 2: 4, CH4 with 14.32 Gg CO2 / year (0.2%)
- 3: 2, CO2 with -14.03 Gg CO2 / year (-0.2%)
- 4: 2, N2O with 7.21 Gg CO2 / year (0.2%)
- 5: 1.A, CH4 with 5.00 Gg CO2 / year (0.3%)
In the third party priority scenario the following sector-gas combinations have the highest absolute impact on national total KyotoGHG (AR6GWP100) emissions in 2022 (top 5):
- 1: 1.B.2, CH4 with -1108.19 Gg CO2 / year (-31.5%)
- 2: 1.A, CO2 with -1083.08 Gg CO2 / year (-0.8%)
- 3: 3.A, CH4 with -995.19 Gg CO2 / year (-7.4%)
- 4: 4, CH4 with 444.53 Gg CO2 / year (9.6%)
- 5: 2, CO2 with -190.12 Gg CO2 / year (-1.8%)
In the third party priority scenario the following sector-gas combinations have the highest absolute impact on national total KyotoGHG (AR6GWP100) emissions in 1990-2022 (top 5):
- 1: 2, CO2 with -775.89 Gg CO2 / year (-6.3%)
- 2: M.AG.ELV, N2O with 346.30 Gg CO2 / year (6.2%)
- 3: 1.B.2, CH4 with -344.95 Gg CO2 / year (-5.0%)
- 4: 1.A, CO2 with -229.93 Gg CO2 / year (-0.1%)
- 5: 2, N2O with 46.72 Gg CO2 / year (1.1%)
Notes on data changes
No country specific notes present for this changelog.
Changes by sector and gas
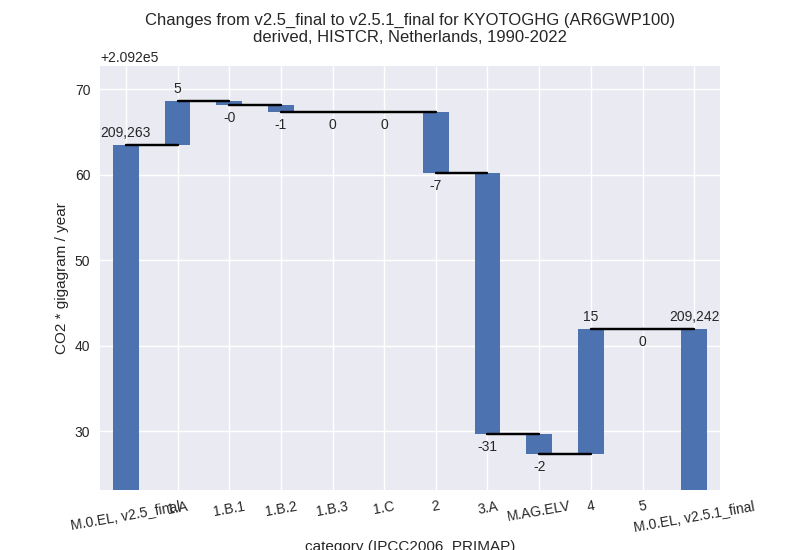
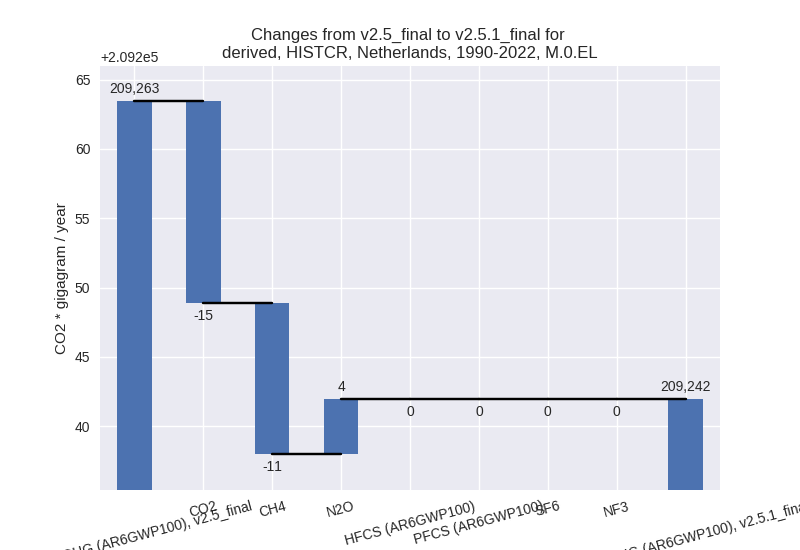
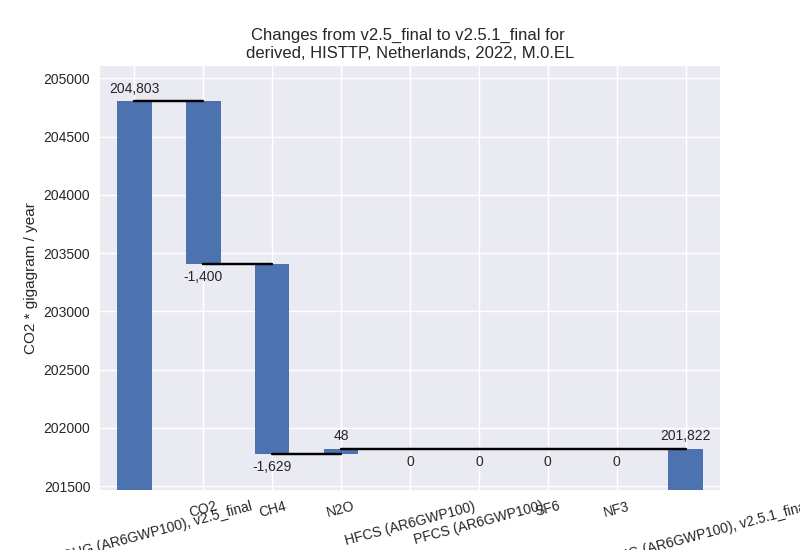
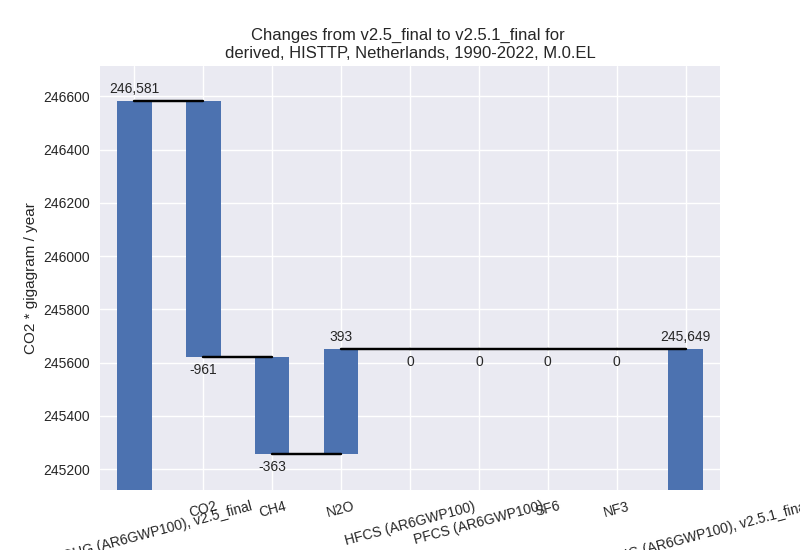
For each scenario and time frame the changes are displayed for all individual sectors and all individual gases. In the sector plot we use aggregate Kyoto GHGs in AR6GWP100. In the gas plot we usenational total emissions without LULUCF. ## country reported scenario
2022


1990-2022
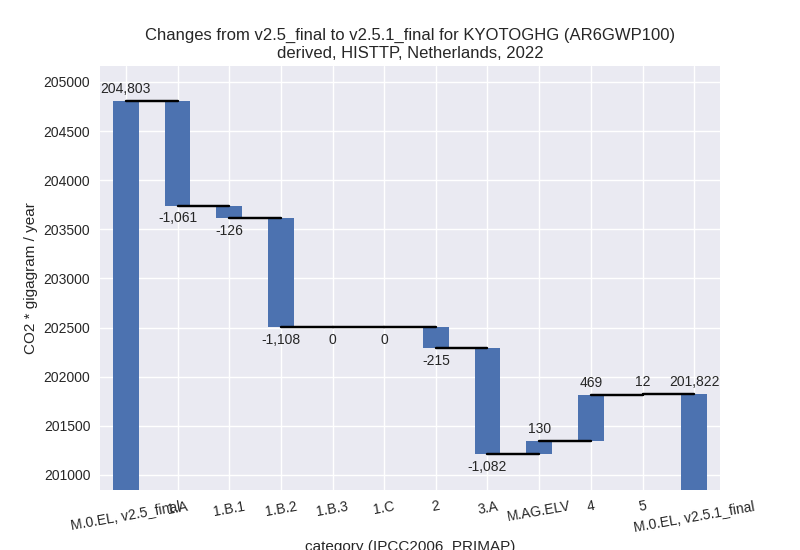
third party scenario
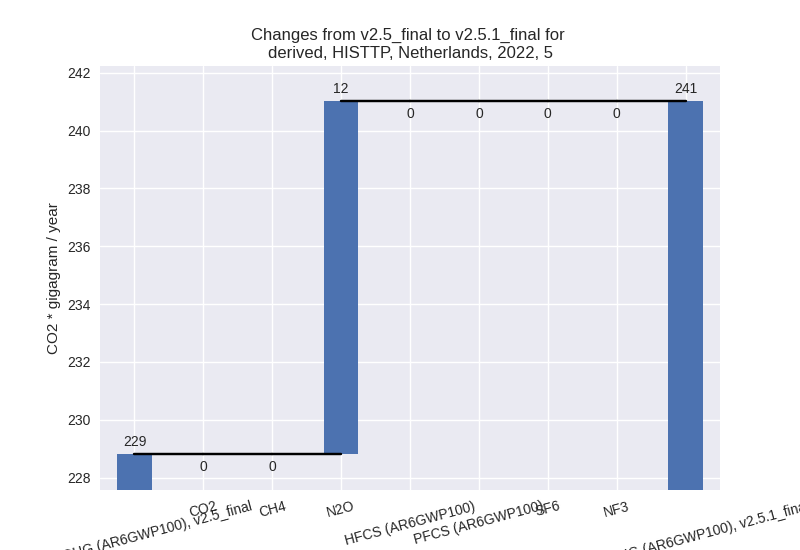
2022
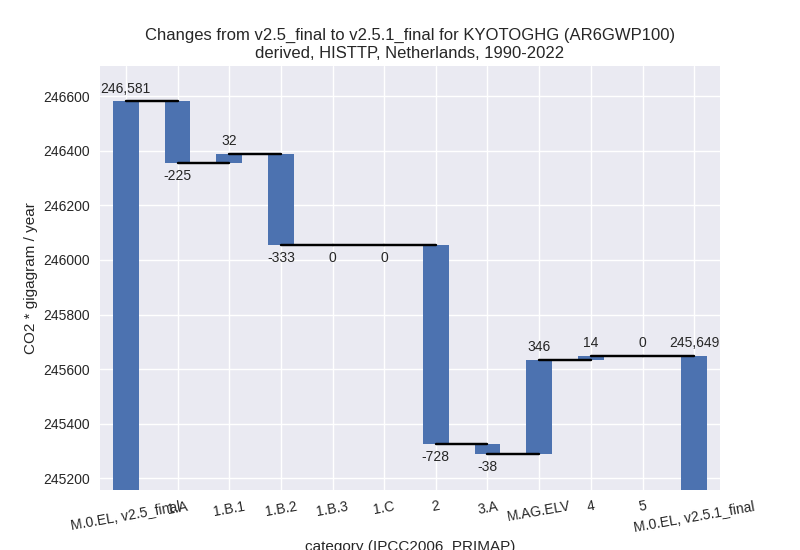
1990-2022
Detailed changes for the scenarios:
country reported scenario (HISTCR):
Most important changes per time frame
For 2022 the following sector-gas combinations have the highest absolute impact on national total KyotoGHG (AR6GWP100) emissions in 2022 (top 5):
- 1: 3.A, CH4 with -957.28 Gg CO2 / year (-7.0%)
- 2: 4, CH4 with 472.44 Gg CO2 / year (21.3%)
- 3: 2, CO2 with -462.83 Gg CO2 / year (-8.0%)
- 4: 2, N2O with 237.91 Gg CO2 / year (33.5%)
- 5: 1.A, CH4 with 164.87 Gg CO2 / year (8.8%)
For 1990-2022 the following sector-gas combinations have the highest absolute impact on national total KyotoGHG (AR6GWP100) emissions in 1990-2022 (top 5):
- 1: 3.A, CH4 with -29.01 Gg CO2 / year (-0.2%)
- 2: 4, CH4 with 14.32 Gg CO2 / year (0.2%)
- 3: 2, CO2 with -14.03 Gg CO2 / year (-0.2%)
- 4: 2, N2O with 7.21 Gg CO2 / year (0.2%)
- 5: 1.A, CH4 with 5.00 Gg CO2 / year (0.3%)
Changes in the main sectors for aggregate KyotoGHG (AR6GWP100) are
- 1: Total sectoral emissions in 2022 are 131347.59 Gg CO2 / year which is 81.8% of M.0.EL emissions. 2022 Emissions have changed by 0.1% (129.71 Gg CO2 / year). 1990-2022 Emissions have changed by 0.0% (3.93 Gg CO2 / year).
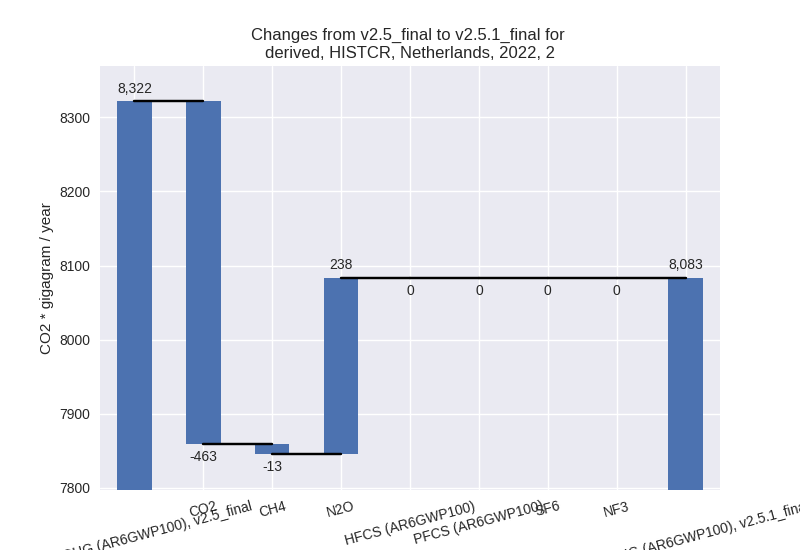
- 2: Total sectoral emissions in 2022 are 8083.37 Gg
CO2 / year which is 5.0% of M.0.EL emissions. 2022 Emissions have
changed by -2.9% (-238.23 Gg CO2 /
year). 1990-2022 Emissions have changed by -0.0% (-7.22 Gg CO2 / year). For 2022 the
changes per gas
are:
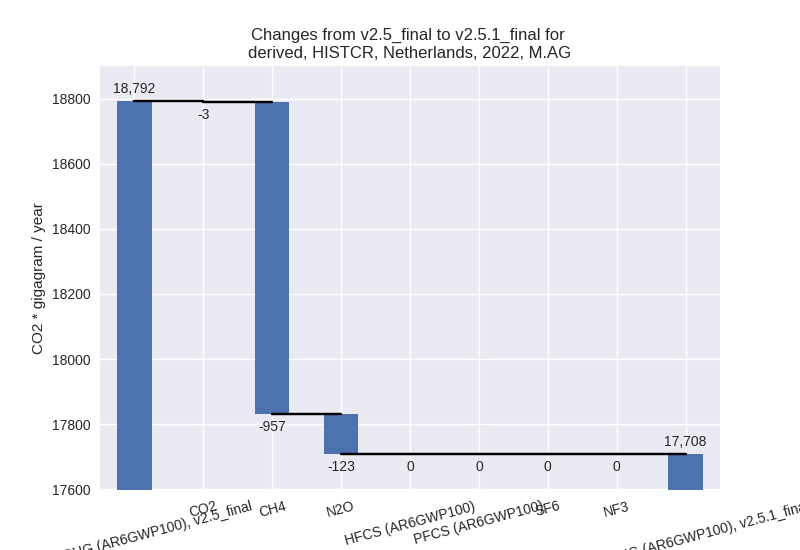
- M.AG: Total sectoral emissions in 2022 are 17707.63
Gg CO2 / year which is 11.0% of M.0.EL emissions. 2022 Emissions have
changed by -5.8% (-1083.90 Gg CO2 /
year). 1990-2022 Emissions have changed by -0.2% (-32.85 Gg CO2 / year). For 2022 the
changes per gas
are:
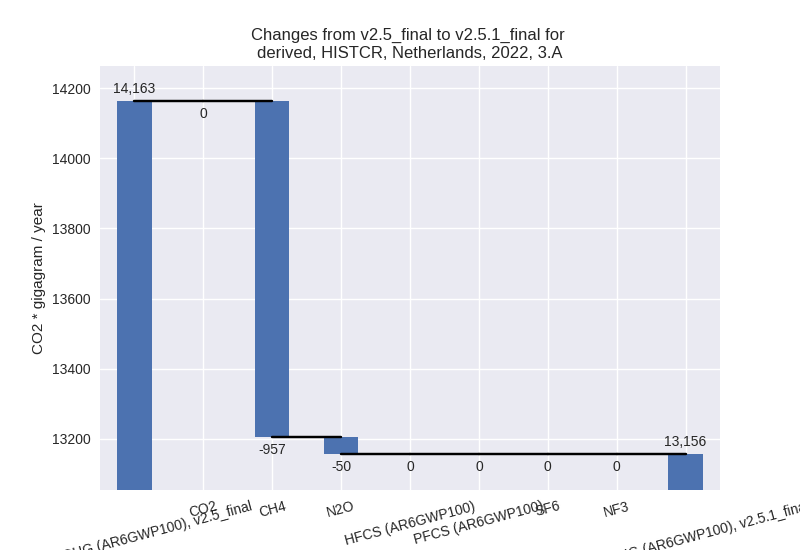
The changes come from the following subsectors:- 3.A: Total sectoral emissions in 2022 are 13155.72
Gg CO2 / year which is 74.3% of category M.AG emissions. 2022 Emissions
have changed by -7.1% (-1007.37 Gg
CO2 / year). 1990-2022 Emissions have changed by -0.2% (-30.53 Gg CO2 / year). For 2022 the
changes per gas
are:
There is no subsector information available in PRIMAP-hist. - M.AG.ELV: Total sectoral emissions in 2022 are 4551.91 Gg CO2 / year which is 25.7% of category M.AG emissions. 2022 Emissions have changed by -1.7% (-76.53 Gg CO2 / year). 1990-2022 Emissions have changed by -0.0% (-2.32 Gg CO2 / year).
- 3.A: Total sectoral emissions in 2022 are 13155.72
Gg CO2 / year which is 74.3% of category M.AG emissions. 2022 Emissions
have changed by -7.1% (-1007.37 Gg
CO2 / year). 1990-2022 Emissions have changed by -0.2% (-30.53 Gg CO2 / year). For 2022 the
changes per gas
are:
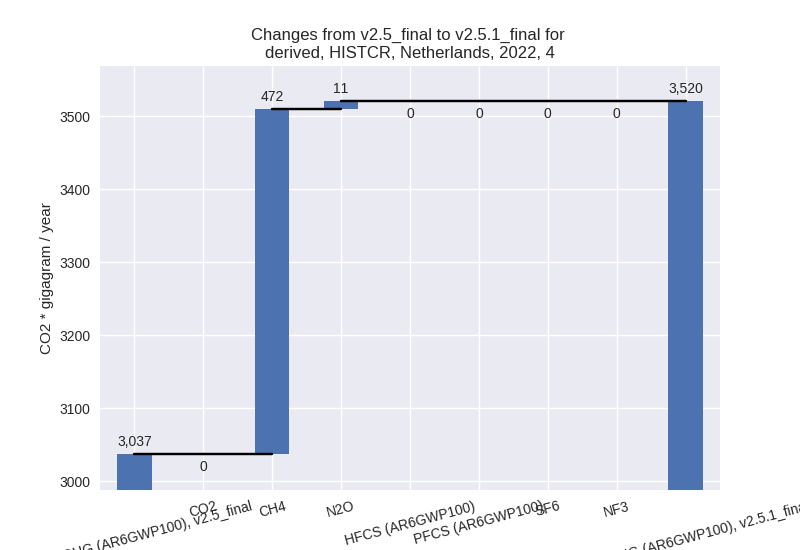
- 4: Total sectoral emissions in 2022 are 3520.33 Gg
CO2 / year which is 2.2% of M.0.EL emissions. 2022 Emissions have
changed by 15.9% (483.22 Gg CO2 /
year). 1990-2022 Emissions have changed by 0.2% (14.64 Gg CO2 / year). For 2022 the
changes per gas
are:
- 5: No data
third party scenario (HISTTP):
Most important changes per time frame
For 2022 the following sector-gas combinations have the highest absolute impact on national total KyotoGHG (AR6GWP100) emissions in 2022 (top 5):
- 1: 1.B.2, CH4 with -1108.19 Gg CO2 / year (-31.5%)
- 2: 1.A, CO2 with -1083.08 Gg CO2 / year (-0.8%)
- 3: 3.A, CH4 with -995.19 Gg CO2 / year (-7.4%)
- 4: 4, CH4 with 444.53 Gg CO2 / year (9.6%)
- 5: 2, CO2 with -190.12 Gg CO2 / year (-1.8%)
For 1990-2022 the following sector-gas combinations have the highest absolute impact on national total KyotoGHG (AR6GWP100) emissions in 1990-2022 (top 5):
- 1: 2, CO2 with -775.89 Gg CO2 / year (-6.3%)
- 2: M.AG.ELV, N2O with 346.30 Gg CO2 / year (6.2%)
- 3: 1.B.2, CH4 with -344.95 Gg CO2 / year (-5.0%)
- 4: 1.A, CO2 with -229.93 Gg CO2 / year (-0.1%)
- 5: 2, N2O with 46.72 Gg CO2 / year (1.1%)
Changes in the main sectors for aggregate KyotoGHG (AR6GWP100) are
- 1: Total sectoral emissions in 2022 are 139396.20 Gg CO2 / year which is 69.1% of M.0.EL emissions. 2022 Emissions have changed by -1.6% (-2295.85 Gg CO2 / year). 1990-2022 Emissions have changed by -0.3% (-525.94 Gg CO2 / year).
- 2: Total sectoral emissions in 2022 are 37978.05 Gg CO2 / year which is 18.8% of M.0.EL emissions. 2022 Emissions have changed by -0.6% (-214.59 Gg CO2 / year). 1990-2022 Emissions have changed by -2.0% (-728.30 Gg CO2 / year).
- M.AG: Total sectoral emissions in 2022 are 18605.39
Gg CO2 / year which is 9.2% of M.0.EL emissions. 2022 Emissions have
changed by -4.9% (-951.04 Gg CO2 /
year). 1990-2022 Emissions have changed by 1.5% (308.10 Gg CO2 / year). For 2022 the
changes per gas
are:

The changes come from the following subsectors:- 3.A: Total sectoral emissions in 2022 are 13406.57
Gg CO2 / year which is 72.1% of category M.AG emissions. 2022 Emissions
have changed by -7.5% (-1081.52 Gg
CO2 / year). 1990-2022 Emissions have changed by -0.3% (-38.24 Gg CO2 / year). For 2022 the
changes per gas
are:

There is no subsector information available in PRIMAP-hist. - M.AG.ELV: Total sectoral emissions in 2022 are
5198.83 Gg CO2 / year which is 27.9% of category M.AG emissions. 2022
Emissions have changed by 2.6%
(130.48 Gg CO2 / year). 1990-2022 Emissions have changed by 6.2% (346.34 Gg CO2 / year). For 2022 the
changes per gas
are:

For 1990-2022 the changes per gas are: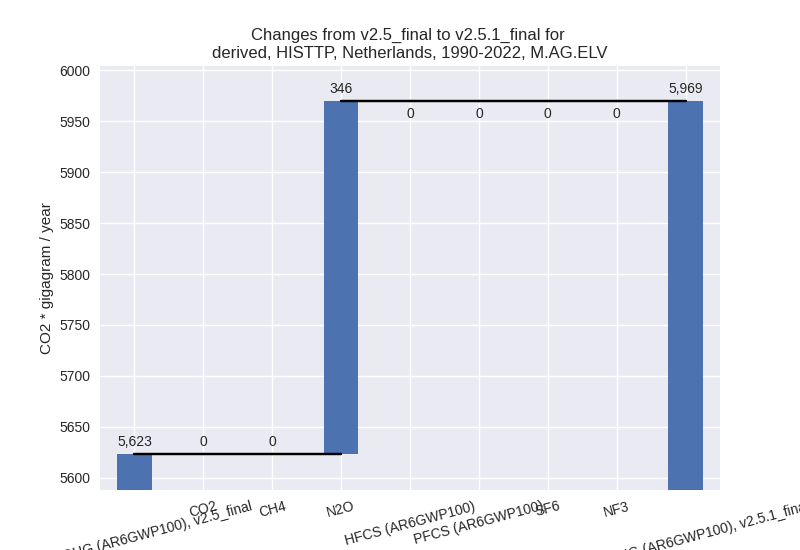
There is no subsector information available in PRIMAP-hist.
- 3.A: Total sectoral emissions in 2022 are 13406.57
Gg CO2 / year which is 72.1% of category M.AG emissions. 2022 Emissions
have changed by -7.5% (-1081.52 Gg
CO2 / year). 1990-2022 Emissions have changed by -0.3% (-38.24 Gg CO2 / year). For 2022 the
changes per gas
are:
- 4: Total sectoral emissions in 2022 are 5601.36 Gg
CO2 / year which is 2.8% of M.0.EL emissions. 2022 Emissions have
changed by 9.1% (468.73 Gg CO2 /
year). 1990-2022 Emissions have changed by 0.1% (14.20 Gg CO2 / year). For 2022 the
changes per gas
are:

- 5: Total sectoral emissions in 2022 are 241.02 Gg
CO2 / year which is 0.1% of M.0.EL emissions. 2022 Emissions have
changed by 5.3% (12.21 Gg CO2 /
year). 1990-2022 Emissions have changed by 0.1% (0.37 Gg CO2 / year). For 2022 the
changes per gas
are: