Changes in PRIMAP-hist v2.5.1_final compared to v2.5_final for NONANNEXI
2024-02-29
Johannes Gütschow
Change analysis for NONANNEXI for PRIMAP-hist v2.5.1_final compared to v2.5_final
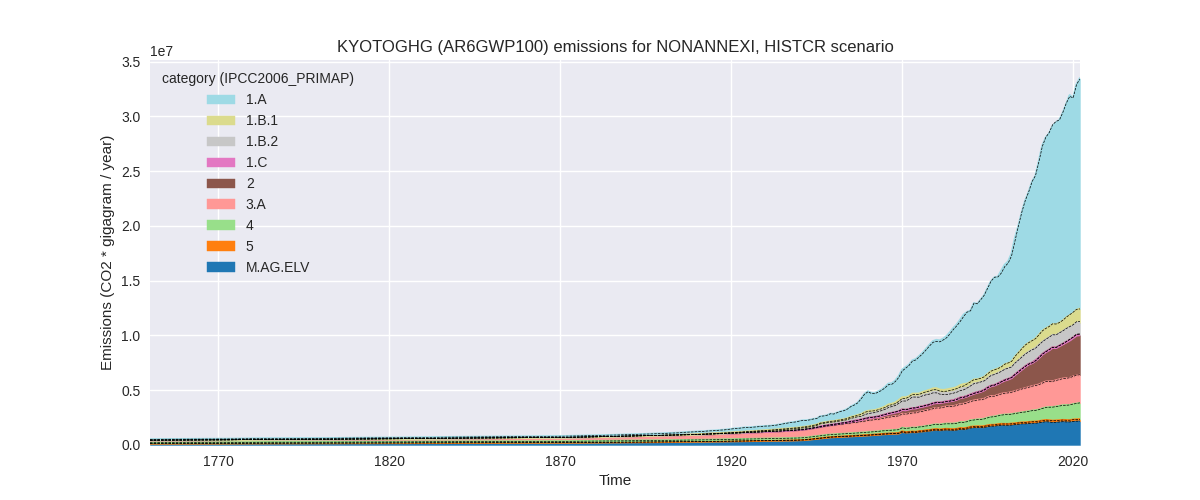
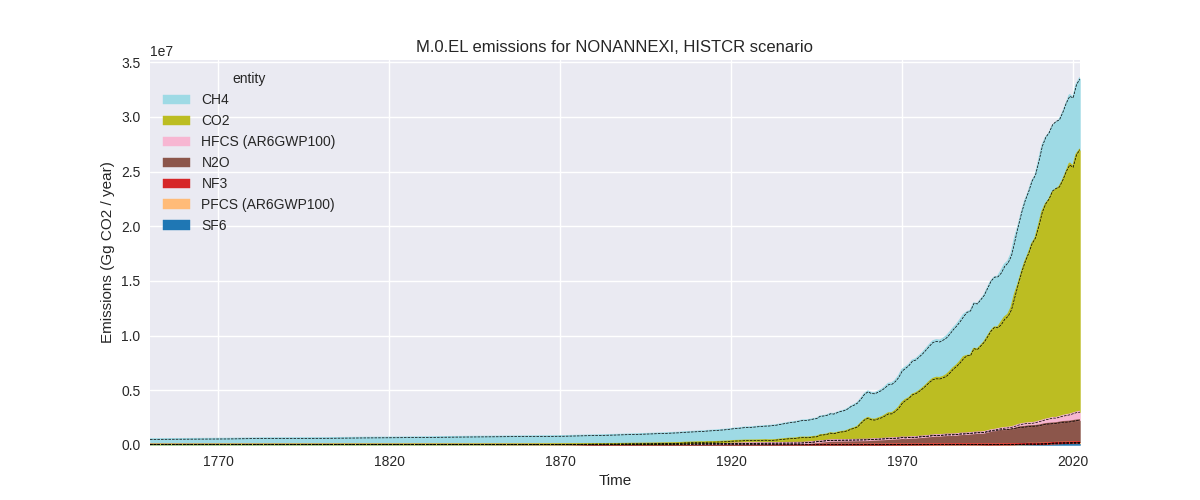
Overview over emissions by sector and gas
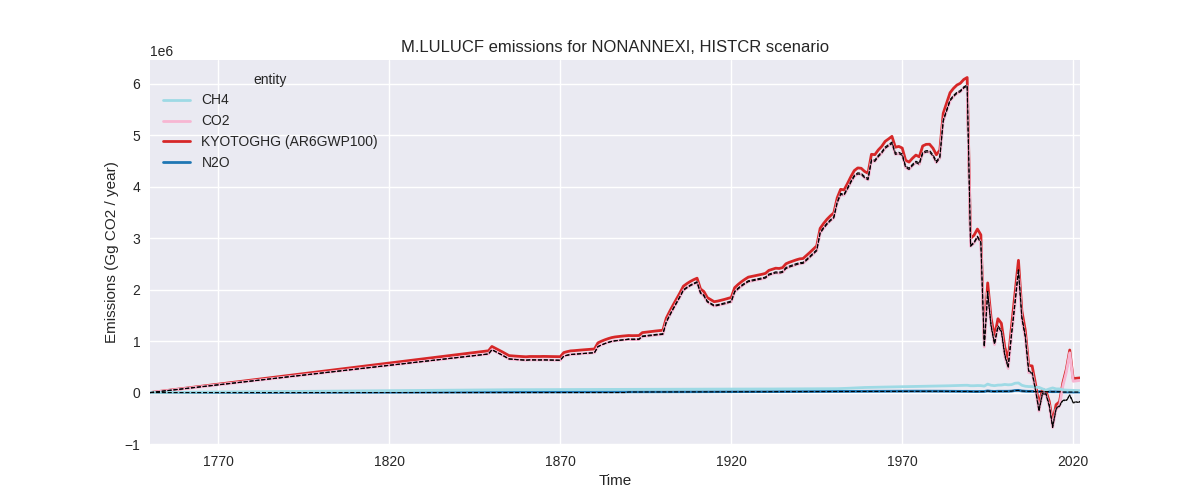
The following figures show the aggregate national total emissions excluding LULUCF AR6GWP100 for the country reported priority scenario. The dotted linesshow the v2.5_final data.
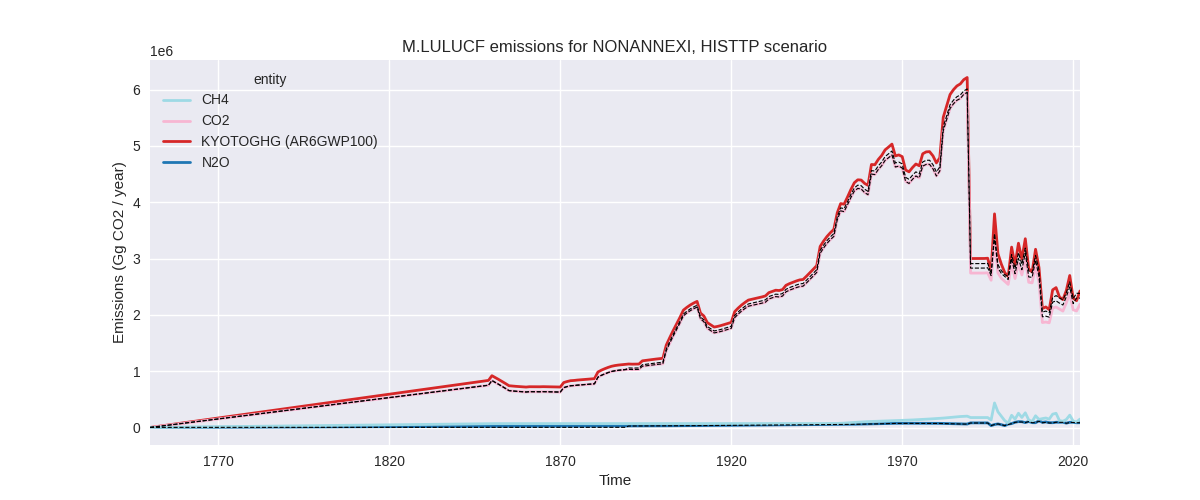
The following figures show the aggregate national total emissions excluding LULUCF AR6GWP100 for the third party priority scenario. The dotted linesshow the v2.5_final data.


Overview over changes
In the country reported priority scenario we have the following changes for aggregate Kyoto GHG and national total emissions excluding LULUCF (M.0.EL):
- Emissions in 2022 have changed by 0.2%% (59160.00 Gg CO2 / year)
- Emissions in 1990-2022 have changed by -0.0%% (-862.45 Gg CO2 / year)
In the third party priority scenario we have the following changes for aggregate Kyoto GHG and national total emissions excluding LULUCF (M.0.EL):
- Emissions in 2022 have changed by 0.6%% (217961.00 Gg CO2 / year)
- Emissions in 1990-2022 have changed by -0.0%% (-1011.79 Gg CO2 / year)
Most important changes per scenario and time frame
In the country reported priority scenario the following sector-gas combinations have the highest absolute impact on national total KyotoGHG (AR6GWP100) emissions in 2022 (top 5):
- 1: 1.B.1, CH4 with 109878.96 Gg CO2 / year (14.9%)
- 2: 2, CO2 with -79657.00 Gg CO2 / year (-3.1%)
- 3: 1.A, CO2 with 50804.00 Gg CO2 / year (0.2%)
- 4: 1.B.2, CH4 with -29677.82 Gg CO2 / year (-3.3%)
- 5: 1.B.1, CO2 with 20030.18 Gg CO2 / year (5.1%)
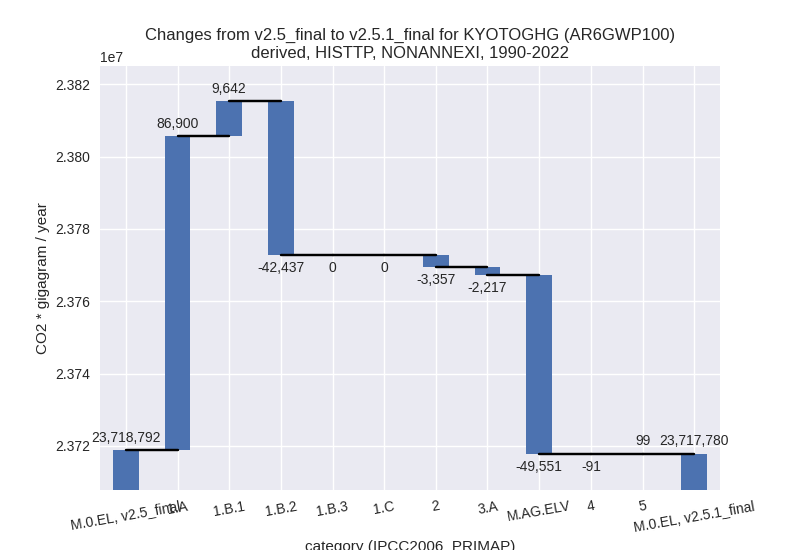
In the country reported priority scenario the following sector-gas combinations have the highest absolute impact on national total KyotoGHG (AR6GWP100) emissions in 1990-2022 (top 5):
- 1: 1.A, CO2 with 36118.58 Gg CO2 / year (0.3%)
- 2: 2, CO2 with -16313.54 Gg CO2 / year (-1.1%)
- 3: 1.B.2, CH4 with -9906.59 Gg CO2 / year (-1.2%)
- 4: M.AG.ELV, CO2 with -7734.34 Gg CO2 / year (-8.9%)
- 5: 1.B.1, CH4 with 7214.39 Gg CO2 / year (1.3%)
In the third party priority scenario the following sector-gas combinations have the highest absolute impact on national total KyotoGHG (AR6GWP100) emissions in 2022 (top 5):
- 1: 1.A, CO2 with 320994.00 Gg CO2 / year (1.5%)
- 2: 1.B.2, CH4 with -110742.07 Gg CO2 / year (-8.4%)
- 3: 1.B.1, CH4 with 54533.93 Gg CO2 / year (4.6%)
- 4: M.AG.ELV, N2O with -54517.31 Gg CO2 / year (-3.5%)
- 5: 2, CO2 with -37293.30 Gg CO2 / year (-1.6%)
In the third party priority scenario the following sector-gas combinations have the highest absolute impact on national total KyotoGHG (AR6GWP100) emissions in 1990-2022 (top 5):
- 1: 1.A, CO2 with 85700.44 Gg CO2 / year (0.6%)
- 2: 1.B.2, CH4 with -42421.43 Gg CO2 / year (-3.7%)
- 3: M.AG.ELV, N2O with -38073.84 Gg CO2 / year (-3.0%)
- 4: 1.B.1, CH4 with 18080.95 Gg CO2 / year (2.4%)
- 5: M.AG.ELV, CO2 with -10589.00 Gg CO2 / year (-11.1%)
Notes on data changes
No country specific notes present for this changelog.
Changes by sector and gas
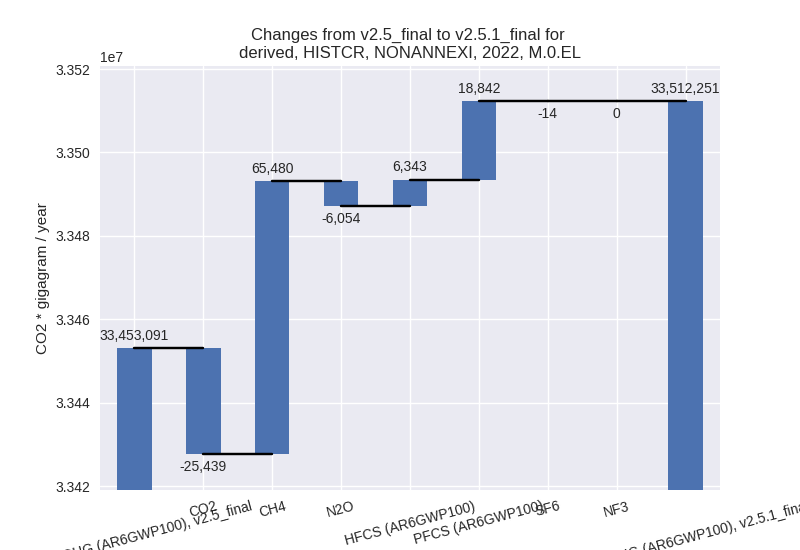
For each scenario and time frame the changes are displayed for all individual sectors and all individual gases. In the sector plot we use aggregate Kyoto GHGs in AR6GWP100. In the gas plot we usenational total emissions without LULUCF. ## country reported scenario
2022

1990-2022


third party scenario
2022

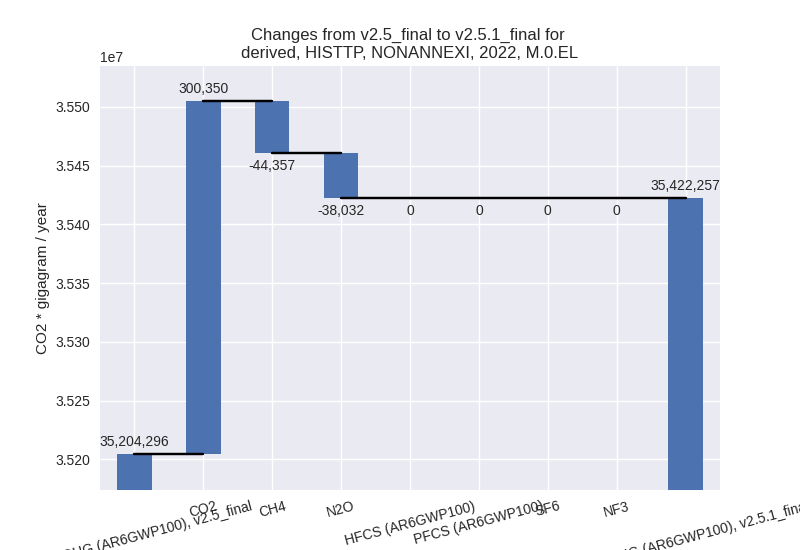
1990-2022

Detailed changes for the scenarios:
country reported scenario (HISTCR):
Most important changes per time frame
For 2022 the following sector-gas combinations have the highest absolute impact on national total KyotoGHG (AR6GWP100) emissions in 2022 (top 5):
- 1: 1.B.1, CH4 with 109878.96 Gg CO2 / year (14.9%)
- 2: 2, CO2 with -79657.00 Gg CO2 / year (-3.1%)
- 3: 1.A, CO2 with 50804.00 Gg CO2 / year (0.2%)
- 4: 1.B.2, CH4 with -29677.82 Gg CO2 / year (-3.3%)
- 5: 1.B.1, CO2 with 20030.18 Gg CO2 / year (5.1%)
For 1990-2022 the following sector-gas combinations have the highest absolute impact on national total KyotoGHG (AR6GWP100) emissions in 1990-2022 (top 5):
- 1: 1.A, CO2 with 36118.58 Gg CO2 / year (0.3%)
- 2: 2, CO2 with -16313.54 Gg CO2 / year (-1.1%)
- 3: 1.B.2, CH4 with -9906.59 Gg CO2 / year (-1.2%)
- 4: M.AG.ELV, CO2 with -7734.34 Gg CO2 / year (-8.9%)
- 5: 1.B.1, CH4 with 7214.39 Gg CO2 / year (1.3%)
Changes in the main sectors for aggregate KyotoGHG (AR6GWP100) are
- 1: Total sectoral emissions in 2022 are 23467400.00 Gg CO2 / year which is 70.0% of M.0.EL emissions. 2022 Emissions have changed by 0.6% (137397.00 Gg CO2 / year). 1990-2022 Emissions have changed by 0.2% (26165.04 Gg CO2 / year).
- 2: Total sectoral emissions in 2022 are 3650891.00 Gg CO2 / year which is 10.9% of M.0.EL emissions. 2022 Emissions have changed by -1.4% (-52000.90 Gg CO2 / year). 1990-2022 Emissions have changed by -0.6% (-12620.86 Gg CO2 / year).
- M.AG: Total sectoral emissions in 2022 are 4743510.70 Gg CO2 / year which is 14.2% of M.0.EL emissions. 2022 Emissions have changed by -0.2% (-7209.70 Gg CO2 / year). 1990-2022 Emissions have changed by -0.3% (-13076.67 Gg CO2 / year).
- 4: Total sectoral emissions in 2022 are 1483667.40 Gg CO2 / year which is 4.4% of M.0.EL emissions. 2022 Emissions have changed by -1.5% (-22299.20 Gg CO2 / year). 1990-2022 Emissions have changed by -0.1% (-1429.06 Gg CO2 / year).
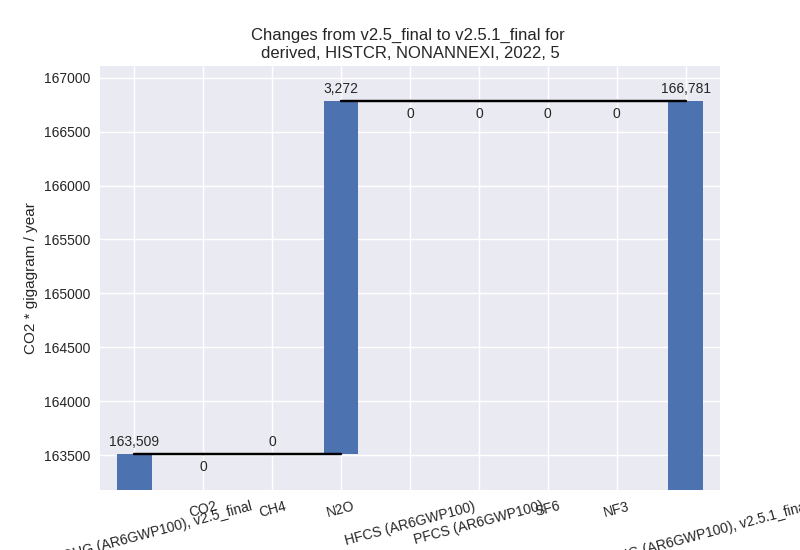
- 5: Total sectoral emissions in 2022 are 166781.46
Gg CO2 / year which is 0.5% of M.0.EL emissions. 2022 Emissions have
changed by 2.0% (3272.45 Gg CO2 /
year). 1990-2022 Emissions have changed by 0.1% (99.17 Gg CO2 / year). For 2022 the
changes per gas
are:
third party scenario (HISTTP):
Most important changes per time frame
For 2022 the following sector-gas combinations have the highest absolute impact on national total KyotoGHG (AR6GWP100) emissions in 2022 (top 5):
- 1: 1.A, CO2 with 320994.00 Gg CO2 / year (1.5%)
- 2: 1.B.2, CH4 with -110742.07 Gg CO2 / year (-8.4%)
- 3: 1.B.1, CH4 with 54533.93 Gg CO2 / year (4.6%)
- 4: M.AG.ELV, N2O with -54517.31 Gg CO2 / year (-3.5%)
- 5: 2, CO2 with -37293.30 Gg CO2 / year (-1.6%)
For 1990-2022 the following sector-gas combinations have the highest absolute impact on national total KyotoGHG (AR6GWP100) emissions in 1990-2022 (top 5):
- 1: 1.A, CO2 with 85700.44 Gg CO2 / year (0.6%)
- 2: 1.B.2, CH4 with -42421.43 Gg CO2 / year (-3.7%)
- 3: M.AG.ELV, N2O with -38073.84 Gg CO2 / year (-3.0%)
- 4: 1.B.1, CH4 with 18080.95 Gg CO2 / year (2.4%)
- 5: M.AG.ELV, CO2 with -10589.00 Gg CO2 / year (-11.1%)
Changes in the main sectors for aggregate KyotoGHG (AR6GWP100) are
- 1: Total sectoral emissions in 2022 are 24984633.00 Gg CO2 / year which is 70.5% of M.0.EL emissions. 2022 Emissions have changed by 1.2% (284821.00 Gg CO2 / year). 1990-2022 Emissions have changed by 0.3% (54104.95 Gg CO2 / year).
- 2: Total sectoral emissions in 2022 are 3467627.20 Gg CO2 / year which is 9.8% of M.0.EL emissions. 2022 Emissions have changed by -0.6% (-21927.50 Gg CO2 / year). 1990-2022 Emissions have changed by -0.2% (-3356.81 Gg CO2 / year).
- M.AG: Total sectoral emissions in 2022 are 4887890.80 Gg CO2 / year which is 13.8% of M.0.EL emissions. 2022 Emissions have changed by -0.9% (-45174.80 Gg CO2 / year). 1990-2022 Emissions have changed by -1.2% (-51767.51 Gg CO2 / year).
- 4: Total sectoral emissions in 2022 are 1913423.80 Gg CO2 / year which is 5.4% of M.0.EL emissions. 2022 Emissions have changed by -0.2% (-3029.70 Gg CO2 / year). 1990-2022 Emissions have changed by -0.0% (-91.40 Gg CO2 / year).
- 5: Total sectoral emissions in 2022 are 168682.03 Gg CO2 / year which is 0.5% of M.0.EL emissions. 2022 Emissions have changed by 2.0% (3271.78 Gg CO2 / year). 1990-2022 Emissions have changed by 0.1% (99.15 Gg CO2 / year).