Changes in PRIMAP-hist v2.5.1_final compared to v2.5_final for Norway
2024-02-29
Johannes Gütschow
Change analysis for Norway for PRIMAP-hist v2.5.1_final compared to v2.5_final
Overview over emissions by sector and gas
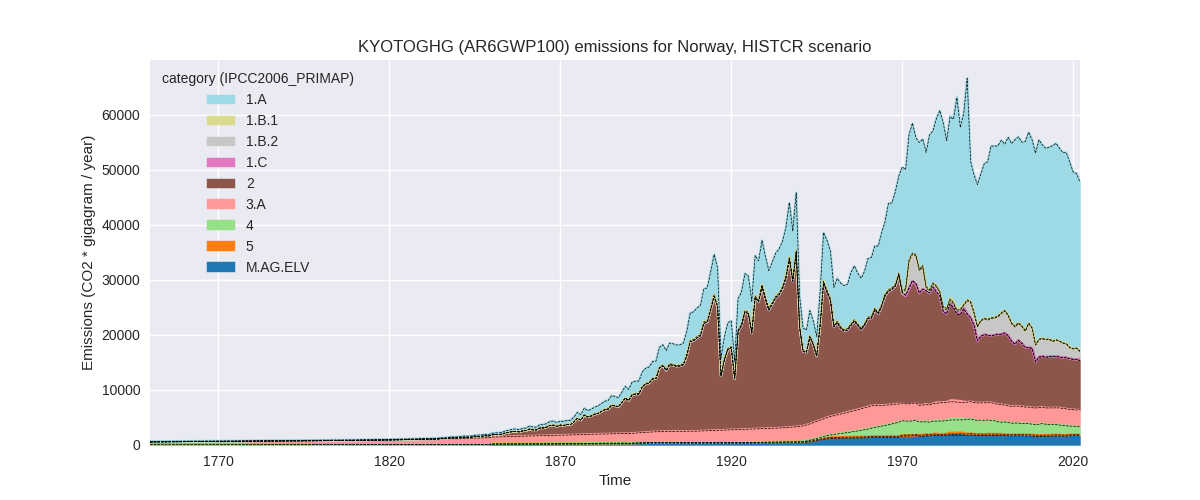
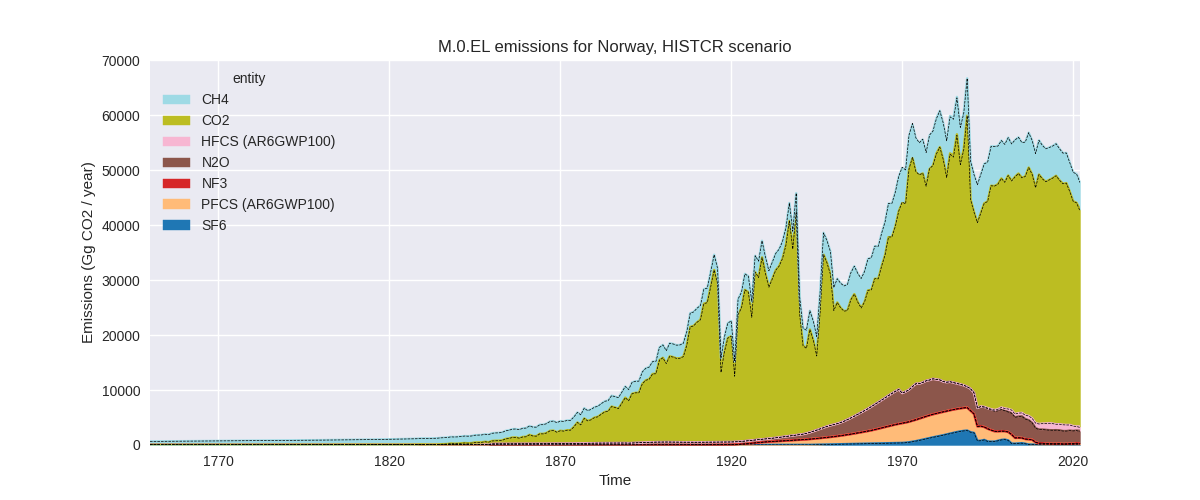
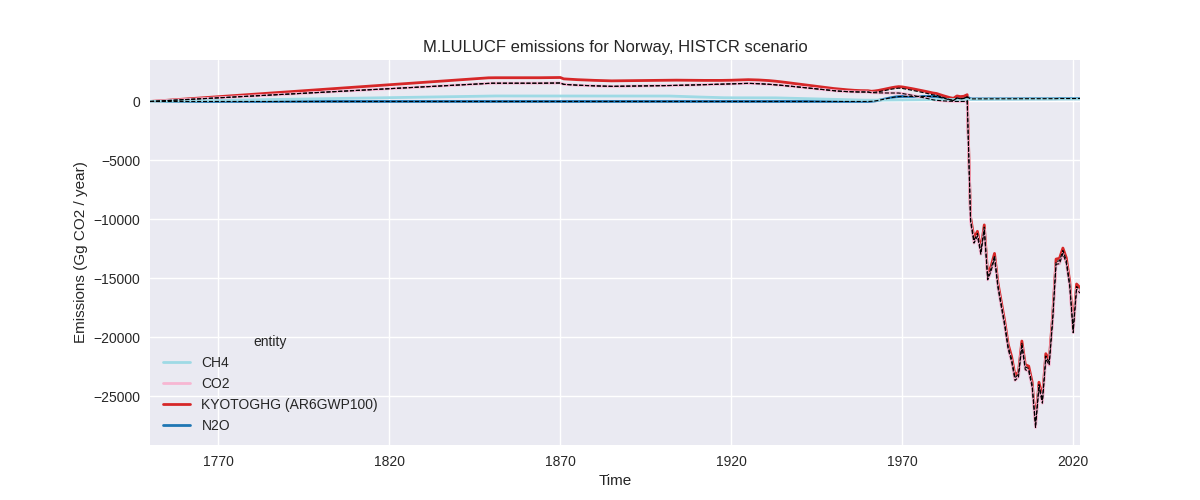
The following figures show the aggregate national total emissions excluding LULUCF AR6GWP100 for the country reported priority scenario. The dotted linesshow the v2.5_final data.
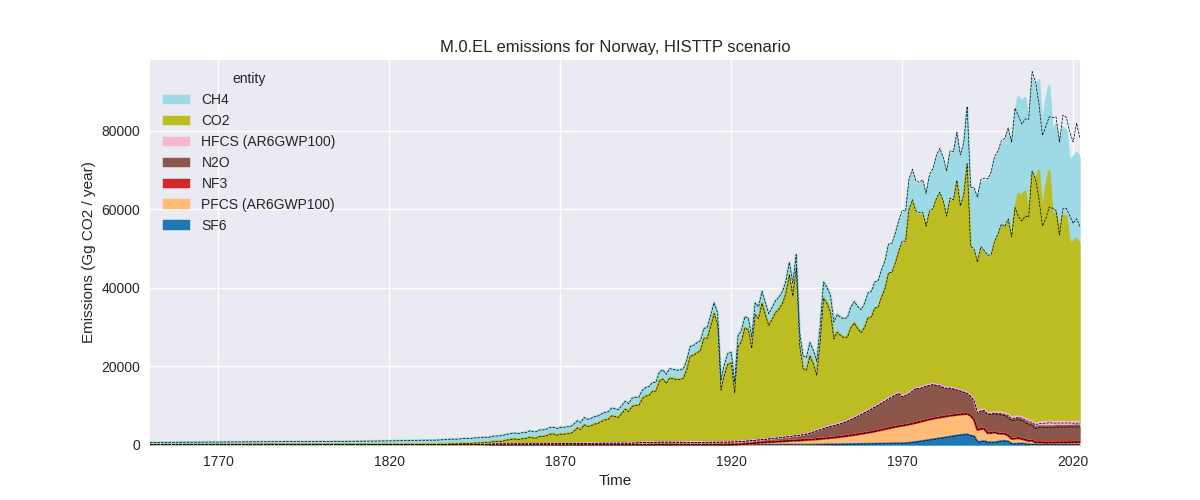
The following figures show the aggregate national total emissions excluding LULUCF AR6GWP100 for the third party priority scenario. The dotted linesshow the v2.5_final data.


Overview over changes
In the country reported priority scenario we have the following changes for aggregate Kyoto GHG and national total emissions excluding LULUCF (M.0.EL):
- Emissions in 2022 have changed by 0.6%% (298.85 Gg CO2 / year)
- Emissions in 1990-2022 have changed by 0.0%% (9.06 Gg CO2 / year)
In the third party priority scenario we have the following changes for aggregate Kyoto GHG and national total emissions excluding LULUCF (M.0.EL):
- Emissions in 2022 have changed by -6.1%% (-4736.42 Gg CO2 / year)
- Emissions in 1990-2022 have changed by -0.7%% (-534.88 Gg CO2 / year)
Most important changes per scenario and time frame
In the country reported priority scenario the following sector-gas combinations have the highest absolute impact on national total KyotoGHG (AR6GWP100) emissions in 2022 (top 5):
- 1: 2, CO2 with 161.90 Gg CO2 / year (2.1%)
- 2: 2, N2O with 157.71 Gg CO2 / year (900.2%)
- 3: 4, CO2 with -107.26 Gg CO2 / year (-38.8%)
- 4: 1.B.2, CH4 with 36.27 Gg CO2 / year (8.4%)
- 5: 4, CH4 with 24.51 Gg CO2 / year (2.1%)
In the country reported priority scenario the following sector-gas combinations have the highest absolute impact on national total KyotoGHG (AR6GWP100) emissions in 1990-2022 (top 5):
- 1: 2, CO2 with 4.91 Gg CO2 / year (0.1%)
- 2: 2, N2O with 4.78 Gg CO2 / year (0.5%)
- 3: 4, CO2 with -3.25 Gg CO2 / year (-2.5%)
- 4: 1.B.2, CH4 with 1.10 Gg CO2 / year (0.2%)
- 5: 4, CH4 with 0.74 Gg CO2 / year (0.0%)
In the third party priority scenario the following sector-gas combinations have the highest absolute impact on national total KyotoGHG (AR6GWP100) emissions in 2022 (top 5):
- 1: 1.A, CO2 with -4675.18 Gg CO2 / year (-11.2%)
- 2: 1.B.2, CH4 with -485.01 Gg CO2 / year (-2.8%)
- 3: M.AG.ELV, N2O with 255.64 Gg CO2 / year (11.9%)
- 4: 4, CH4 with 124.21 Gg CO2 / year (7.2%)
- 5: 2, CO2 with -87.13 Gg CO2 / year (-1.1%)
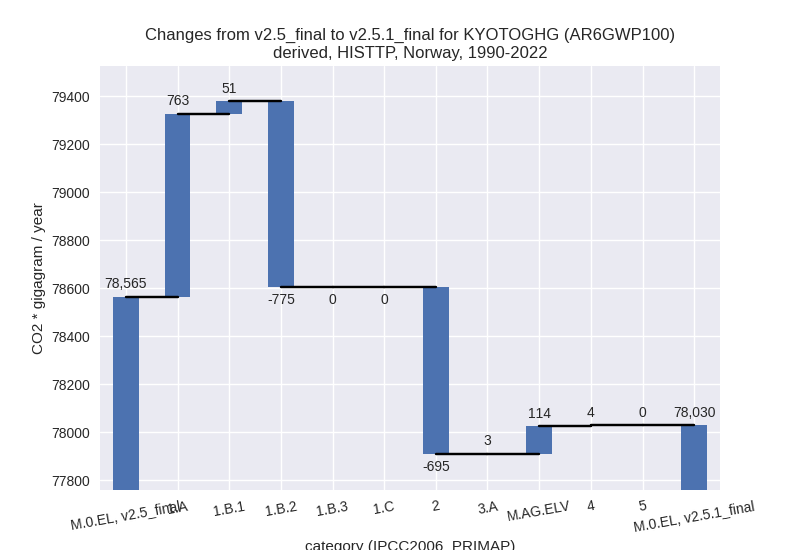
In the third party priority scenario the following sector-gas combinations have the highest absolute impact on national total KyotoGHG (AR6GWP100) emissions in 1990-2022 (top 5):
- 1: 1.B.2, CH4 with -774.83 Gg CO2 / year (-5.0%)
- 2: 1.A, CO2 with 756.56 Gg CO2 / year (1.9%)
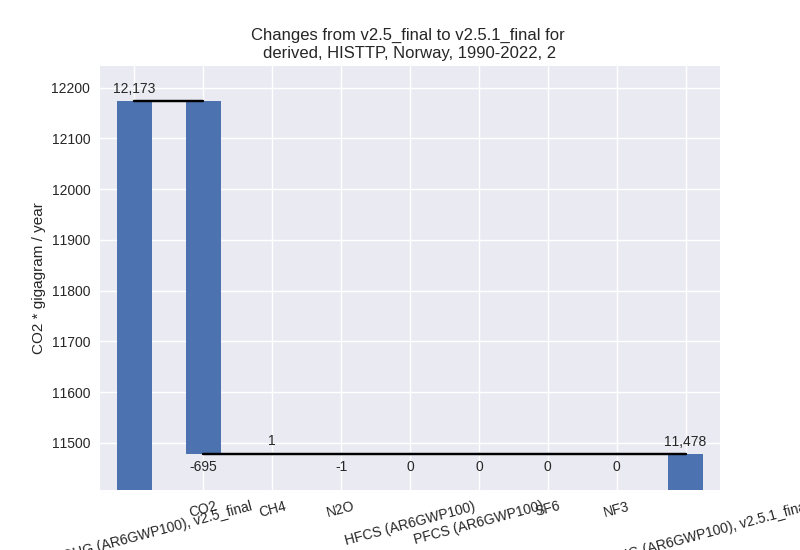
- 3: 2, CO2 with -695.11 Gg CO2 / year (-8.6%)
- 4: M.AG.ELV, N2O with 235.23 Gg CO2 / year (11.1%)
- 5: M.AG.ELV, CO2 with -120.88 Gg CO2 / year (-94.1%)
Notes on data changes
Here we list notes explaining important emissions changes for the country. ’' means that the following text only applies to the TP time series, while means that it only applies to the CR scenario. Otherwise the note applies to both scenarios.
- 1.A, CO2: New CDIAC emissions introduce changes for several years including lower emissions starting 2017.
Changes by sector and gas
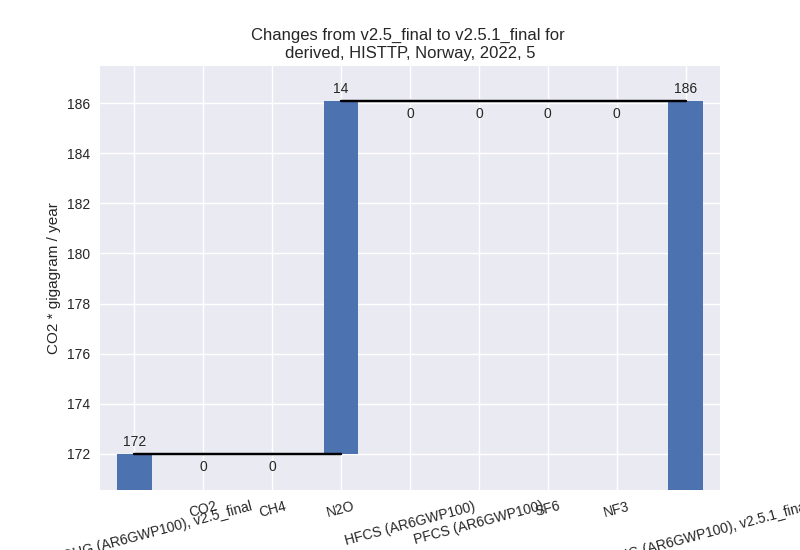
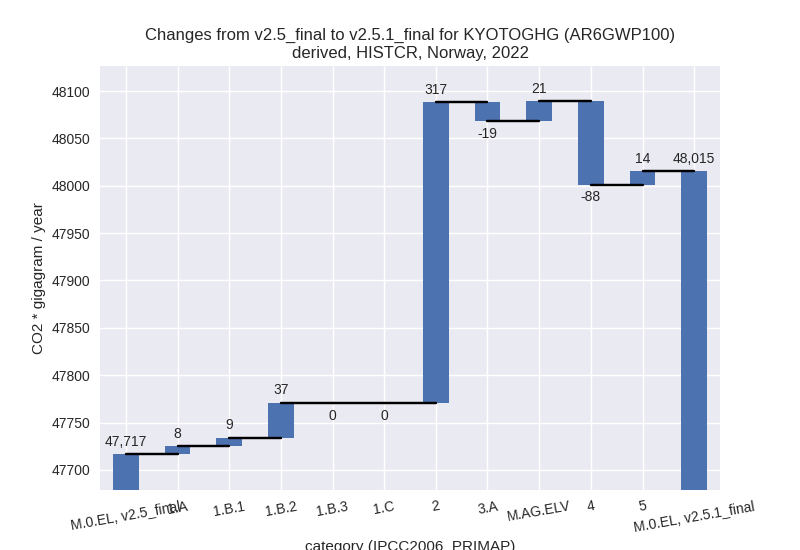
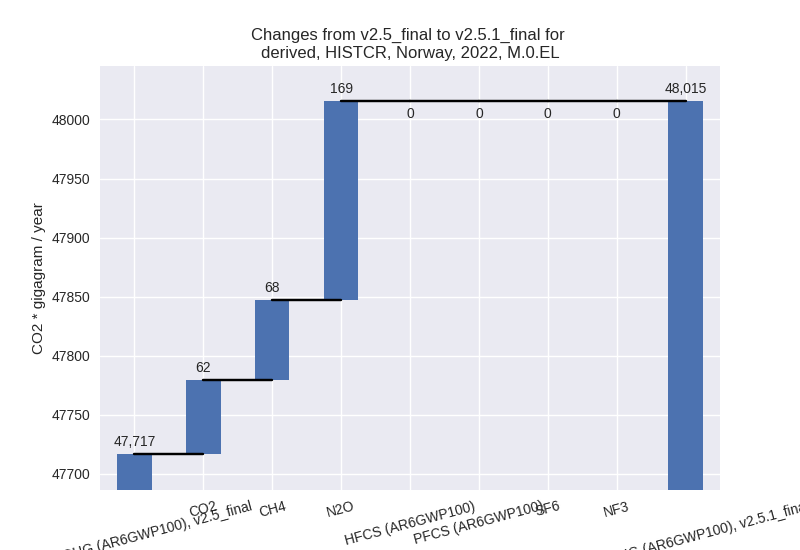
For each scenario and time frame the changes are displayed for all individual sectors and all individual gases. In the sector plot we use aggregate Kyoto GHGs in AR6GWP100. In the gas plot we usenational total emissions without LULUCF. ## country reported scenario
2022
1990-2022


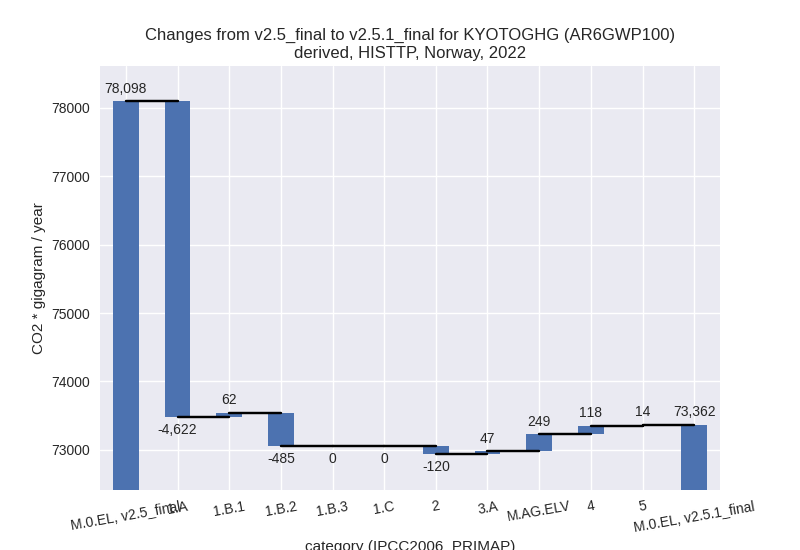
third party scenario
2022

1990-2022

Detailed changes for the scenarios:
country reported scenario (HISTCR):
Most important changes per time frame
For 2022 the following sector-gas combinations have the highest absolute impact on national total KyotoGHG (AR6GWP100) emissions in 2022 (top 5):
- 1: 2, CO2 with 161.90 Gg CO2 / year (2.1%)
- 2: 2, N2O with 157.71 Gg CO2 / year (900.2%)
- 3: 4, CO2 with -107.26 Gg CO2 / year (-38.8%)
- 4: 1.B.2, CH4 with 36.27 Gg CO2 / year (8.4%)
- 5: 4, CH4 with 24.51 Gg CO2 / year (2.1%)
For 1990-2022 the following sector-gas combinations have the highest absolute impact on national total KyotoGHG (AR6GWP100) emissions in 1990-2022 (top 5):
- 1: 2, CO2 with 4.91 Gg CO2 / year (0.1%)
- 2: 2, N2O with 4.78 Gg CO2 / year (0.5%)
- 3: 4, CO2 with -3.25 Gg CO2 / year (-2.5%)
- 4: 1.B.2, CH4 with 1.10 Gg CO2 / year (0.2%)
- 5: 4, CH4 with 0.74 Gg CO2 / year (0.0%)
Changes in the main sectors for aggregate KyotoGHG (AR6GWP100) are
- 1: Total sectoral emissions in 2022 are 32413.86 Gg CO2 / year which is 67.5% of M.0.EL emissions. 2022 Emissions have changed by 0.2% (54.11 Gg CO2 / year). 1990-2022 Emissions have changed by 0.0% (1.64 Gg CO2 / year).
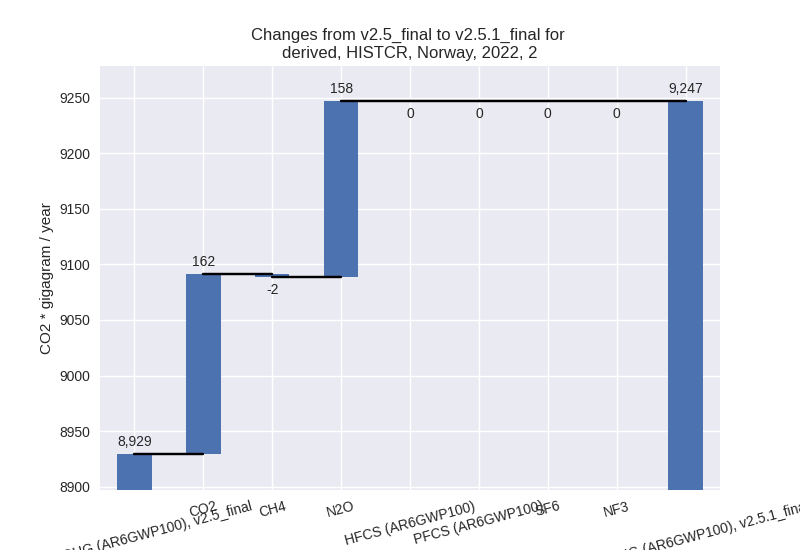
- 2: Total sectoral emissions in 2022 are 9246.59 Gg
CO2 / year which is 19.3% of M.0.EL emissions. 2022 Emissions have
changed by 3.6% (317.33 Gg CO2 /
year). 1990-2022 Emissions have changed by 0.1% (9.62 Gg CO2 / year). For 2022 the
changes per gas
are:
- M.AG: Total sectoral emissions in 2022 are 4741.04 Gg CO2 / year which is 9.9% of M.0.EL emissions. 2022 Emissions have changed by 0.0% (1.23 Gg CO2 / year). 1990-2022 Emissions have changed by 0.0% (0.04 Gg CO2 / year).
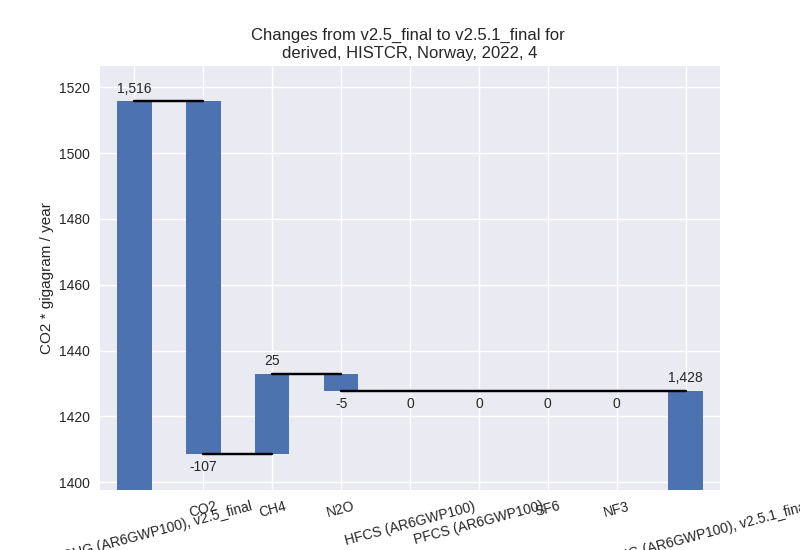
- 4: Total sectoral emissions in 2022 are 1427.85 Gg
CO2 / year which is 3.0% of M.0.EL emissions. 2022 Emissions have
changed by -5.8% (-87.92 Gg CO2 /
year). 1990-2022 Emissions have changed by -0.1% (-2.66 Gg CO2 / year). For 2022 the
changes per gas
are:
- 5: Total sectoral emissions in 2022 are 186.08 Gg
CO2 / year which is 0.4% of M.0.EL emissions. 2022 Emissions have
changed by 8.2% (14.09 Gg CO2 /
year). 1990-2022 Emissions have changed by 0.2% (0.43 Gg CO2 / year). For 2022 the
changes per gas
are:

third party scenario (HISTTP):
Most important changes per time frame
For 2022 the following sector-gas combinations have the highest absolute impact on national total KyotoGHG (AR6GWP100) emissions in 2022 (top 5):
- 1: 1.A, CO2 with -4675.18 Gg CO2 / year (-11.2%)
- 2: 1.B.2, CH4 with -485.01 Gg CO2 / year (-2.8%)
- 3: M.AG.ELV, N2O with 255.64 Gg CO2 / year (11.9%)
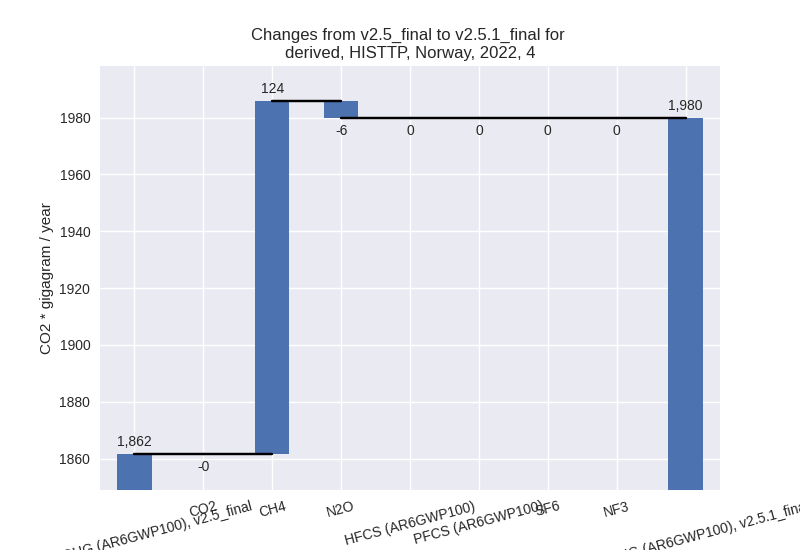
- 4: 4, CH4 with 124.21 Gg CO2 / year (7.2%)
- 5: 2, CO2 with -87.13 Gg CO2 / year (-1.1%)
For 1990-2022 the following sector-gas combinations have the highest absolute impact on national total KyotoGHG (AR6GWP100) emissions in 1990-2022 (top 5):
- 1: 1.B.2, CH4 with -774.83 Gg CO2 / year (-5.0%)
- 2: 1.A, CO2 with 756.56 Gg CO2 / year (1.9%)
- 3: 2, CO2 with -695.11 Gg CO2 / year (-8.6%)
- 4: M.AG.ELV, N2O with 235.23 Gg CO2 / year (11.1%)
- 5: M.AG.ELV, CO2 with -120.88 Gg CO2 / year (-94.1%)
Changes in the main sectors for aggregate KyotoGHG (AR6GWP100) are
- 1: Total sectoral emissions in 2022 are 55067.55 Gg
CO2 / year which is 75.1% of M.0.EL emissions. 2022 Emissions have
changed by -8.4% (-5044.78 Gg CO2 /
year). 1990-2022 Emissions have changed by 0.1% (39.44 Gg CO2 / year). For 2022 the
changes per gas
are:
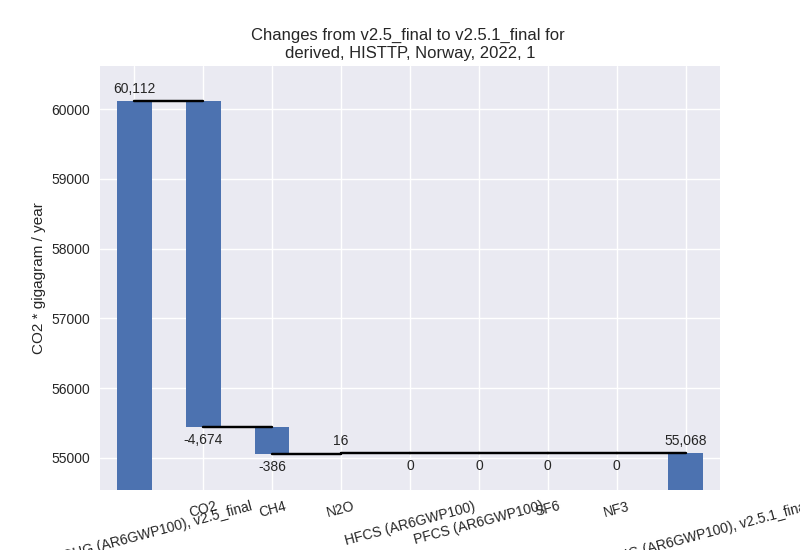
The changes come from the following subsectors:- 1.A: Total sectoral emissions in 2022 are 37577.54
Gg CO2 / year which is 68.2% of category 1 emissions. 2022 Emissions
have changed by -11.0% (-4621.69 Gg
CO2 / year). 1990-2022 Emissions have changed by 1.9% (762.93 Gg CO2 / year). For 2022 the
changes per gas
are:

There is no subsector information available in PRIMAP-hist. - 1.B.1: Total sectoral emissions in 2022 are 61.64
Gg CO2 / year which is 0.1% of category 1 emissions. 2022 Emissions have
changed by inf% (61.64 Gg CO2 /
year). 1990-2022 Emissions have changed by 9.5% (51.33 Gg CO2 / year). For 2022 the
changes per gas
are:

For 1990-2022 the changes per gas are: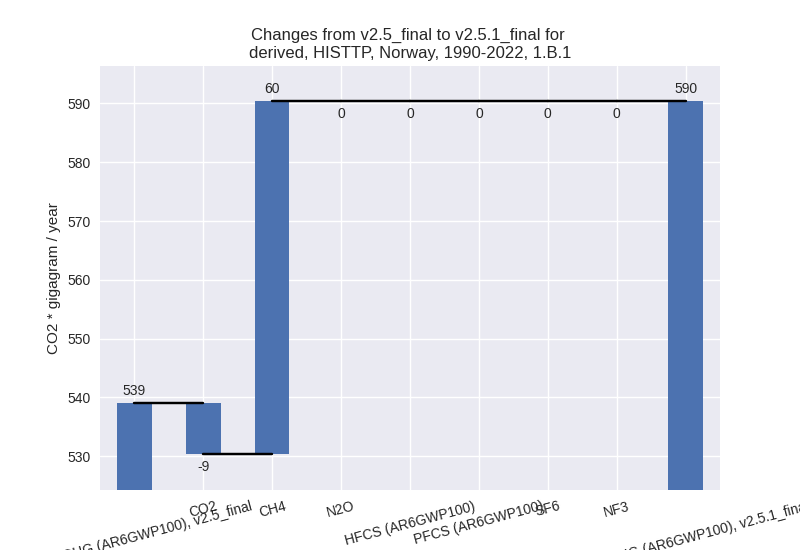
There is no subsector information available in PRIMAP-hist. - 1.B.2: Total sectoral emissions in 2022 are
17428.38 Gg CO2 / year which is 31.6% of category 1 emissions. 2022
Emissions have changed by -2.7%
(-484.73 Gg CO2 / year). 1990-2022 Emissions have changed by -4.8% (-774.82 Gg CO2 / year). For 2022
the changes per gas
are:

For 1990-2022 the changes per gas are: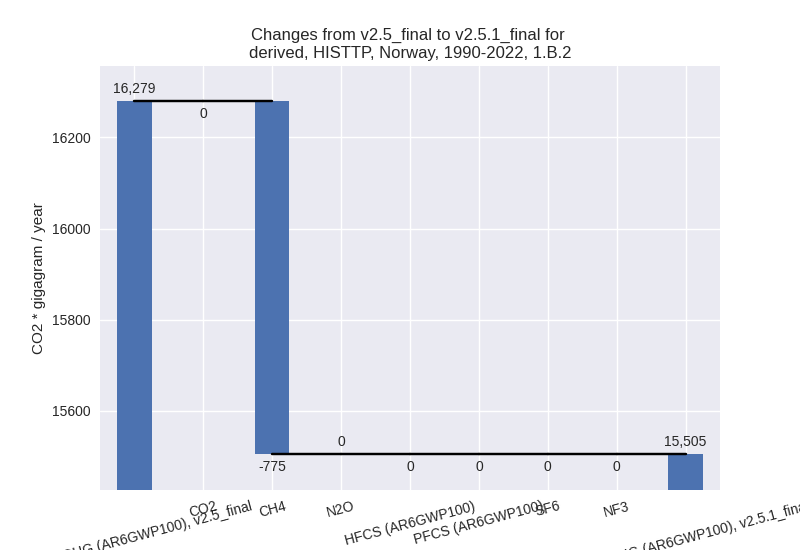
There is no subsector information available in PRIMAP-hist. - 1.C: Total sectoral emissions in 2022 are 0.00 Gg CO2 / year which is 0.0% of category 1 emissions. 2022 Emissions have changed by 0.0% (0.00 Gg CO2 / year). 1990-2022 Emissions have changed by 0.0% (0.00 Gg CO2 / year).
- 1.A: Total sectoral emissions in 2022 are 37577.54
Gg CO2 / year which is 68.2% of category 1 emissions. 2022 Emissions
have changed by -11.0% (-4621.69 Gg
CO2 / year). 1990-2022 Emissions have changed by 1.9% (762.93 Gg CO2 / year). For 2022 the
changes per gas
are:
- 2: Total sectoral emissions in 2022 are 10763.26 Gg
CO2 / year which is 14.7% of M.0.EL emissions. 2022 Emissions have
changed by -1.1% (-119.61 Gg CO2 /
year). 1990-2022 Emissions have changed by -5.7% (-695.29 Gg CO2 / year). For
1990-2022 the changes per gas
are:
- M.AG: Total sectoral emissions in 2022 are 5364.94
Gg CO2 / year which is 7.3% of M.0.EL emissions. 2022 Emissions have
changed by 5.8% (295.68 Gg CO2 /
year). 1990-2022 Emissions have changed by 2.2% (116.96 Gg CO2 / year). For 2022 the
changes per gas
are:
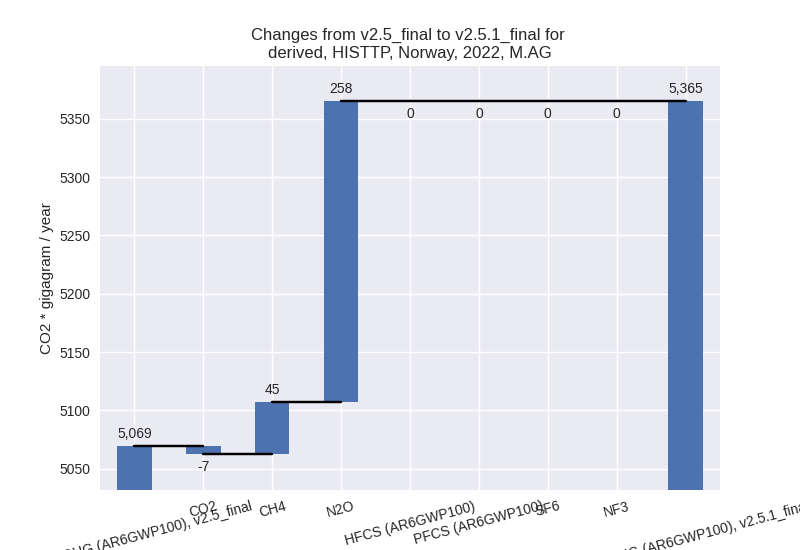
For 1990-2022 the changes per gas are: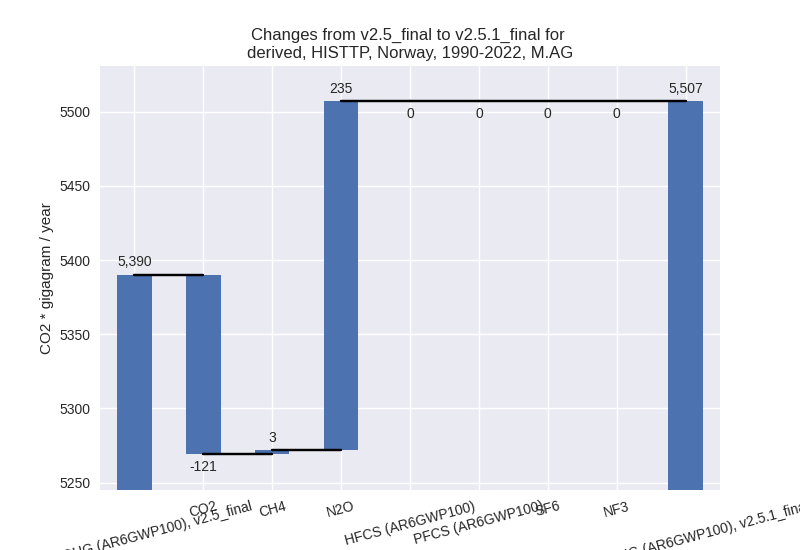
The changes come from the following subsectors:- 3.A: Total sectoral emissions in 2022 are 2960.71 Gg CO2 / year which is 55.2% of category M.AG emissions. 2022 Emissions have changed by 1.6% (47.00 Gg CO2 / year). 1990-2022 Emissions have changed by 0.1% (2.65 Gg CO2 / year).
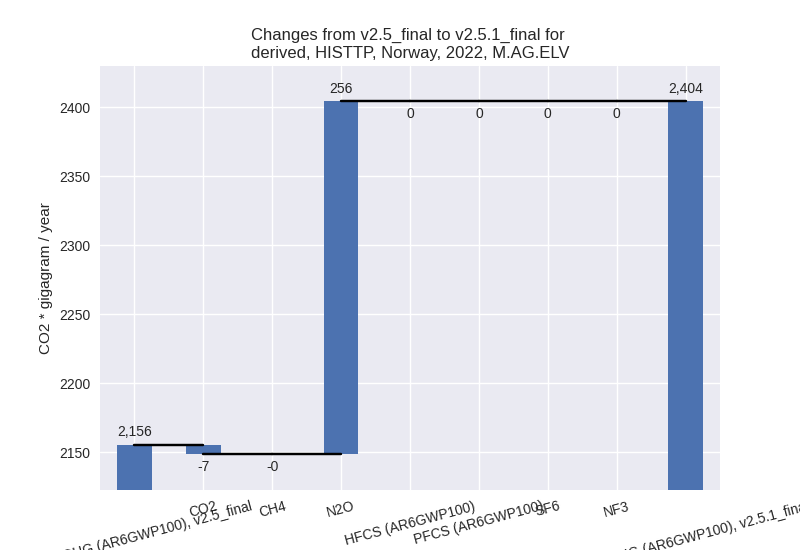
- M.AG.ELV: Total sectoral emissions in 2022 are
2404.23 Gg CO2 / year which is 44.8% of category M.AG emissions. 2022
Emissions have changed by 11.5%
(248.68 Gg CO2 / year). 1990-2022 Emissions have changed by 5.1% (114.32 Gg CO2 / year). For 2022 the
changes per gas
are:
For 1990-2022 the changes per gas are: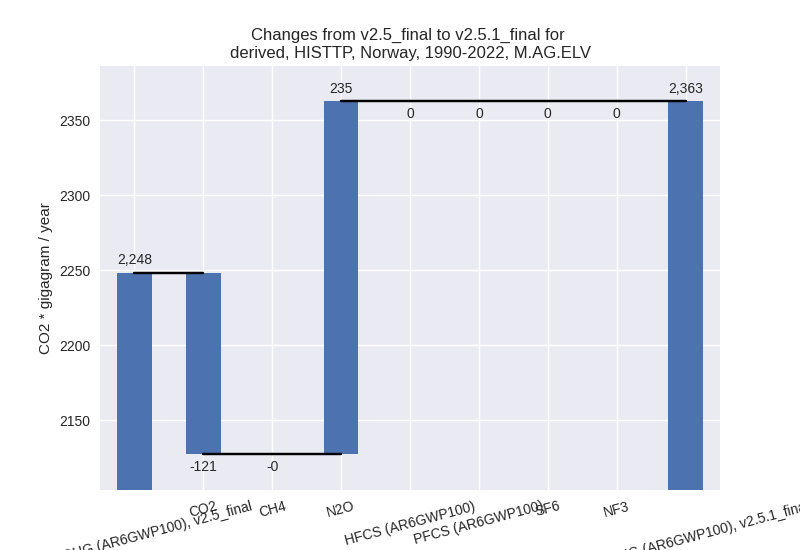
There is no subsector information available in PRIMAP-hist.
- 4: Total sectoral emissions in 2022 are 1979.81 Gg
CO2 / year which is 2.7% of M.0.EL emissions. 2022 Emissions have
changed by 6.3% (118.20 Gg CO2 /
year). 1990-2022 Emissions have changed by 0.1% (3.58 Gg CO2 / year). For 2022 the
changes per gas
are:
- 5: Total sectoral emissions in 2022 are 186.08 Gg
CO2 / year which is 0.3% of M.0.EL emissions. 2022 Emissions have
changed by 8.2% (14.09 Gg CO2 /
year). 1990-2022 Emissions have changed by 0.2% (0.43 Gg CO2 / year). For 2022 the
changes per gas
are: