Changes in PRIMAP-hist v2.5.1_final compared to v2.5_final for New Zealand
2024-02-29
Johannes Gütschow
Change analysis for New Zealand for PRIMAP-hist v2.5.1_final compared to v2.5_final
Overview over emissions by sector and gas
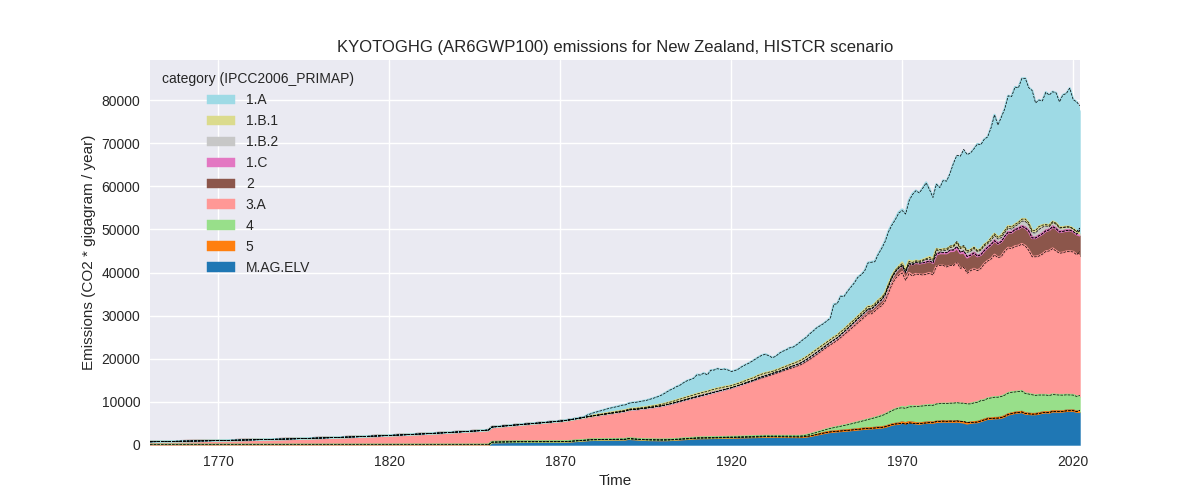
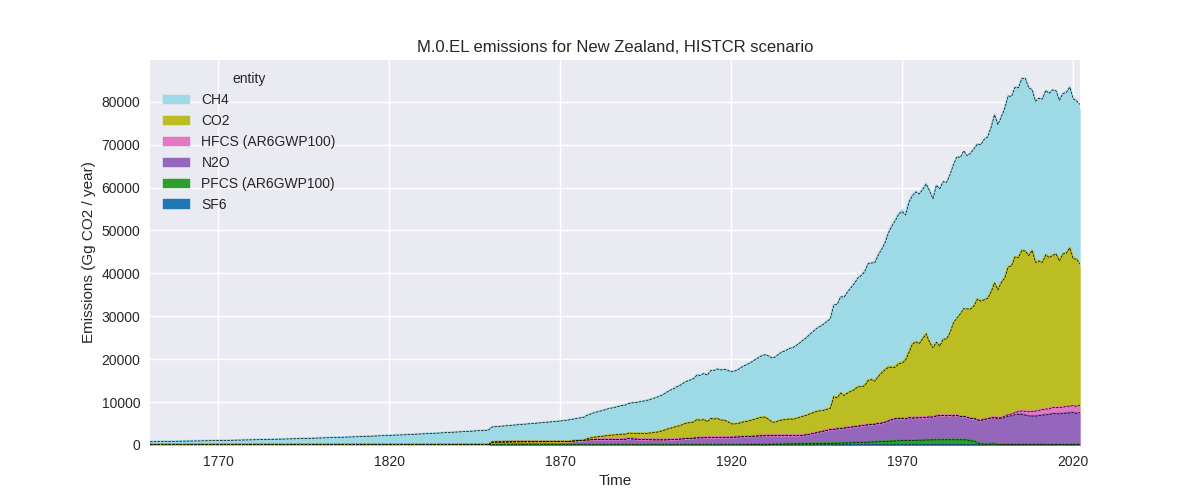
The following figures show the aggregate national total emissions excluding LULUCF AR6GWP100 for the country reported priority scenario. The dotted linesshow the v2.5_final data.

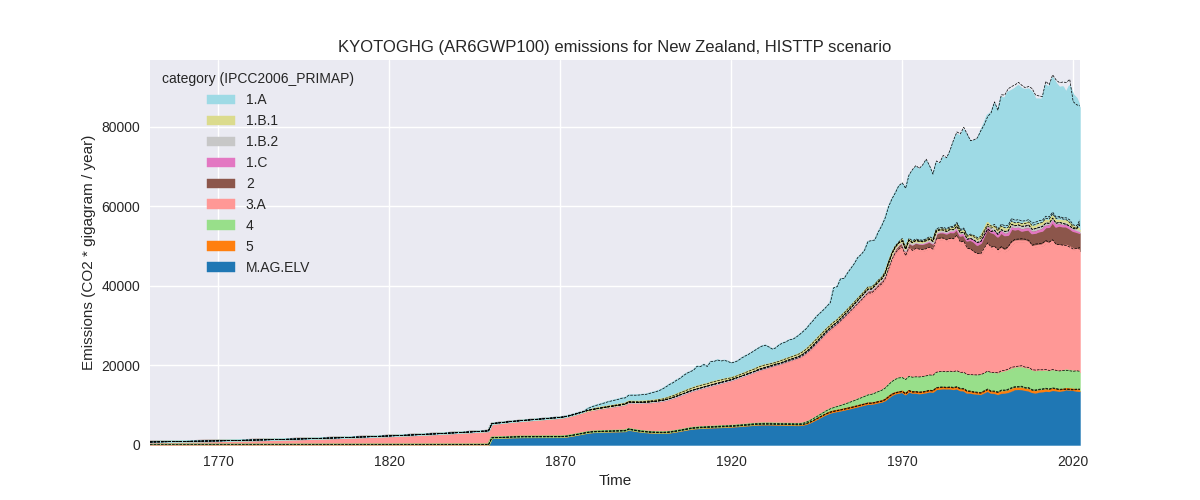
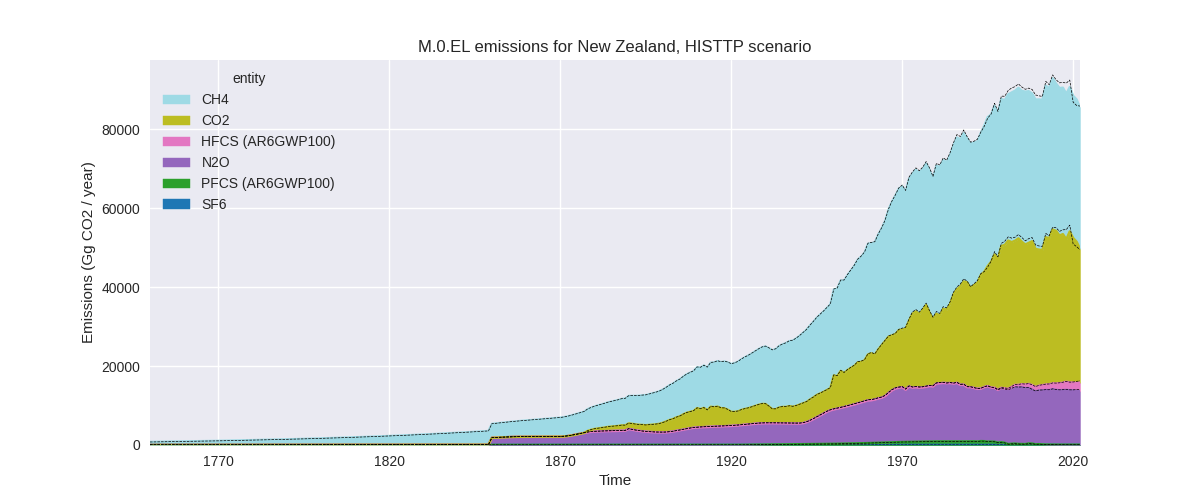
The following figures show the aggregate national total emissions excluding LULUCF AR6GWP100 for the third party priority scenario. The dotted linesshow the v2.5_final data.

Overview over changes
In the country reported priority scenario we have the following changes for aggregate Kyoto GHG and national total emissions excluding LULUCF (M.0.EL):
- Emissions in 2022 have changed by -1.5%% (-1214.68 Gg CO2 / year)
- Emissions in 1990-2022 have changed by -0.0%% (-36.81 Gg CO2 / year)
In the third party priority scenario we have the following changes for aggregate Kyoto GHG and national total emissions excluding LULUCF (M.0.EL):
- Emissions in 2022 have changed by -0.5%% (-395.67 Gg CO2 / year)
- Emissions in 1990-2022 have changed by -0.8%% (-700.88 Gg CO2 / year)
Most important changes per scenario and time frame
In the country reported priority scenario the following sector-gas combinations have the highest absolute impact on national total KyotoGHG (AR6GWP100) emissions in 2022 (top 5):
- 1: 3.A, CH4 with -831.95 Gg CO2 / year (-2.5%)
- 2: M.AG.ELV, N2O with -311.72 Gg CO2 / year (-4.4%)
- 3: 1.B.2, CO2 with -161.73 Gg CO2 / year (-49.8%)
- 4: 4, CH4 with 160.53 Gg CO2 / year (5.1%)
- 5: M.AG.ELV, CO2 with -83.10 Gg CO2 / year (-8.5%)
In the country reported priority scenario the following sector-gas combinations have the highest absolute impact on national total KyotoGHG (AR6GWP100) emissions in 1990-2022 (top 5):
- 1: 3.A, CH4 with -25.21 Gg CO2 / year (-0.1%)
- 2: M.AG.ELV, N2O with -9.45 Gg CO2 / year (-0.2%)
- 3: 1.B.2, CO2 with -4.90 Gg CO2 / year (-1.0%)
- 4: 4, CH4 with 4.86 Gg CO2 / year (0.1%)
- 5: M.AG.ELV, CO2 with -2.52 Gg CO2 / year (-0.3%)
In the third party priority scenario the following sector-gas combinations have the highest absolute impact on national total KyotoGHG (AR6GWP100) emissions in 2022 (top 5):
- 1: 1.A, CO2 with 2079.78 Gg CO2 / year (7.4%)
- 2: 2, CO2 with -1156.71 Gg CO2 / year (-34.4%)
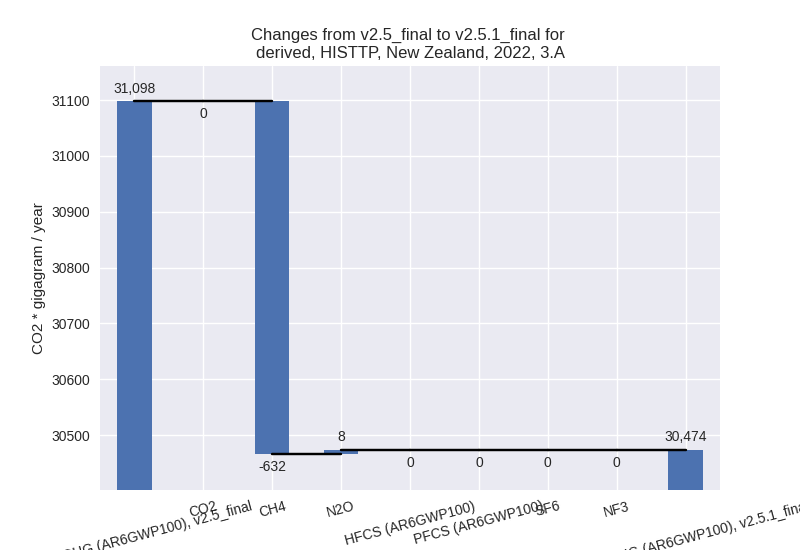
- 3: 3.A, CH4 with -632.18 Gg CO2 / year (-2.1%)
- 4: M.AG.ELV, N2O with -432.47 Gg CO2 / year (-3.3%)
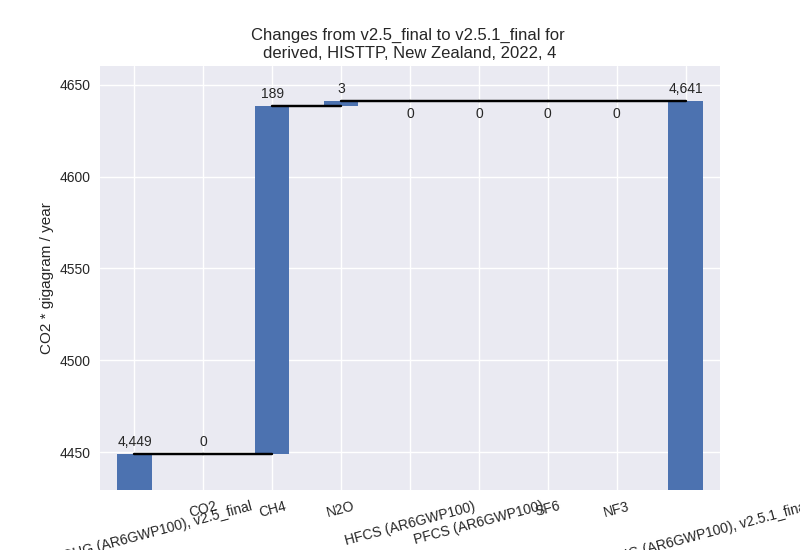
- 5: 4, CH4 with 189.46 Gg CO2 / year (4.4%)
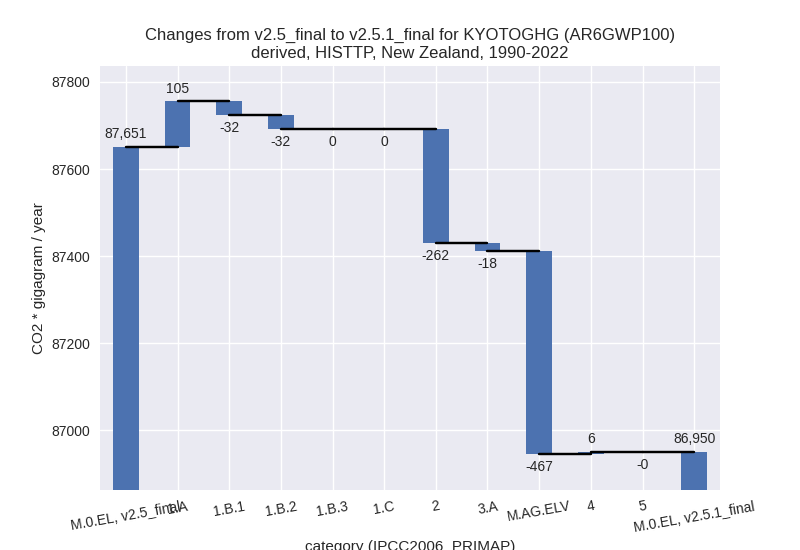
In the third party priority scenario the following sector-gas combinations have the highest absolute impact on national total KyotoGHG (AR6GWP100) emissions in 1990-2022 (top 5):
- 1: M.AG.ELV, CO2 with -341.86 Gg CO2 / year (-37.1%)
- 2: 2, CO2 with -269.46 Gg CO2 / year (-9.8%)
- 3: M.AG.ELV, N2O with -125.20 Gg CO2 / year (-1.0%)
- 4: 1.A, CO2 with 116.22 Gg CO2 / year (0.4%)
- 5: 1.B.2, CH4 with -27.35 Gg CO2 / year (-3.4%)
Notes on data changes
No country specific notes present for this changelog.
Changes by sector and gas
For each scenario and time frame the changes are displayed for all individual sectors and all individual gases. In the sector plot we use aggregate Kyoto GHGs in AR6GWP100. In the gas plot we usenational total emissions without LULUCF. ## country reported scenario
2022

1990-2022

third party scenario
2022
1990-2022

Detailed changes for the scenarios:
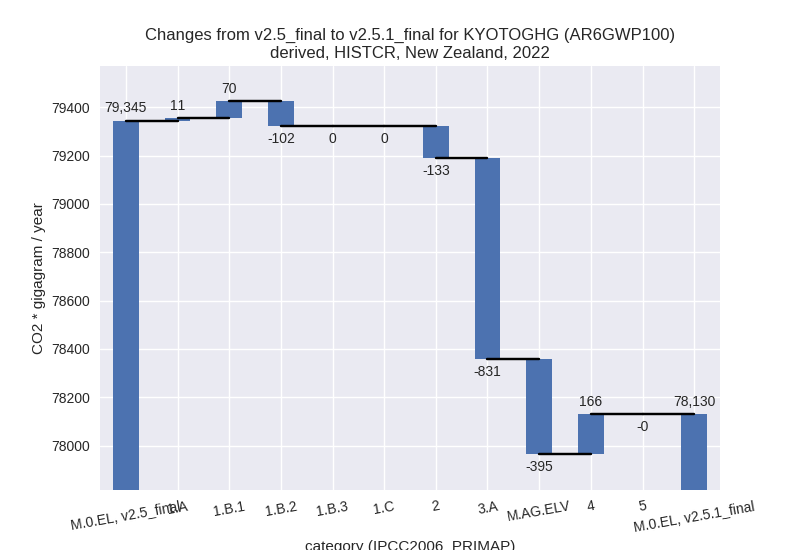
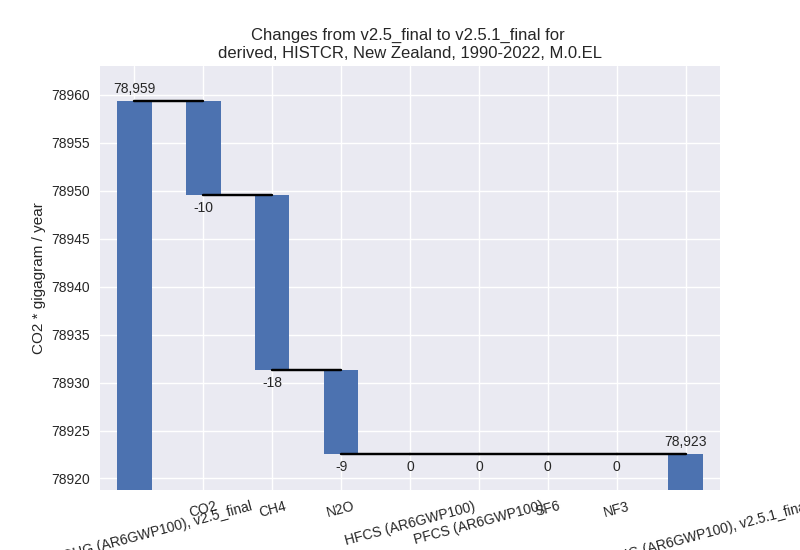
country reported scenario (HISTCR):
Most important changes per time frame
For 2022 the following sector-gas combinations have the highest absolute impact on national total KyotoGHG (AR6GWP100) emissions in 2022 (top 5):
- 1: 3.A, CH4 with -831.95 Gg CO2 / year (-2.5%)
- 2: M.AG.ELV, N2O with -311.72 Gg CO2 / year (-4.4%)
- 3: 1.B.2, CO2 with -161.73 Gg CO2 / year (-49.8%)
- 4: 4, CH4 with 160.53 Gg CO2 / year (5.1%)
- 5: M.AG.ELV, CO2 with -83.10 Gg CO2 / year (-8.5%)
For 1990-2022 the following sector-gas combinations have the highest absolute impact on national total KyotoGHG (AR6GWP100) emissions in 1990-2022 (top 5):
- 1: 3.A, CH4 with -25.21 Gg CO2 / year (-0.1%)
- 2: M.AG.ELV, N2O with -9.45 Gg CO2 / year (-0.2%)
- 3: 1.B.2, CO2 with -4.90 Gg CO2 / year (-1.0%)
- 4: 4, CH4 with 4.86 Gg CO2 / year (0.1%)
- 5: M.AG.ELV, CO2 with -2.52 Gg CO2 / year (-0.3%)
Changes in the main sectors for aggregate KyotoGHG (AR6GWP100) are
- 1: Total sectoral emissions in 2022 are 29500.14 Gg CO2 / year which is 37.8% of M.0.EL emissions. 2022 Emissions have changed by -0.1% (-21.74 Gg CO2 / year). 1990-2022 Emissions have changed by -0.0% (-0.66 Gg CO2 / year).
- 2: Total sectoral emissions in 2022 are 4825.32 Gg
CO2 / year which is 6.2% of M.0.EL emissions. 2022 Emissions have
changed by -2.7% (-132.61 Gg CO2 /
year). 1990-2022 Emissions have changed by -0.1% (-4.02 Gg CO2 / year). For 2022 the
changes per gas
are:

- M.AG: Total sectoral emissions in 2022 are 40230.57
Gg CO2 / year which is 51.5% of M.0.EL emissions. 2022 Emissions have
changed by -3.0% (-1225.85 Gg CO2 /
year). 1990-2022 Emissions have changed by -0.1% (-37.15 Gg CO2 / year). For 2022 the
changes per gas
are:
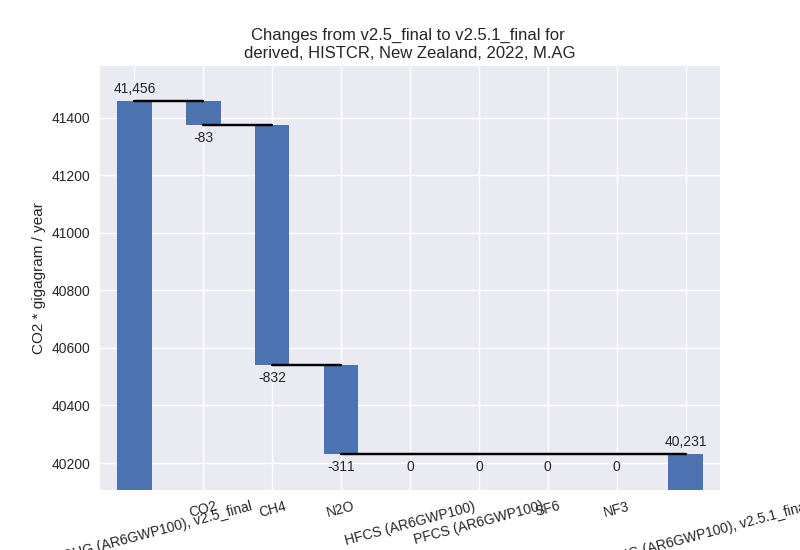
The changes come from the following subsectors:- 3.A: Total sectoral emissions in 2022 are 32553.64
Gg CO2 / year which is 80.9% of category M.AG emissions. 2022 Emissions
have changed by -2.5% (-831.33 Gg
CO2 / year). 1990-2022 Emissions have changed by -0.1% (-25.19 Gg CO2 / year). For 2022 the
changes per gas
are:

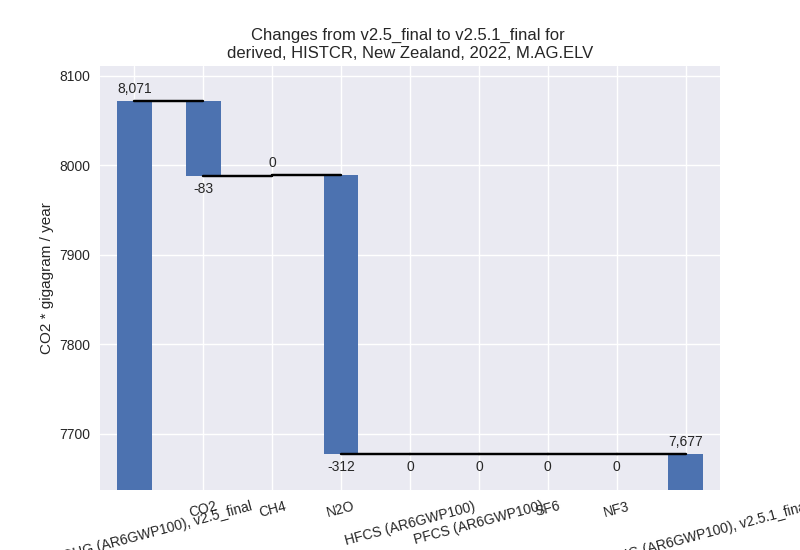
There is no subsector information available in PRIMAP-hist. - M.AG.ELV: Total sectoral emissions in 2022 are
7676.93 Gg CO2 / year which is 19.1% of category M.AG emissions. 2022
Emissions have changed by -4.9%
(-394.52 Gg CO2 / year). 1990-2022 Emissions have changed by -0.2% (-11.96 Gg CO2 / year). For 2022 the
changes per gas
are:
There is no subsector information available in PRIMAP-hist.
- 3.A: Total sectoral emissions in 2022 are 32553.64
Gg CO2 / year which is 80.9% of category M.AG emissions. 2022 Emissions
have changed by -2.5% (-831.33 Gg
CO2 / year). 1990-2022 Emissions have changed by -0.1% (-25.19 Gg CO2 / year). For 2022 the
changes per gas
are:
- 4: Total sectoral emissions in 2022 are 3570.60 Gg
CO2 / year which is 4.6% of M.0.EL emissions. 2022 Emissions have
changed by 4.9% (165.52 Gg CO2 /
year). 1990-2022 Emissions have changed by 0.1% (5.02 Gg CO2 / year). For 2022 the
changes per gas
are:

- 5: Total sectoral emissions in 2022 are 3.42 Gg CO2 / year which is 0.0% of M.0.EL emissions. 2022 Emissions have changed by -0.1% (-0.00 Gg CO2 / year). 1990-2022 Emissions have changed by -0.0% (-0.00 Gg CO2 / year).
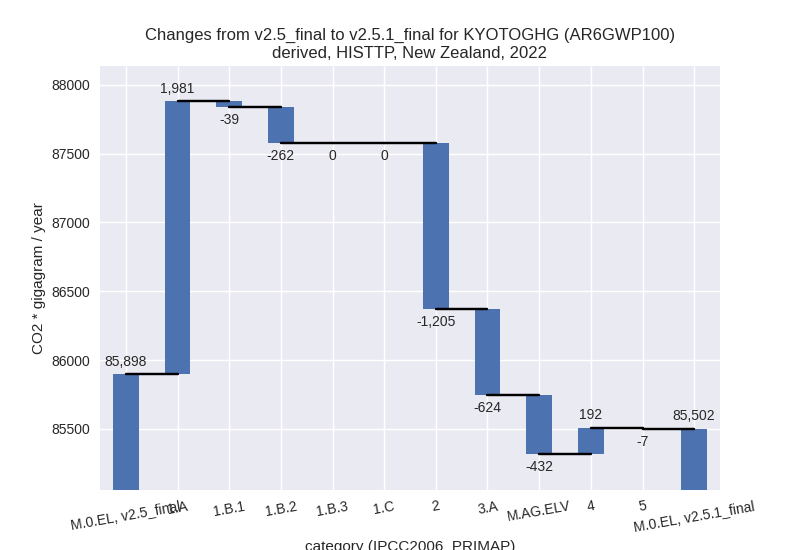
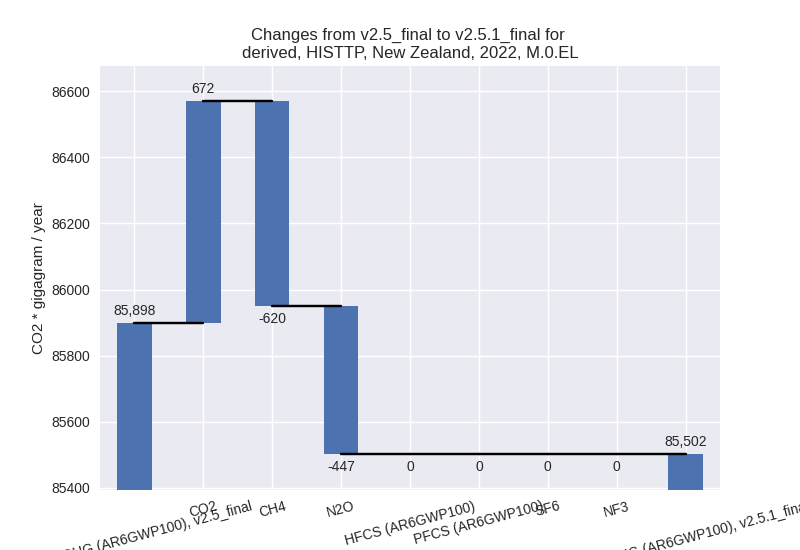
third party scenario (HISTTP):
Most important changes per time frame
For 2022 the following sector-gas combinations have the highest absolute impact on national total KyotoGHG (AR6GWP100) emissions in 2022 (top 5):
- 1: 1.A, CO2 with 2079.78 Gg CO2 / year (7.4%)
- 2: 2, CO2 with -1156.71 Gg CO2 / year (-34.4%)
- 3: 3.A, CH4 with -632.18 Gg CO2 / year (-2.1%)
- 4: M.AG.ELV, N2O with -432.47 Gg CO2 / year (-3.3%)
- 5: 4, CH4 with 189.46 Gg CO2 / year (4.4%)
For 1990-2022 the following sector-gas combinations have the highest absolute impact on national total KyotoGHG (AR6GWP100) emissions in 1990-2022 (top 5):
- 1: M.AG.ELV, CO2 with -341.86 Gg CO2 / year (-37.1%)
- 2: 2, CO2 with -269.46 Gg CO2 / year (-9.8%)
- 3: M.AG.ELV, N2O with -125.20 Gg CO2 / year (-1.0%)
- 4: 1.A, CO2 with 116.22 Gg CO2 / year (0.4%)
- 5: 1.B.2, CH4 with -27.35 Gg CO2 / year (-3.4%)
Changes in the main sectors for aggregate KyotoGHG (AR6GWP100) are
- 1: Total sectoral emissions in 2022 are 32175.37 Gg
CO2 / year which is 37.6% of M.0.EL emissions. 2022 Emissions have
changed by 5.5% (1679.90 Gg CO2 /
year). 1990-2022 Emissions have changed by 0.1% (40.95 Gg CO2 / year). For 2022 the
changes per gas
are:
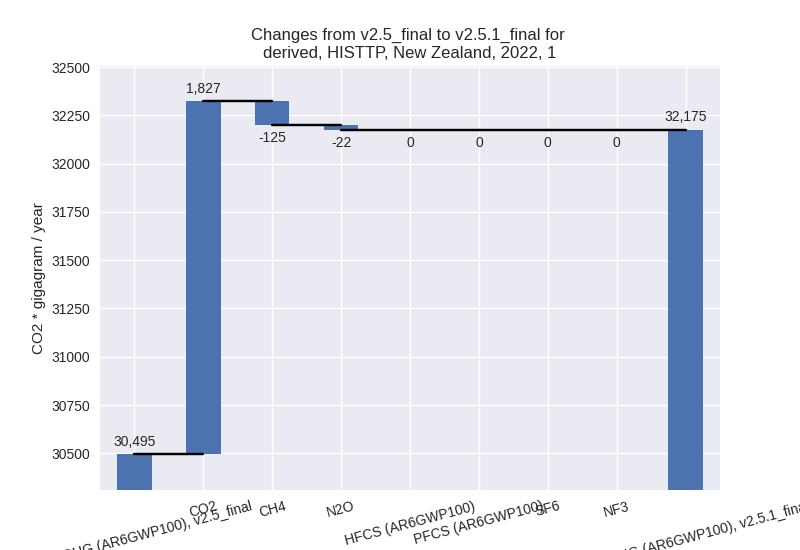
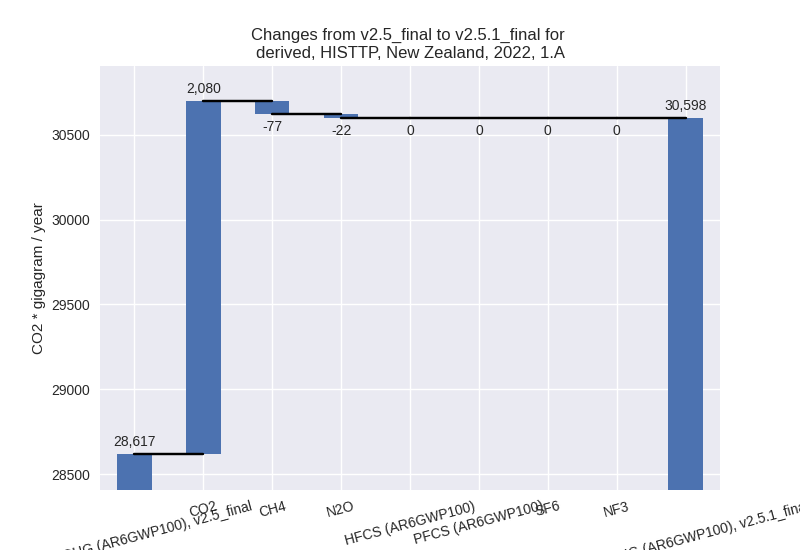
The changes come from the following subsectors:- 1.A: Total sectoral emissions in 2022 are 30598.27
Gg CO2 / year which is 97.2% of category 1 emissions. 2022 Emissions
have changed by 6.9% (1981.37 Gg CO2
/ year). 1990-2022 Emissions have changed by 0.3% (104.64 Gg CO2 / year). For 2022 the
changes per gas
are:
There is no subsector information available in PRIMAP-hist. - 1.B.1: Total sectoral emissions in 2022 are 438.02
Gg CO2 / year which is 1.4% of category 1 emissions. 2022 Emissions have
changed by -8.2% (-39.01 Gg CO2 /
year). 1990-2022 Emissions have changed by -6.3% (-31.85 Gg CO2 / year). For 2022 the
changes per gas
are:
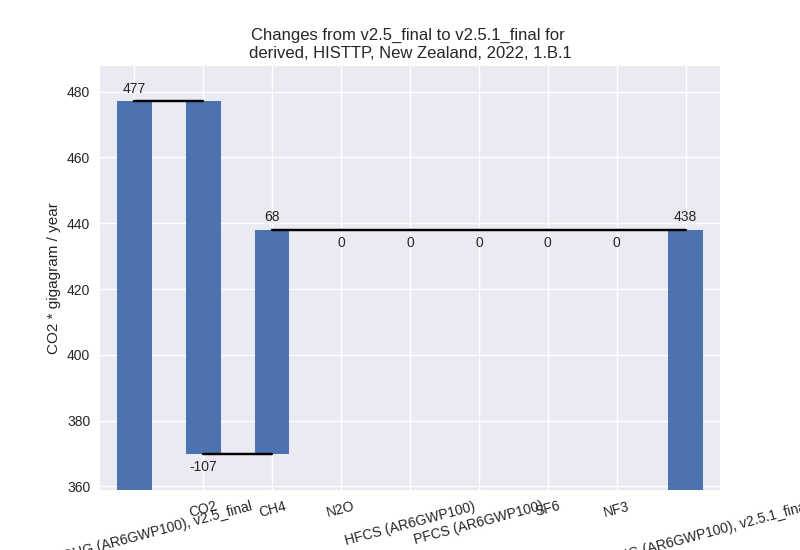
For 1990-2022 the changes per gas are: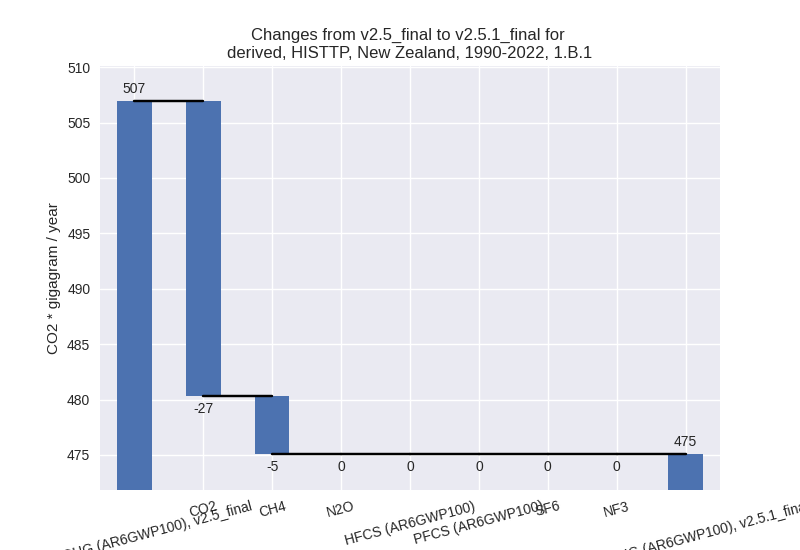
There is no subsector information available in PRIMAP-hist. - 1.B.2: Total sectoral emissions in 2022 are 456.84
Gg CO2 / year which is 1.5% of category 1 emissions. 2022 Emissions have
changed by -36.5% (-262.45 Gg CO2 /
year). 1990-2022 Emissions have changed by -3.6% (-31.84 Gg CO2 / year). For 2022 the
changes per gas
are:
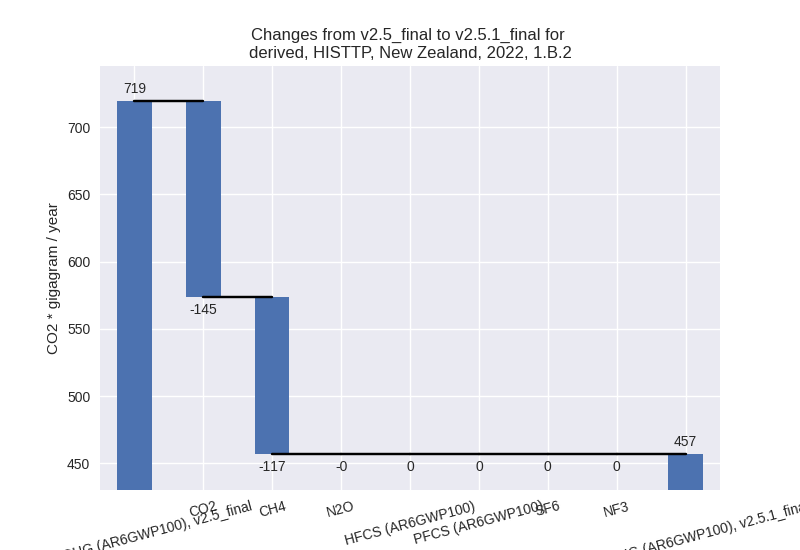
For 1990-2022 the changes per gas are:
There is no subsector information available in PRIMAP-hist.
- 1.A: Total sectoral emissions in 2022 are 30598.27
Gg CO2 / year which is 97.2% of category 1 emissions. 2022 Emissions
have changed by 6.9% (1981.37 Gg CO2
/ year). 1990-2022 Emissions have changed by 0.3% (104.64 Gg CO2 / year). For 2022 the
changes per gas
are:
- 2: Total sectoral emissions in 2022 are 4587.71 Gg
CO2 / year which is 5.4% of M.0.EL emissions. 2022 Emissions have
changed by -20.8% (-1204.57 Gg CO2 /
year). 1990-2022 Emissions have changed by -6.3% (-262.13 Gg CO2 / year). For 2022
the changes per gas
are:

For 1990-2022 the changes per gas are: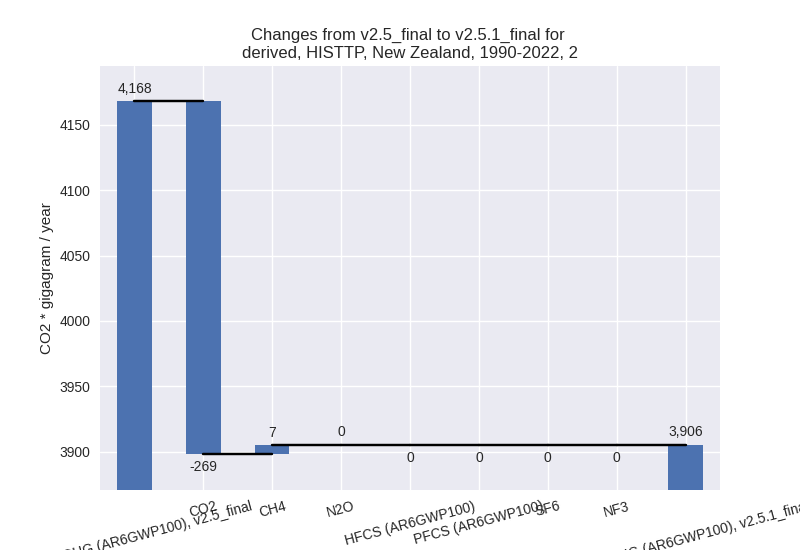
- M.AG: Total sectoral emissions in 2022 are 43961.31
Gg CO2 / year which is 51.4% of M.0.EL emissions. 2022 Emissions have
changed by -2.3% (-1056.33 Gg CO2 /
year). 1990-2022 Emissions have changed by -1.1% (-485.32 Gg CO2 / year). For 2022
the changes per gas
are:

The changes come from the following subsectors:- 3.A: Total sectoral emissions in 2022 are 30473.85
Gg CO2 / year which is 69.3% of category M.AG emissions. 2022 Emissions
have changed by -2.0% (-624.13 Gg
CO2 / year). 1990-2022 Emissions have changed by -0.1% (-18.18 Gg CO2 / year). For 2022 the
changes per gas
are:
There is no subsector information available in PRIMAP-hist. - M.AG.ELV: Total sectoral emissions in 2022 are
13487.46 Gg CO2 / year which is 30.7% of category M.AG emissions. 2022
Emissions have changed by -3.1%
(-432.19 Gg CO2 / year). 1990-2022 Emissions have changed by -3.4% (-467.14 Gg CO2 / year). For 2022
the changes per gas
are:

For 1990-2022 the changes per gas are: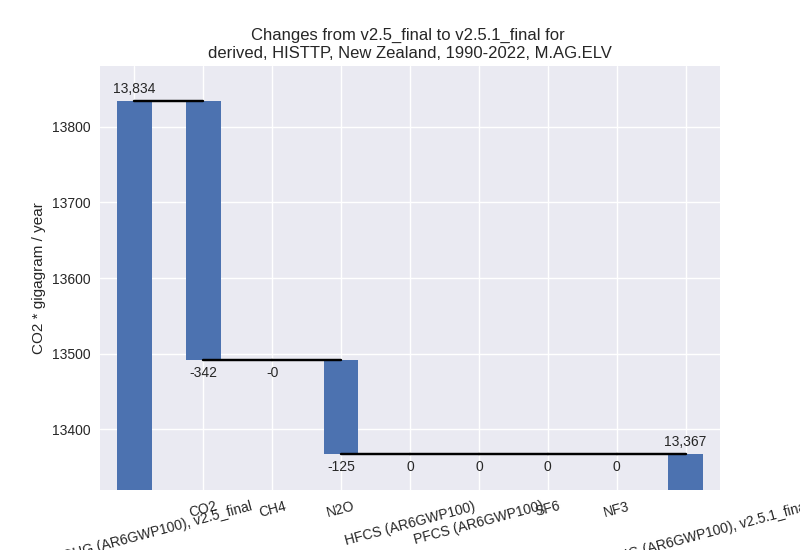
There is no subsector information available in PRIMAP-hist.
- 3.A: Total sectoral emissions in 2022 are 30473.85
Gg CO2 / year which is 69.3% of category M.AG emissions. 2022 Emissions
have changed by -2.0% (-624.13 Gg
CO2 / year). 1990-2022 Emissions have changed by -0.1% (-18.18 Gg CO2 / year). For 2022 the
changes per gas
are:
- 4: Total sectoral emissions in 2022 are 4641.02 Gg
CO2 / year which is 5.4% of M.0.EL emissions. 2022 Emissions have
changed by 4.3% (192.12 Gg CO2 /
year). 1990-2022 Emissions have changed by 0.1% (5.82 Gg CO2 / year). For 2022 the
changes per gas
are:
- 5: Total sectoral emissions in 2022 are 136.67 Gg
CO2 / year which is 0.2% of M.0.EL emissions. 2022 Emissions have
changed by -4.7% (-6.79 Gg CO2 /
year). 1990-2022 Emissions have changed by -0.1% (-0.21 Gg CO2 / year). For 2022 the
changes per gas
are:
