Changes in PRIMAP-hist v2.5.1_final compared to v2.5_final for Oman
2024-02-29
Johannes Gütschow
Change analysis for Oman for PRIMAP-hist v2.5.1_final compared to v2.5_final
Overview over emissions by sector and gas
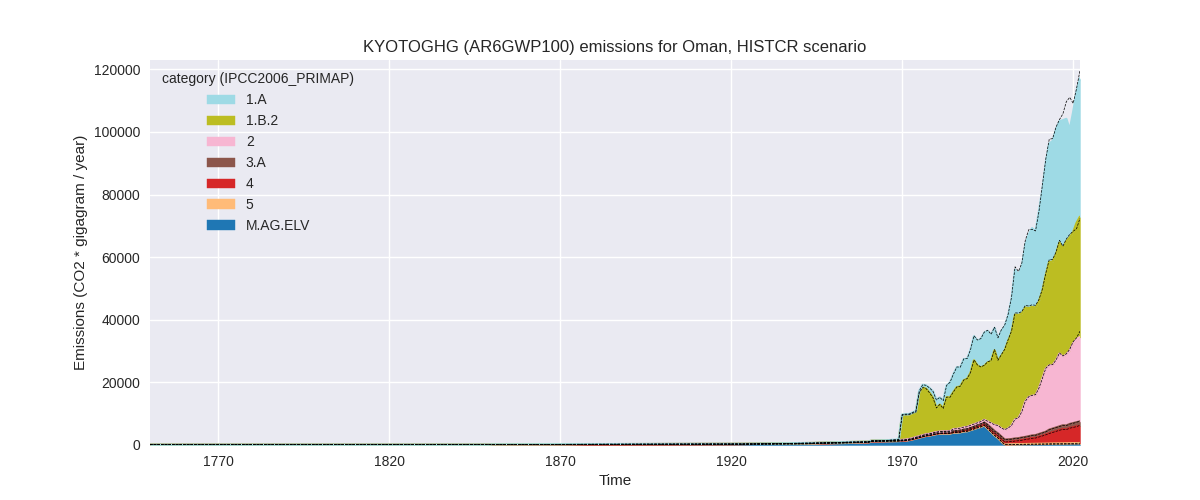
The following figures show the aggregate national total emissions excluding LULUCF AR6GWP100 for the country reported priority scenario. The dotted linesshow the v2.5_final data.
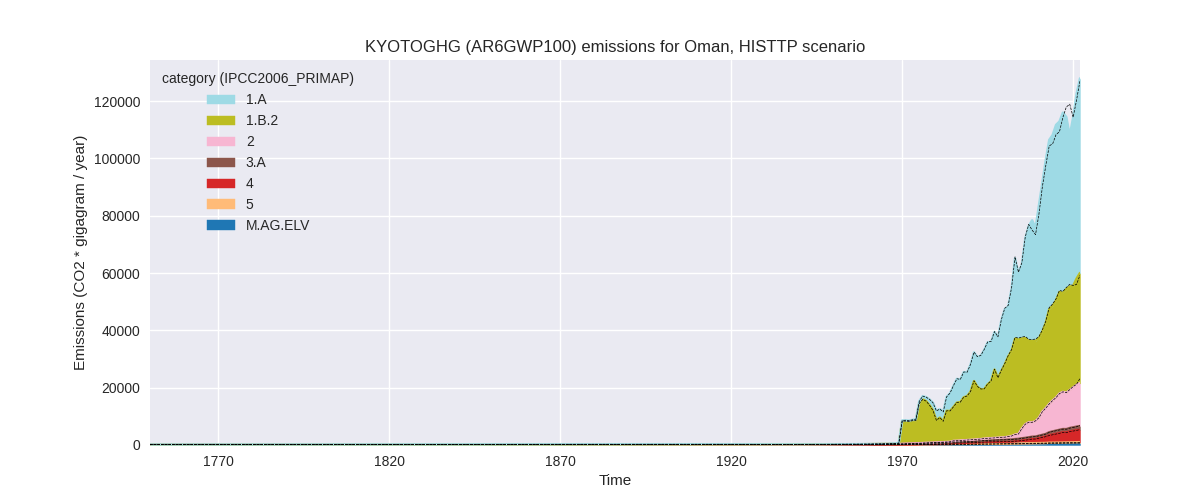
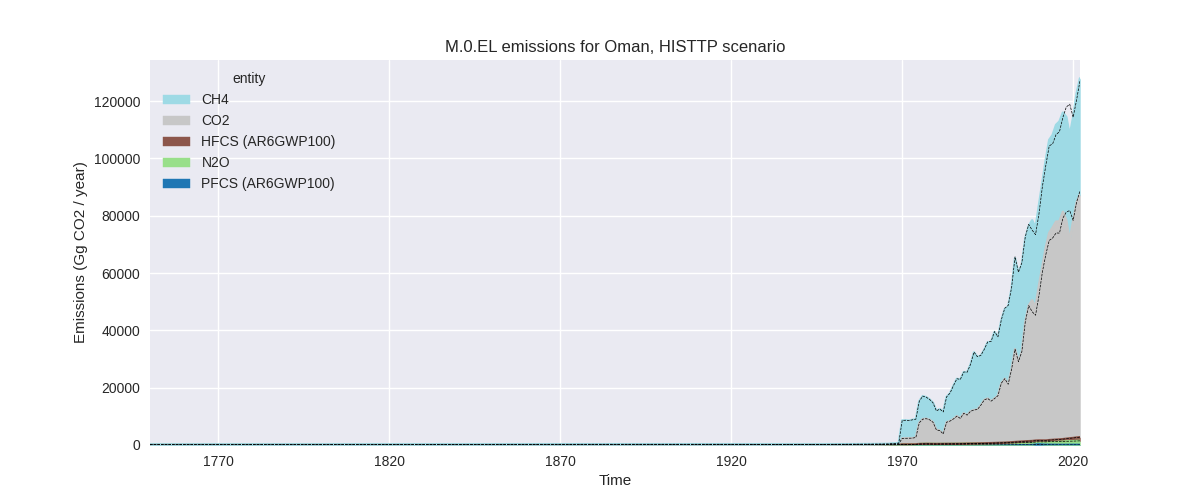
The following figures show the aggregate national total emissions excluding LULUCF AR6GWP100 for the third party priority scenario. The dotted linesshow the v2.5_final data.

Overview over changes
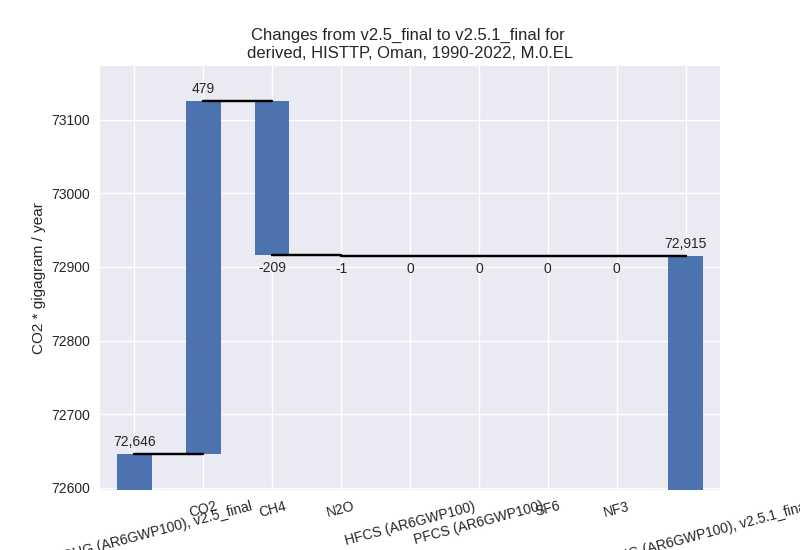
In the country reported priority scenario we have the following changes for aggregate Kyoto GHG and national total emissions excluding LULUCF (M.0.EL):
- Emissions in 2022 have changed by -2.1%% (-2555.62 Gg CO2 / year)
- Emissions in 1990-2022 have changed by -1.9%% (-1267.48 Gg CO2 / year)
In the third party priority scenario we have the following changes for aggregate Kyoto GHG and national total emissions excluding LULUCF (M.0.EL):
- Emissions in 2022 have changed by 0.7%% (827.70 Gg CO2 / year)
- Emissions in 1990-2022 have changed by 0.4%% (269.07 Gg CO2 / year)
Most important changes per scenario and time frame
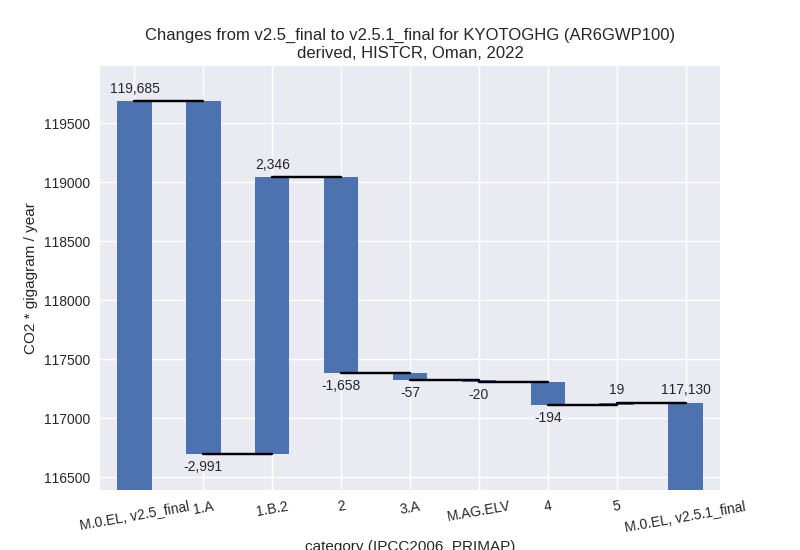
In the country reported priority scenario the following sector-gas combinations have the highest absolute impact on national total KyotoGHG (AR6GWP100) emissions in 2022 (top 5):
- 1: 1.A, CO2 with -2969.47 Gg CO2 / year (-6.3%)
- 2: 1.B.2, CH4 with 2351.42 Gg CO2 / year (7.4%)
- 3: 2, CO2 with -1357.29 Gg CO2 / year (-5.1%)
- 4: 2, N2O with -233.15 Gg CO2 / year (-100.0%)
- 5: 4, CH4 with -193.91 Gg CO2 / year (-3.5%)
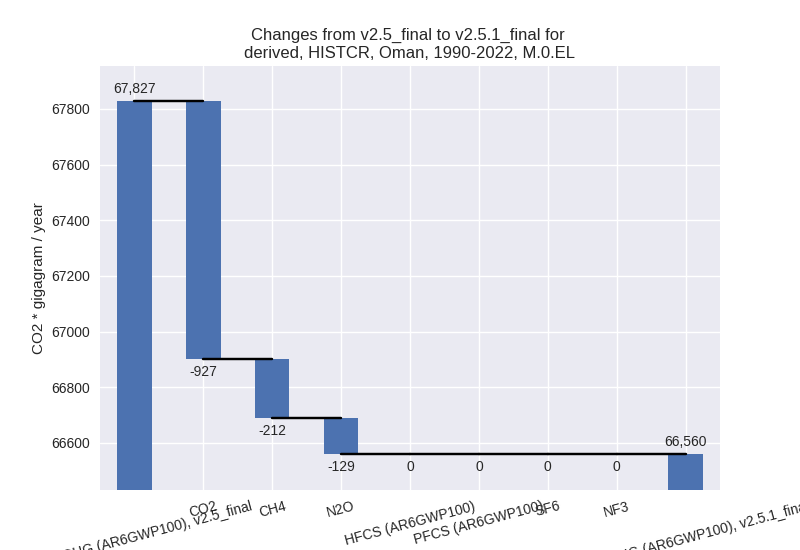
In the country reported priority scenario the following sector-gas combinations have the highest absolute impact on national total KyotoGHG (AR6GWP100) emissions in 1990-2022 (top 5):
- 1: 1.A, CO2 with -817.23 Gg CO2 / year (-3.6%)
- 2: 1.B.2, CH4 with -200.01 Gg CO2 / year (-0.8%)
- 3: 2, N2O with -128.40 Gg CO2 / year (-100.0%)
- 4: 2, CO2 with -110.28 Gg CO2 / year (-1.0%)
- 5: 4, CH4 with -5.88 Gg CO2 / year (-0.3%)
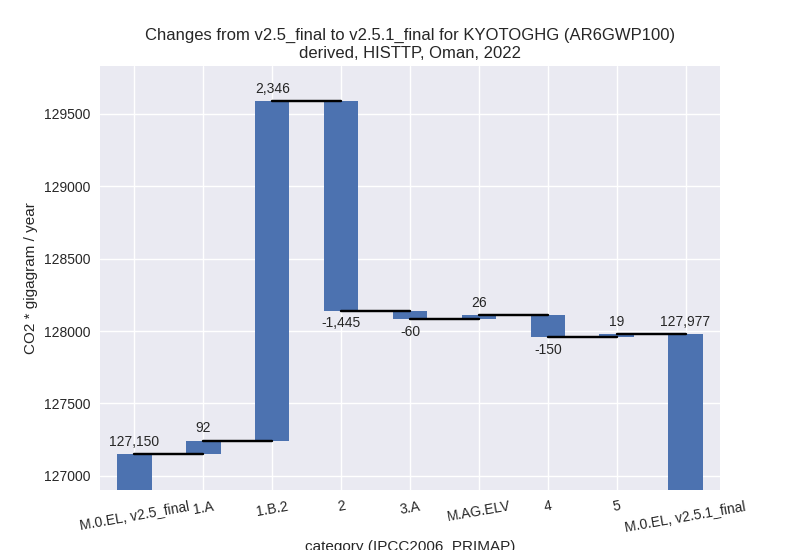
In the third party priority scenario the following sector-gas combinations have the highest absolute impact on national total KyotoGHG (AR6GWP100) emissions in 2022 (top 5):
- 1: 1.B.2, CH4 with 2351.42 Gg CO2 / year (7.4%)
- 2: 2, CO2 with -1364.40 Gg CO2 / year (-9.6%)
- 3: 4, CH4 with -148.50 Gg CO2 / year (-3.4%)
- 4: 1.A, CO2 with 103.07 Gg CO2 / year (0.2%)
- 5: 2, CH4 with -68.00 Gg CO2 / year (-10.7%)
In the third party priority scenario the following sector-gas combinations have the highest absolute impact on national total KyotoGHG (AR6GWP100) emissions in 1990-2022 (top 5):
- 1: 1.A, CO2 with 564.01 Gg CO2 / year (1.6%)
- 2: 1.B.2, CH4 with -200.01 Gg CO2 / year (-0.8%)
- 3: 2, CO2 with -110.27 Gg CO2 / year (-2.2%)
- 4: M.AG.ELV, CO2 with 25.65 Gg CO2 / year (1204.6%)
- 5: 4, CH4 with -4.50 Gg CO2 / year (-0.3%)
Notes on data changes
No country specific notes present for this changelog.
Changes by sector and gas
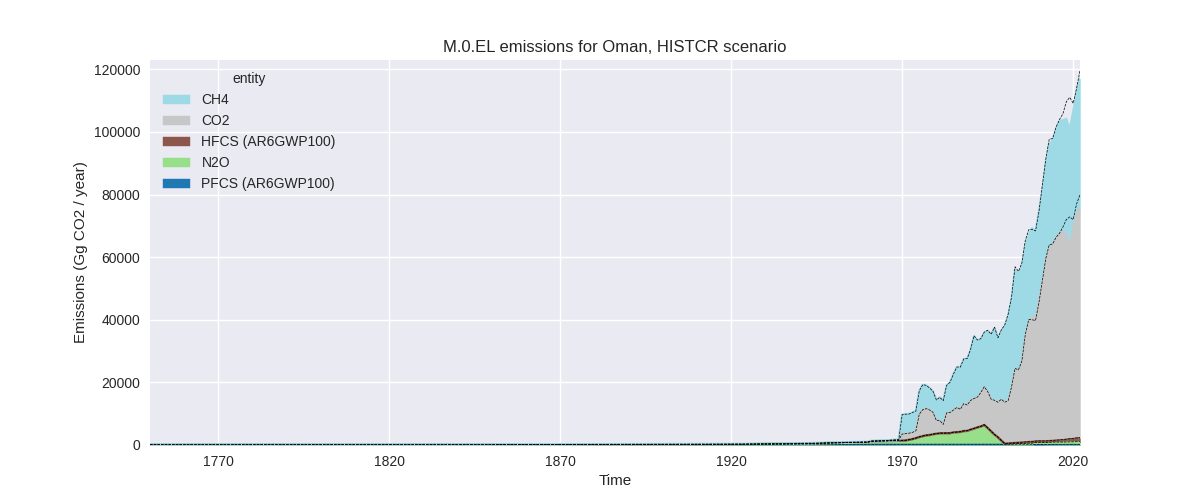
For each scenario and time frame the changes are displayed for all individual sectors and all individual gases. In the sector plot we use aggregate Kyoto GHGs in AR6GWP100. In the gas plot we usenational total emissions without LULUCF. ## country reported scenario
2022

1990-2022

third party scenario
2022

1990-2022

Detailed changes for the scenarios:
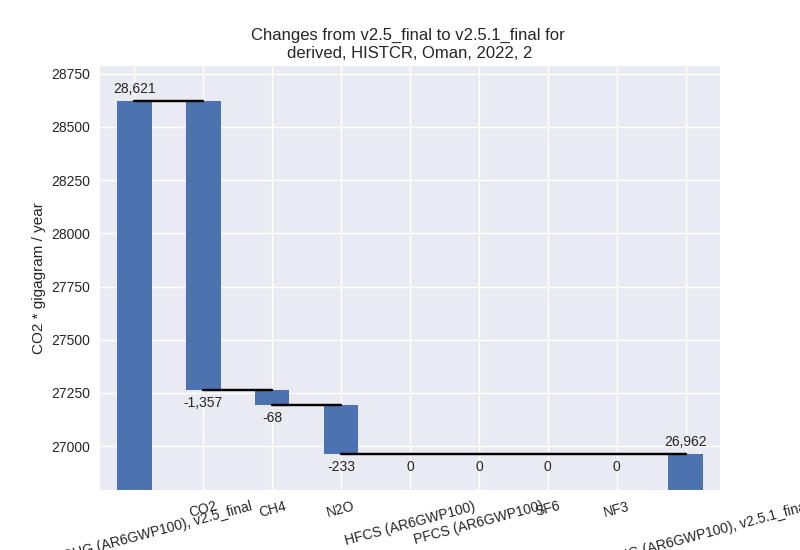
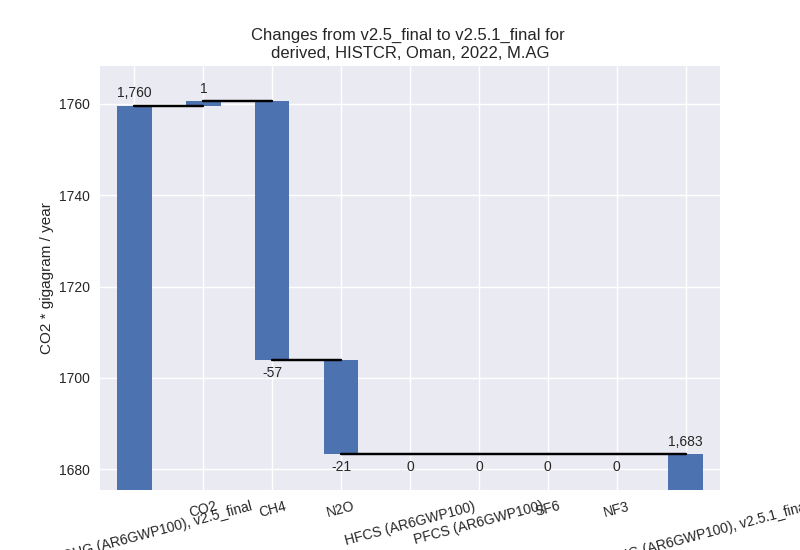
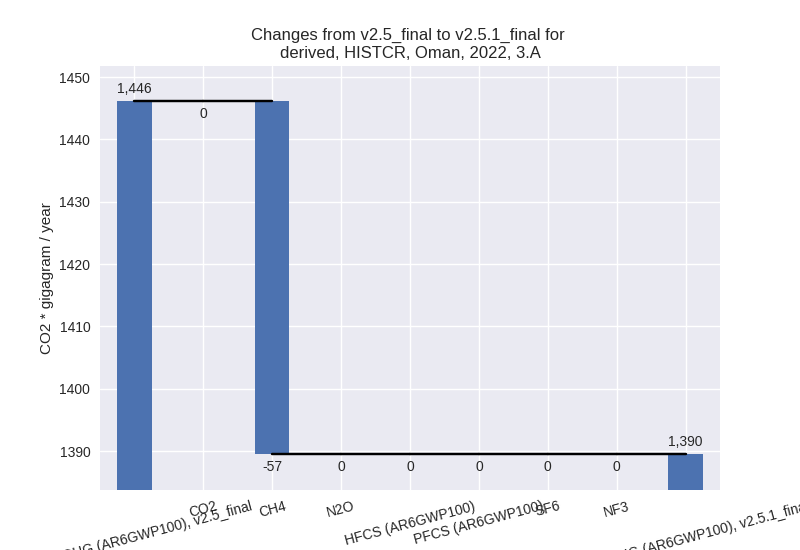
country reported scenario (HISTCR):
Most important changes per time frame
For 2022 the following sector-gas combinations have the highest absolute impact on national total KyotoGHG (AR6GWP100) emissions in 2022 (top 5):
- 1: 1.A, CO2 with -2969.47 Gg CO2 / year (-6.3%)
- 2: 1.B.2, CH4 with 2351.42 Gg CO2 / year (7.4%)
- 3: 2, CO2 with -1357.29 Gg CO2 / year (-5.1%)
- 4: 2, N2O with -233.15 Gg CO2 / year (-100.0%)
- 5: 4, CH4 with -193.91 Gg CO2 / year (-3.5%)
For 1990-2022 the following sector-gas combinations have the highest absolute impact on national total KyotoGHG (AR6GWP100) emissions in 1990-2022 (top 5):
- 1: 1.A, CO2 with -817.23 Gg CO2 / year (-3.6%)
- 2: 1.B.2, CH4 with -200.01 Gg CO2 / year (-0.8%)
- 3: 2, N2O with -128.40 Gg CO2 / year (-100.0%)
- 4: 2, CO2 with -110.28 Gg CO2 / year (-1.0%)
- 5: 4, CH4 with -5.88 Gg CO2 / year (-0.3%)
Changes in the main sectors for aggregate KyotoGHG (AR6GWP100) are
- 1: Total sectoral emissions in 2022 are 82678.92 Gg CO2 / year which is 70.6% of M.0.EL emissions. 2022 Emissions have changed by -0.8% (-645.65 Gg CO2 / year). 1990-2022 Emissions have changed by -2.0% (-1018.76 Gg CO2 / year).
- 2: Total sectoral emissions in 2022 are 26962.26 Gg
CO2 / year which is 23.0% of M.0.EL emissions. 2022 Emissions have
changed by -5.8% (-1658.44 Gg CO2 /
year). 1990-2022 Emissions have changed by -2.1% (-242.00 Gg CO2 / year). For 2022
the changes per gas
are:
For 1990-2022 the changes per gas are:
- M.AG: Total sectoral emissions in 2022 are 1683.28
Gg CO2 / year which is 1.4% of M.0.EL emissions. 2022 Emissions have
changed by -4.3% (-76.29 Gg CO2 /
year). 1990-2022 Emissions have changed by -0.1% (-1.40 Gg CO2 / year). For 2022 the
changes per gas
are:
The changes come from the following subsectors:- 3.A: Total sectoral emissions in 2022 are 1389.50
Gg CO2 / year which is 82.5% of category M.AG emissions. 2022 Emissions
have changed by -3.9% (-56.62 Gg CO2
/ year). 1990-2022 Emissions have changed by -0.2% (-1.67 Gg CO2 / year). For 2022 the
changes per gas
are:
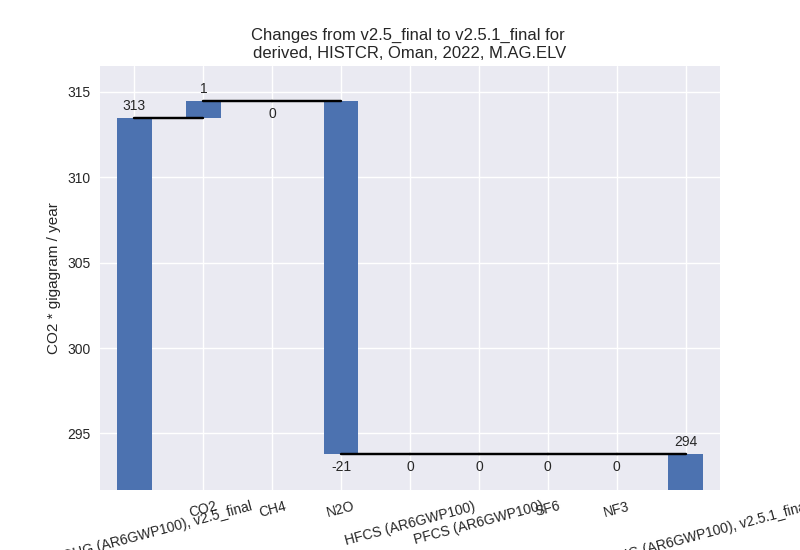
There is no subsector information available in PRIMAP-hist. - M.AG.ELV: Total sectoral emissions in 2022 are
293.78 Gg CO2 / year which is 17.5% of category M.AG emissions. 2022
Emissions have changed by -6.3%
(-19.67 Gg CO2 / year). 1990-2022 Emissions have changed by 0.0% (0.27 Gg CO2 / year). For 2022 the
changes per gas
are:
There is no subsector information available in PRIMAP-hist.
- 3.A: Total sectoral emissions in 2022 are 1389.50
Gg CO2 / year which is 82.5% of category M.AG emissions. 2022 Emissions
have changed by -3.9% (-56.62 Gg CO2
/ year). 1990-2022 Emissions have changed by -0.2% (-1.67 Gg CO2 / year). For 2022 the
changes per gas
are:
- 4: Total sectoral emissions in 2022 are 5516.75 Gg
CO2 / year which is 4.7% of M.0.EL emissions. 2022 Emissions have
changed by -3.4% (-194.18 Gg CO2 /
year). 1990-2022 Emissions have changed by -0.3% (-5.88 Gg CO2 / year). For 2022 the
changes per gas
are:

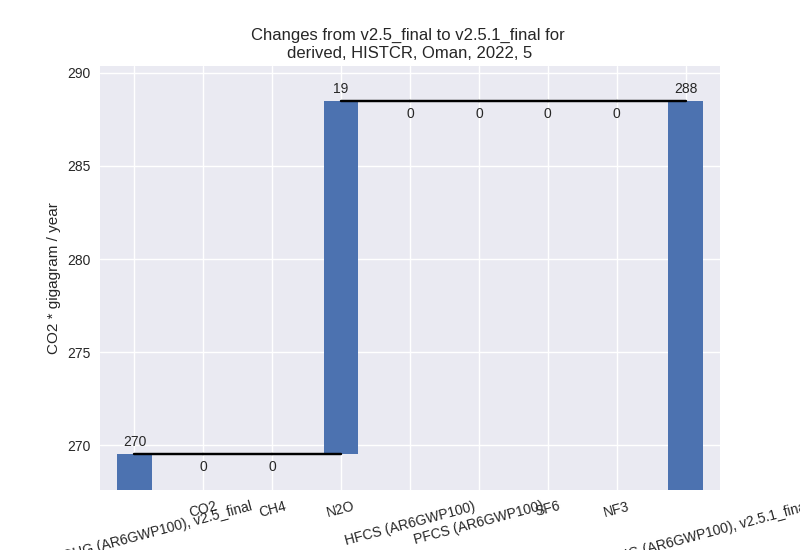
- 5: Total sectoral emissions in 2022 are 288.46 Gg
CO2 / year which is 0.2% of M.0.EL emissions. 2022 Emissions have
changed by 7.0% (18.94 Gg CO2 /
year). 1990-2022 Emissions have changed by 0.4% (0.57 Gg CO2 / year). For 2022 the
changes per gas
are:
third party scenario (HISTTP):
Most important changes per time frame
For 2022 the following sector-gas combinations have the highest absolute impact on national total KyotoGHG (AR6GWP100) emissions in 2022 (top 5):
- 1: 1.B.2, CH4 with 2351.42 Gg CO2 / year (7.4%)
- 2: 2, CO2 with -1364.40 Gg CO2 / year (-9.6%)
- 3: 4, CH4 with -148.50 Gg CO2 / year (-3.4%)
- 4: 1.A, CO2 with 103.07 Gg CO2 / year (0.2%)
- 5: 2, CH4 with -68.00 Gg CO2 / year (-10.7%)
For 1990-2022 the following sector-gas combinations have the highest absolute impact on national total KyotoGHG (AR6GWP100) emissions in 1990-2022 (top 5):
- 1: 1.A, CO2 with 564.01 Gg CO2 / year (1.6%)
- 2: 1.B.2, CH4 with -200.01 Gg CO2 / year (-0.8%)
- 3: 2, CO2 with -110.27 Gg CO2 / year (-2.2%)
- 4: M.AG.ELV, CO2 with 25.65 Gg CO2 / year (1204.6%)
- 5: 4, CH4 with -4.50 Gg CO2 / year (-0.3%)
Changes in the main sectors for aggregate KyotoGHG (AR6GWP100) are
- 1: Total sectoral emissions in 2022 are 106356.81
Gg CO2 / year which is 83.1% of M.0.EL emissions. 2022 Emissions have
changed by 2.3% (2438.03 Gg CO2 /
year). 1990-2022 Emissions have changed by 0.6% (364.21 Gg CO2 / year). For 2022 the
changes per gas
are:

The changes come from the following subsectors:- 1.A: Total sectoral emissions in 2022 are 67922.73 Gg CO2 / year which is 63.9% of category 1 emissions. 2022 Emissions have changed by 0.1% (92.23 Gg CO2 / year). 1990-2022 Emissions have changed by 1.6% (564.51 Gg CO2 / year).
- 1.B.2: Total sectoral emissions in 2022 are
38434.07 Gg CO2 / year which is 36.1% of category 1 emissions. 2022
Emissions have changed by 6.5%
(2345.80 Gg CO2 / year). 1990-2022 Emissions have changed by -0.7% (-200.30 Gg CO2 / year). For 2022
the changes per gas
are:
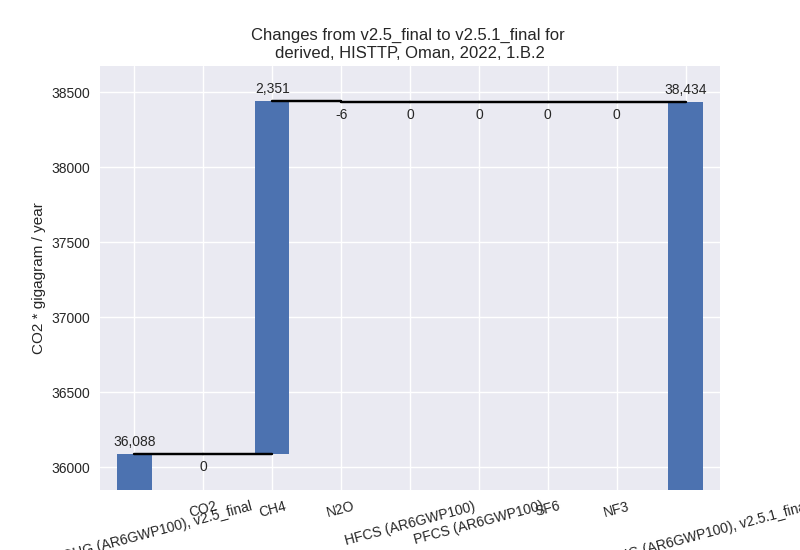
There is no subsector information available in PRIMAP-hist.
- 2: Total sectoral emissions in 2022 are 15001.92 Gg
CO2 / year which is 11.7% of M.0.EL emissions. 2022 Emissions have
changed by -8.8% (-1445.47 Gg CO2 /
year). 1990-2022 Emissions have changed by -2.0% (-114.52 Gg CO2 / year). For 2022
the changes per gas
are:

- M.AG: Total sectoral emissions in 2022 are 2009.55 Gg CO2 / year which is 1.6% of M.0.EL emissions. 2022 Emissions have changed by -1.7% (-34.06 Gg CO2 / year). 1990-2022 Emissions have changed by 1.8% (23.34 Gg CO2 / year).
- 4: Total sectoral emissions in 2022 are 4320.65 Gg
CO2 / year which is 3.4% of M.0.EL emissions. 2022 Emissions have
changed by -3.3% (-149.74 Gg CO2 /
year). 1990-2022 Emissions have changed by -0.3% (-4.54 Gg CO2 / year). For 2022 the
changes per gas
are:

- 5: Total sectoral emissions in 2022 are 288.46 Gg
CO2 / year which is 0.2% of M.0.EL emissions. 2022 Emissions have
changed by 7.0% (18.94 Gg CO2 /
year). 1990-2022 Emissions have changed by 0.4% (0.57 Gg CO2 / year). For 2022 the
changes per gas
are:
