Changes in PRIMAP-hist v2.5.1_final compared to v2.5_final for Pakistan
2024-02-29
Johannes Gütschow
Change analysis for Pakistan for PRIMAP-hist v2.5.1_final compared to v2.5_final
Overview over emissions by sector and gas
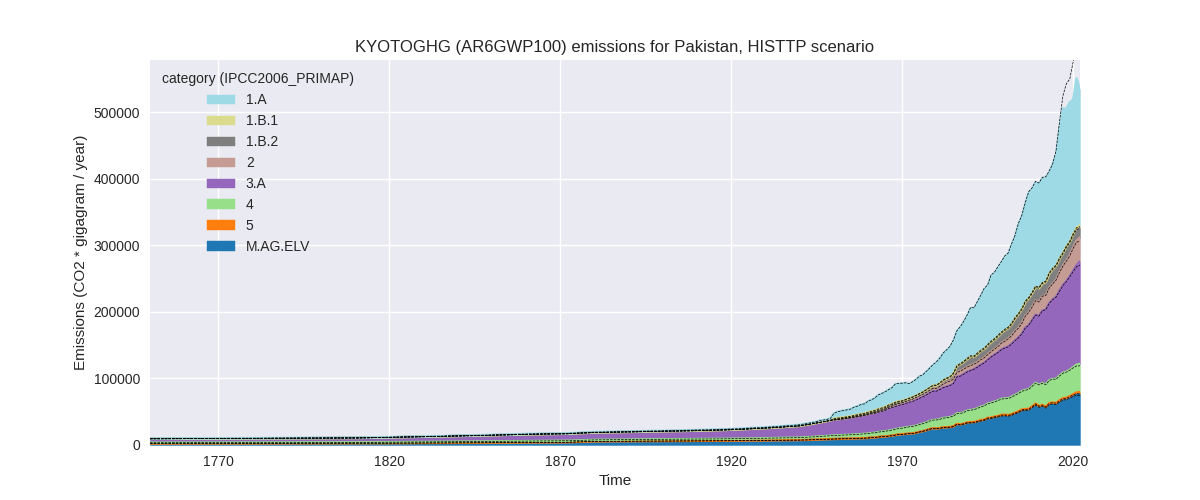
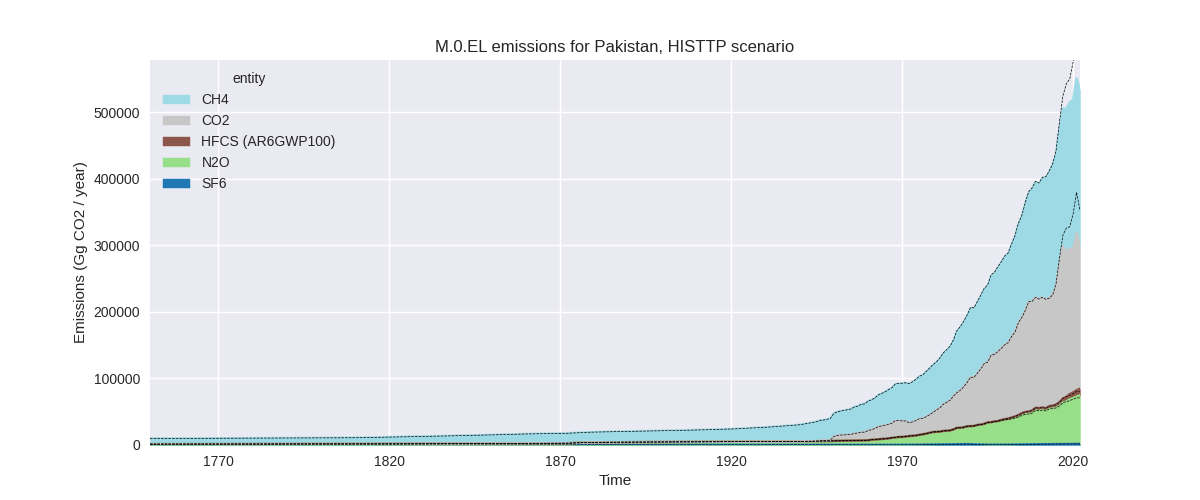
The following figures show the aggregate national total emissions excluding LULUCF AR6GWP100 for the country reported priority scenario. The dotted linesshow the v2.5_final data.


The following figures show the aggregate national total emissions excluding LULUCF AR6GWP100 for the third party priority scenario. The dotted linesshow the v2.5_final data.
Overview over changes
In the country reported priority scenario we have the following changes for aggregate Kyoto GHG and national total emissions excluding LULUCF (M.0.EL):
- Emissions in 2022 have changed by -9.3%% (-54478.34 Gg CO2 / year)
- Emissions in 1990-2022 have changed by -2.6%% (-9630.97 Gg CO2 / year)
In the third party priority scenario we have the following changes for aggregate Kyoto GHG and national total emissions excluding LULUCF (M.0.EL):
- Emissions in 2022 have changed by -9.3%% (-54478.34 Gg CO2 / year)
- Emissions in 1990-2022 have changed by -2.6%% (-9630.97 Gg CO2 / year)
Most important changes per scenario and time frame
In the country reported priority scenario the following sector-gas combinations have the highest absolute impact on national total KyotoGHG (AR6GWP100) emissions in 2022 (top 5):
- 1: 1.A, CO2 with -57541.34 Gg CO2 / year (-23.9%)
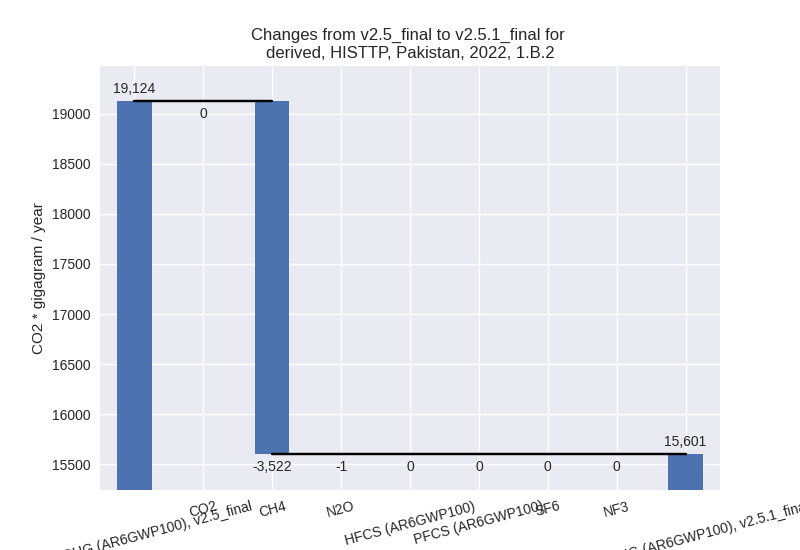
- 2: 1.B.2, CH4 with -3522.37 Gg CO2 / year (-19.0%)
- 3: 3.A, CH4 with 2634.04 Gg CO2 / year (1.8%)
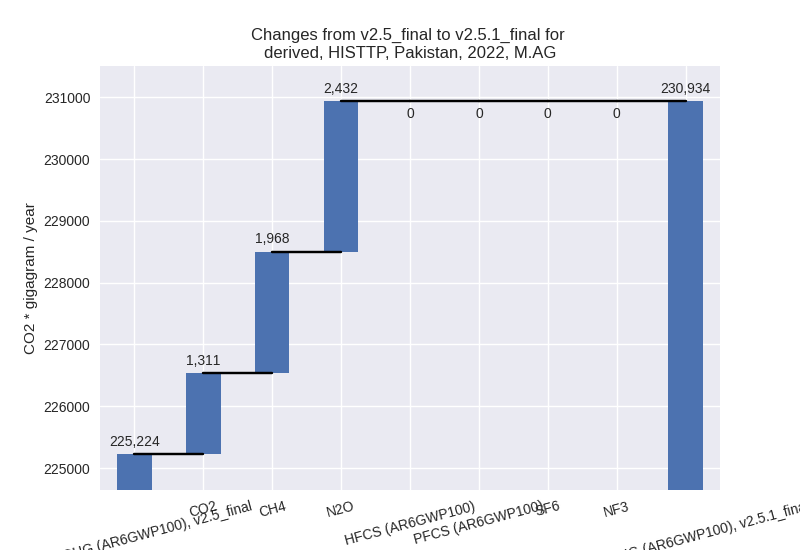
- 4: M.AG.ELV, N2O with 2319.33 Gg CO2 / year (4.1%)
- 5: 1.A, N2O with 1342.73 Gg CO2 / year (21.9%)
In the country reported priority scenario the following sector-gas combinations have the highest absolute impact on national total KyotoGHG (AR6GWP100) emissions in 1990-2022 (top 5):
- 1: 1.A, CO2 with -8484.98 Gg CO2 / year (-6.2%)
- 2: 1.B.2, CH4 with -1878.72 Gg CO2 / year (-10.8%)
- 3: M.AG.ELV, CO2 with 356.29 Gg CO2 / year (9.6%)
- 4: 1.A, N2O with 187.12 Gg CO2 / year (5.8%)
- 5: 3.A, CH4 with 89.24 Gg CO2 / year (0.1%)
In the third party priority scenario the following sector-gas combinations have the highest absolute impact on national total KyotoGHG (AR6GWP100) emissions in 2022 (top 5):
- 1: 1.A, CO2 with -57541.34 Gg CO2 / year (-23.9%)
- 2: 1.B.2, CH4 with -3522.37 Gg CO2 / year (-19.0%)
- 3: 3.A, CH4 with 2634.04 Gg CO2 / year (1.8%)
- 4: M.AG.ELV, N2O with 2319.33 Gg CO2 / year (4.1%)
- 5: 1.A, N2O with 1342.73 Gg CO2 / year (21.9%)
In the third party priority scenario the following sector-gas combinations have the highest absolute impact on national total KyotoGHG (AR6GWP100) emissions in 1990-2022 (top 5):
- 1: 1.A, CO2 with -8484.98 Gg CO2 / year (-6.2%)
- 2: 1.B.2, CH4 with -1878.72 Gg CO2 / year (-10.8%)
- 3: M.AG.ELV, CO2 with 356.29 Gg CO2 / year (9.6%)
- 4: 1.A, N2O with 187.12 Gg CO2 / year (5.8%)
- 5: 3.A, CH4 with 89.24 Gg CO2 / year (0.1%)
Notes on data changes
Here we list notes explaining important emissions changes for the country. ’' means that the following text only applies to the TP time series, while means that it only applies to the CR scenario. Otherwise the note applies to both scenarios.
- 1.A, CO2: New CDIAC data shows a drop in emissions after 2017 and lower emission in 2017. Thus PRIMAP-hist 2.5.1 emissions are lower for the last years.
- 1.B.2, CH4: Updated EDGAR emissions are lower for all years.
Changes by sector and gas
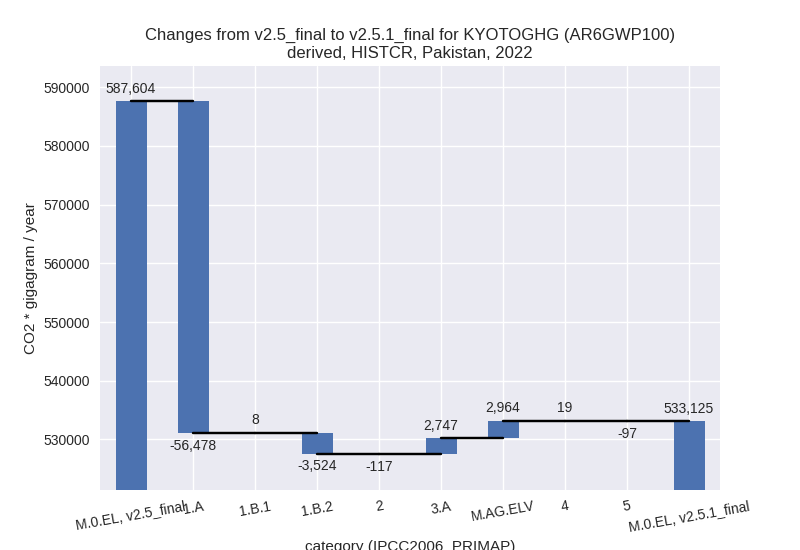
For each scenario and time frame the changes are displayed for all individual sectors and all individual gases. In the sector plot we use aggregate Kyoto GHGs in AR6GWP100. In the gas plot we usenational total emissions without LULUCF. ## country reported scenario
2022

1990-2022

third party scenario
2022


1990-2022


Detailed changes for the scenarios:
country reported scenario (HISTCR):
Most important changes per time frame
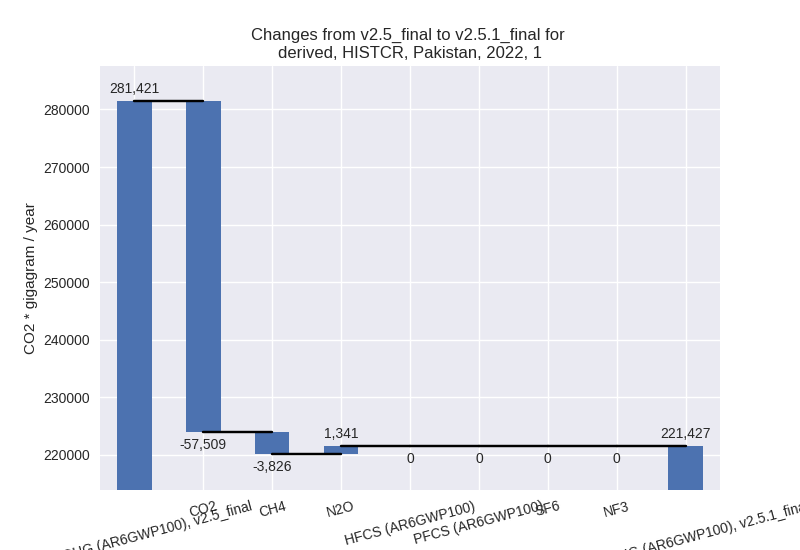
For 2022 the following sector-gas combinations have the highest absolute impact on national total KyotoGHG (AR6GWP100) emissions in 2022 (top 5):
- 1: 1.A, CO2 with -57541.34 Gg CO2 / year (-23.9%)
- 2: 1.B.2, CH4 with -3522.37 Gg CO2 / year (-19.0%)
- 3: 3.A, CH4 with 2634.04 Gg CO2 / year (1.8%)
- 4: M.AG.ELV, N2O with 2319.33 Gg CO2 / year (4.1%)
- 5: 1.A, N2O with 1342.73 Gg CO2 / year (21.9%)
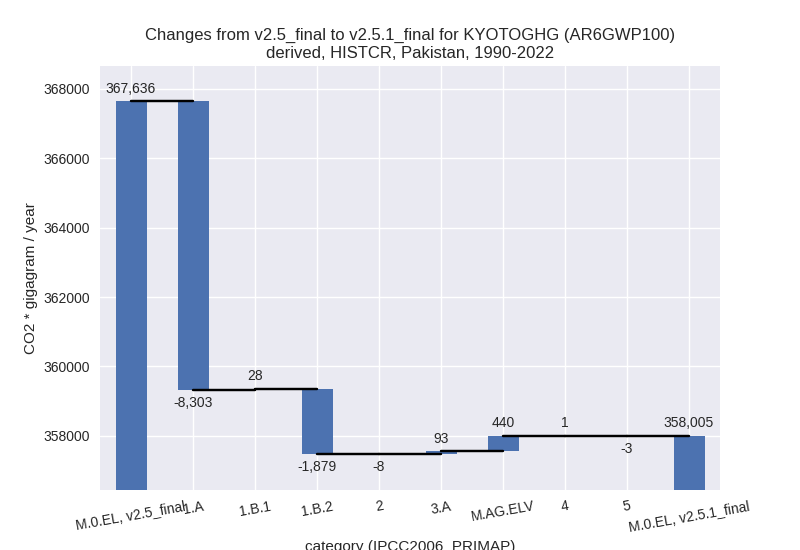
For 1990-2022 the following sector-gas combinations have the highest absolute impact on national total KyotoGHG (AR6GWP100) emissions in 1990-2022 (top 5):
- 1: 1.A, CO2 with -8484.98 Gg CO2 / year (-6.2%)
- 2: 1.B.2, CH4 with -1878.72 Gg CO2 / year (-10.8%)
- 3: M.AG.ELV, CO2 with 356.29 Gg CO2 / year (9.6%)
- 4: 1.A, N2O with 187.12 Gg CO2 / year (5.8%)
- 5: 3.A, CH4 with 89.24 Gg CO2 / year (0.1%)
Changes in the main sectors for aggregate KyotoGHG (AR6GWP100) are
- 1: Total sectoral emissions in 2022 are 221426.77
Gg CO2 / year which is 41.5% of M.0.EL emissions. 2022 Emissions have
changed by -21.3% (-59993.87 Gg CO2
/ year). 1990-2022 Emissions have changed by -6.0% (-10154.09 Gg CO2 / year). For 2022
the changes per gas
are:
For 1990-2022 the changes per gas are:
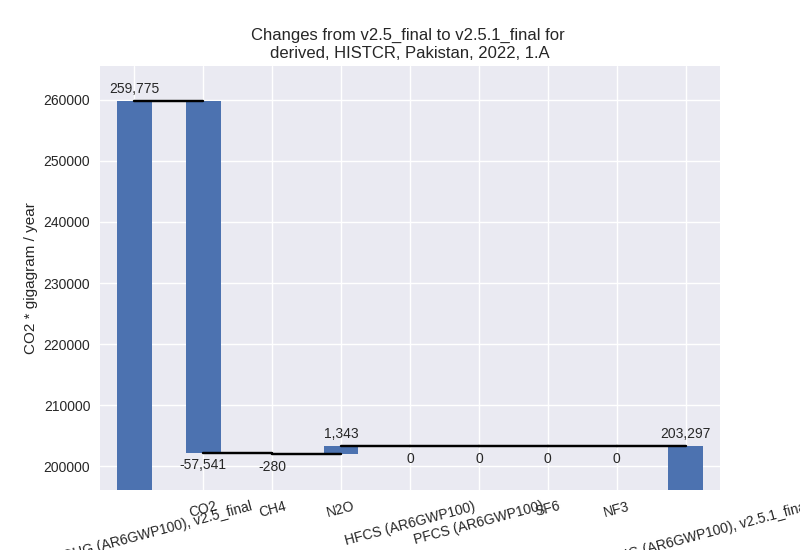
The changes come from the following subsectors:- 1.A: Total sectoral emissions in 2022 are 203296.61
Gg CO2 / year which is 91.8% of category 1 emissions. 2022 Emissions
have changed by -21.7% (-56478.47 Gg
CO2 / year). 1990-2022 Emissions have changed by -5.6% (-8302.94 Gg CO2 / year). For 2022
the changes per gas
are:
For 1990-2022 the changes per gas are:
There is no subsector information available in PRIMAP-hist. - 1.B.1: Total sectoral emissions in 2022 are 2529.47 Gg CO2 / year which is 1.1% of category 1 emissions. 2022 Emissions have changed by 0.3% (8.22 Gg CO2 / year). 1990-2022 Emissions have changed by 1.4% (27.61 Gg CO2 / year).
- 1.B.2: Total sectoral emissions in 2022 are
15600.69 Gg CO2 / year which is 7.0% of category 1 emissions. 2022
Emissions have changed by -18.4%
(-3523.62 Gg CO2 / year). 1990-2022 Emissions have changed by -10.6% (-1878.76 Gg CO2 / year). For 2022
the changes per gas
are:

For 1990-2022 the changes per gas are:
There is no subsector information available in PRIMAP-hist.
- 1.A: Total sectoral emissions in 2022 are 203296.61
Gg CO2 / year which is 91.8% of category 1 emissions. 2022 Emissions
have changed by -21.7% (-56478.47 Gg
CO2 / year). 1990-2022 Emissions have changed by -5.6% (-8302.94 Gg CO2 / year). For 2022
the changes per gas
are:
- 2: Total sectoral emissions in 2022 are 35988.85 Gg CO2 / year which is 6.8% of M.0.EL emissions. 2022 Emissions have changed by -0.3% (-117.37 Gg CO2 / year). 1990-2022 Emissions have changed by -0.0% (-7.71 Gg CO2 / year).
- M.AG: Total sectoral emissions in 2022 are
230934.42 Gg CO2 / year which is 43.3% of M.0.EL emissions. 2022
Emissions have changed by 2.5%
(5710.84 Gg CO2 / year). 1990-2022 Emissions have changed by 0.4% (533.19 Gg CO2 / year). For 2022 the
changes per gas
are:

The changes come from the following subsectors:- 3.A: Total sectoral emissions in 2022 are 153898.68 Gg CO2 / year which is 66.6% of category M.AG emissions. 2022 Emissions have changed by 1.8% (2746.61 Gg CO2 / year). 1990-2022 Emissions have changed by 0.1% (92.71 Gg CO2 / year).
- M.AG.ELV: Total sectoral emissions in 2022 are
77035.74 Gg CO2 / year which is 33.4% of category M.AG emissions. 2022
Emissions have changed by 4.0%
(2964.23 Gg CO2 / year). 1990-2022 Emissions have changed by 0.8% (440.48 Gg CO2 / year). For 2022 the
changes per gas
are:

There is no subsector information available in PRIMAP-hist.
- 4: Total sectoral emissions in 2022 are 42359.33 Gg CO2 / year which is 7.9% of M.0.EL emissions. 2022 Emissions have changed by 0.0% (18.77 Gg CO2 / year). 1990-2022 Emissions have changed by 0.0% (0.57 Gg CO2 / year).
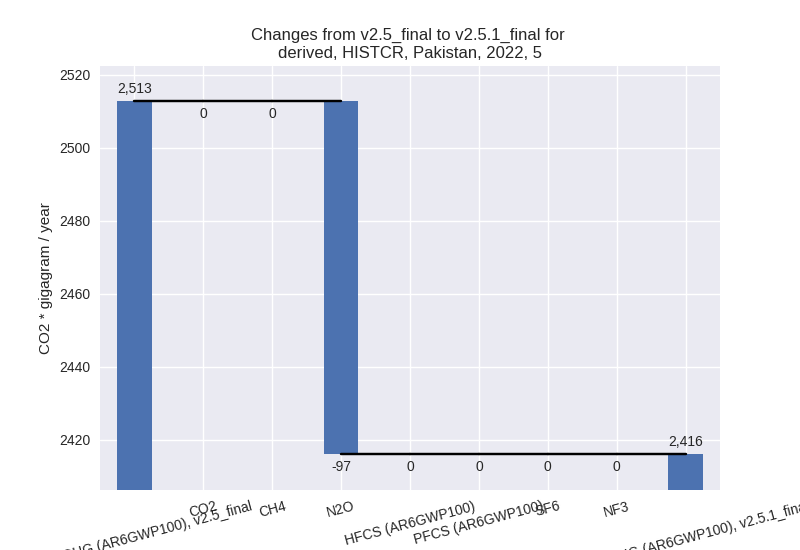
- 5: Total sectoral emissions in 2022 are 2416.03 Gg
CO2 / year which is 0.5% of M.0.EL emissions. 2022 Emissions have
changed by -3.8% (-96.72 Gg CO2 /
year). 1990-2022 Emissions have changed by -0.2% (-2.93 Gg CO2 / year). For 2022 the
changes per gas
are:
third party scenario (HISTTP):
Most important changes per time frame
For 2022 the following sector-gas combinations have the highest absolute impact on national total KyotoGHG (AR6GWP100) emissions in 2022 (top 5):
- 1: 1.A, CO2 with -57541.34 Gg CO2 / year (-23.9%)
- 2: 1.B.2, CH4 with -3522.37 Gg CO2 / year (-19.0%)
- 3: 3.A, CH4 with 2634.04 Gg CO2 / year (1.8%)
- 4: M.AG.ELV, N2O with 2319.33 Gg CO2 / year (4.1%)
- 5: 1.A, N2O with 1342.73 Gg CO2 / year (21.9%)
For 1990-2022 the following sector-gas combinations have the highest absolute impact on national total KyotoGHG (AR6GWP100) emissions in 1990-2022 (top 5):
- 1: 1.A, CO2 with -8484.98 Gg CO2 / year (-6.2%)
- 2: 1.B.2, CH4 with -1878.72 Gg CO2 / year (-10.8%)
- 3: M.AG.ELV, CO2 with 356.29 Gg CO2 / year (9.6%)
- 4: 1.A, N2O with 187.12 Gg CO2 / year (5.8%)
- 5: 3.A, CH4 with 89.24 Gg CO2 / year (0.1%)
Changes in the main sectors for aggregate KyotoGHG (AR6GWP100) are
- 1: Total sectoral emissions in 2022 are 221426.77
Gg CO2 / year which is 41.5% of M.0.EL emissions. 2022 Emissions have
changed by -21.3% (-59993.87 Gg CO2
/ year). 1990-2022 Emissions have changed by -6.0% (-10154.09 Gg CO2 / year). For 2022
the changes per gas
are:

For 1990-2022 the changes per gas are: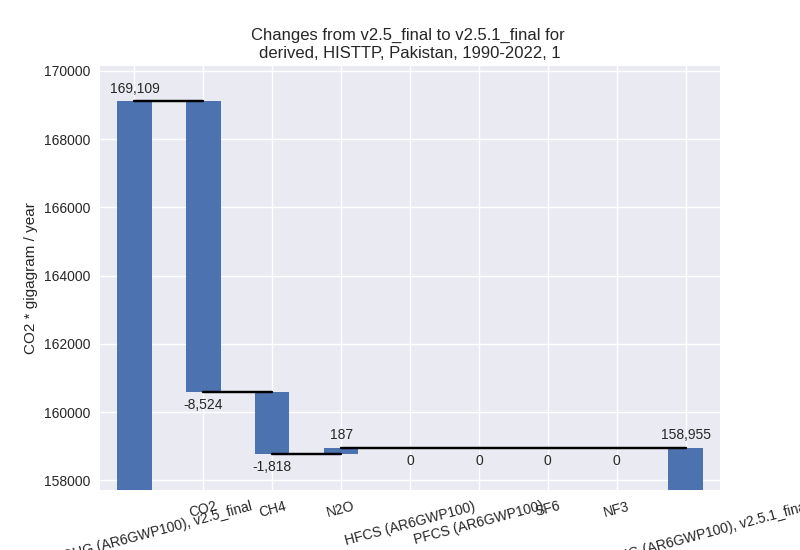
The changes come from the following subsectors:- 1.A: Total sectoral emissions in 2022 are 203296.61
Gg CO2 / year which is 91.8% of category 1 emissions. 2022 Emissions
have changed by -21.7% (-56478.47 Gg
CO2 / year). 1990-2022 Emissions have changed by -5.6% (-8302.94 Gg CO2 / year). For 2022
the changes per gas
are:

For 1990-2022 the changes per gas are: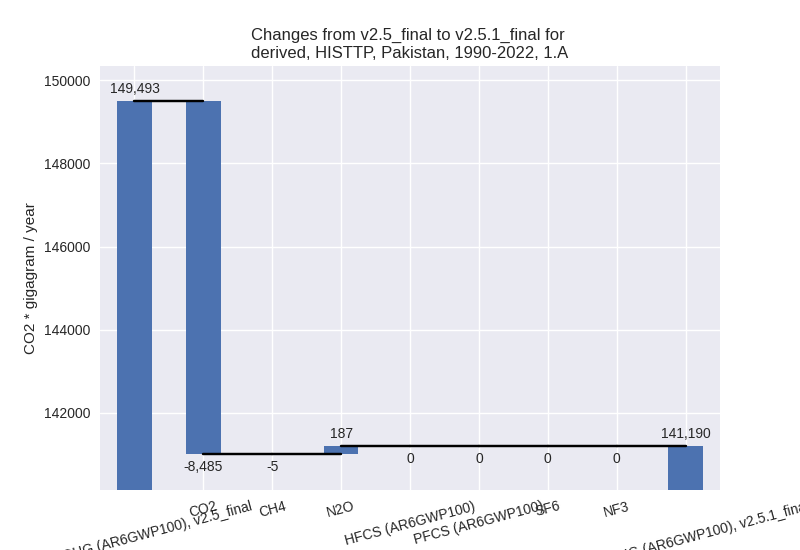
There is no subsector information available in PRIMAP-hist. - 1.B.1: Total sectoral emissions in 2022 are 2529.47 Gg CO2 / year which is 1.1% of category 1 emissions. 2022 Emissions have changed by 0.3% (8.22 Gg CO2 / year). 1990-2022 Emissions have changed by 1.4% (27.61 Gg CO2 / year).
- 1.B.2: Total sectoral emissions in 2022 are
15600.69 Gg CO2 / year which is 7.0% of category 1 emissions. 2022
Emissions have changed by -18.4%
(-3523.62 Gg CO2 / year). 1990-2022 Emissions have changed by -10.6% (-1878.76 Gg CO2 / year). For 2022
the changes per gas
are:
For 1990-2022 the changes per gas are:
There is no subsector information available in PRIMAP-hist.
- 1.A: Total sectoral emissions in 2022 are 203296.61
Gg CO2 / year which is 91.8% of category 1 emissions. 2022 Emissions
have changed by -21.7% (-56478.47 Gg
CO2 / year). 1990-2022 Emissions have changed by -5.6% (-8302.94 Gg CO2 / year). For 2022
the changes per gas
are:
- 2: Total sectoral emissions in 2022 are 35988.85 Gg CO2 / year which is 6.8% of M.0.EL emissions. 2022 Emissions have changed by -0.3% (-117.37 Gg CO2 / year). 1990-2022 Emissions have changed by -0.0% (-7.71 Gg CO2 / year).
- M.AG: Total sectoral emissions in 2022 are
230934.42 Gg CO2 / year which is 43.3% of M.0.EL emissions. 2022
Emissions have changed by 2.5%
(5710.84 Gg CO2 / year). 1990-2022 Emissions have changed by 0.4% (533.19 Gg CO2 / year). For 2022 the
changes per gas
are:
The changes come from the following subsectors:- 3.A: Total sectoral emissions in 2022 are 153898.68 Gg CO2 / year which is 66.6% of category M.AG emissions. 2022 Emissions have changed by 1.8% (2746.61 Gg CO2 / year). 1990-2022 Emissions have changed by 0.1% (92.71 Gg CO2 / year).
- M.AG.ELV: Total sectoral emissions in 2022 are
77035.74 Gg CO2 / year which is 33.4% of category M.AG emissions. 2022
Emissions have changed by 4.0%
(2964.23 Gg CO2 / year). 1990-2022 Emissions have changed by 0.8% (440.48 Gg CO2 / year). For 2022 the
changes per gas
are:

There is no subsector information available in PRIMAP-hist.
- 4: Total sectoral emissions in 2022 are 42359.33 Gg CO2 / year which is 7.9% of M.0.EL emissions. 2022 Emissions have changed by 0.0% (18.77 Gg CO2 / year). 1990-2022 Emissions have changed by 0.0% (0.57 Gg CO2 / year).
- 5: Total sectoral emissions in 2022 are 2416.03 Gg
CO2 / year which is 0.5% of M.0.EL emissions. 2022 Emissions have
changed by -3.8% (-96.72 Gg CO2 /
year). 1990-2022 Emissions have changed by -0.2% (-2.93 Gg CO2 / year). For 2022 the
changes per gas
are:
