Changes in PRIMAP-hist v2.5.1_final compared to v2.5_final for Peru
2024-02-29
Johannes Gütschow
Change analysis for Peru for PRIMAP-hist v2.5.1_final compared to v2.5_final
Overview over emissions by sector and gas
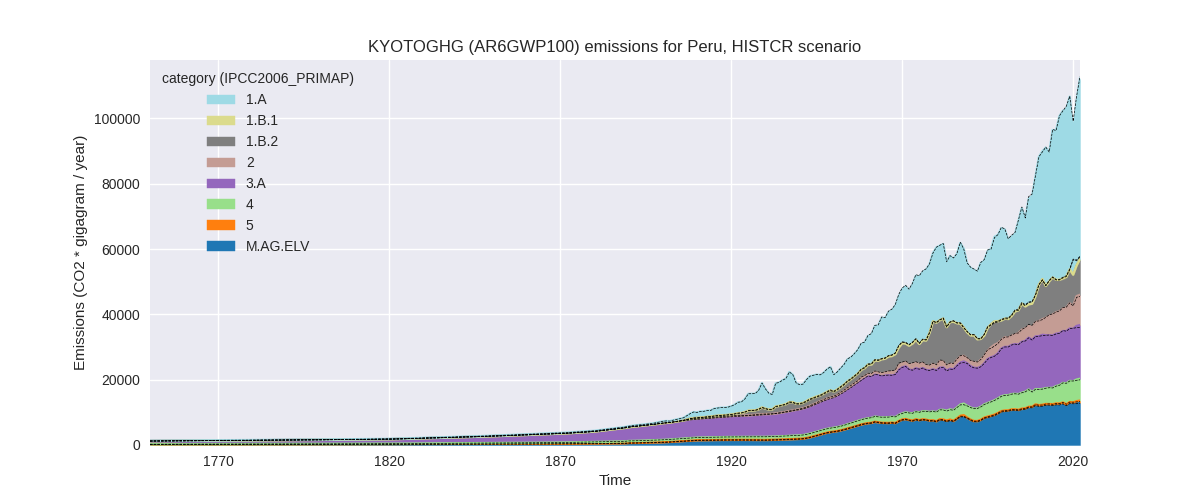
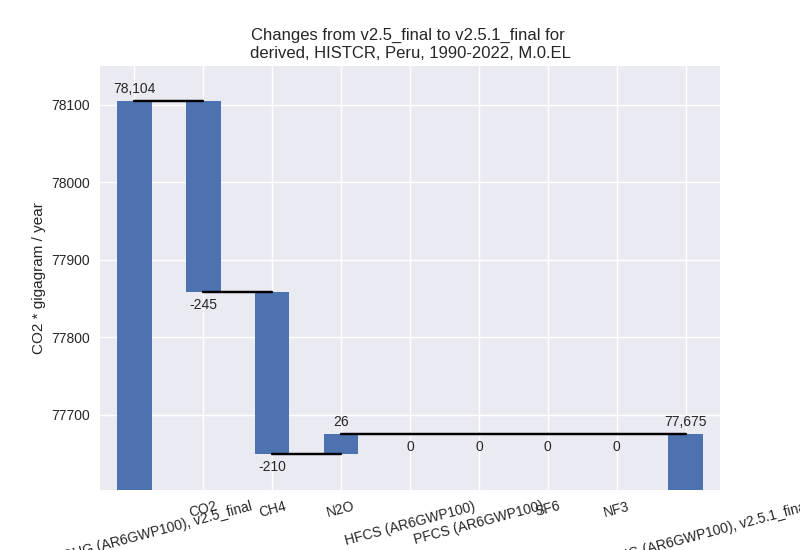
The following figures show the aggregate national total emissions excluding LULUCF AR6GWP100 for the country reported priority scenario. The dotted linesshow the v2.5_final data.


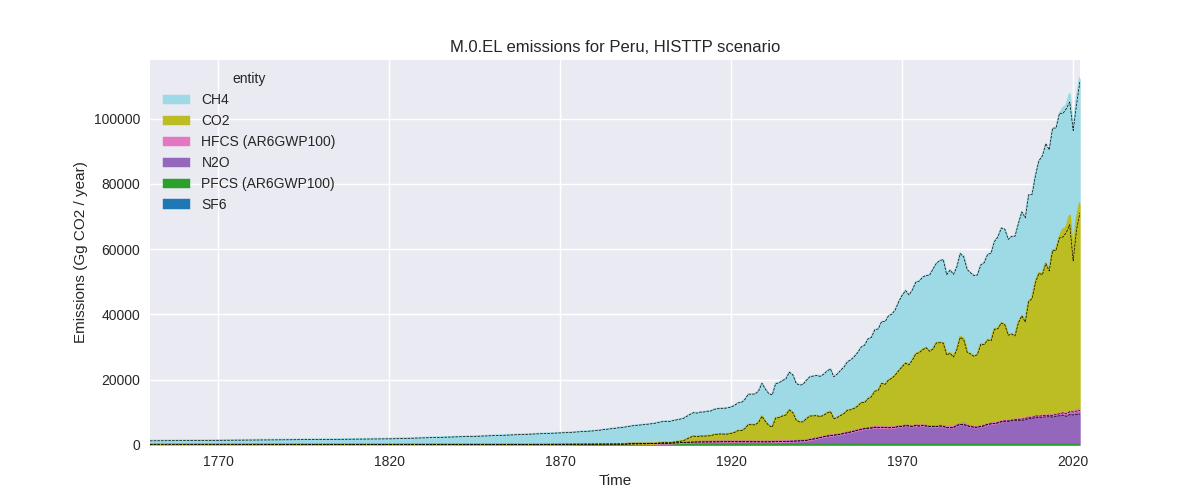
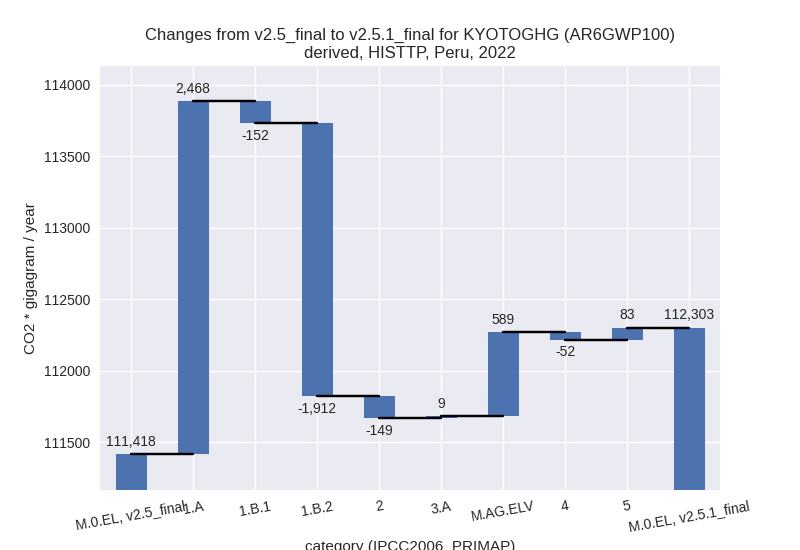
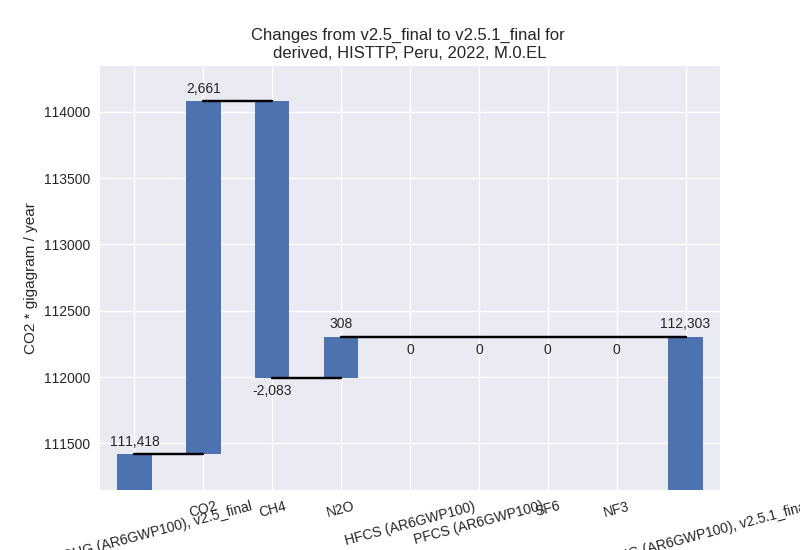
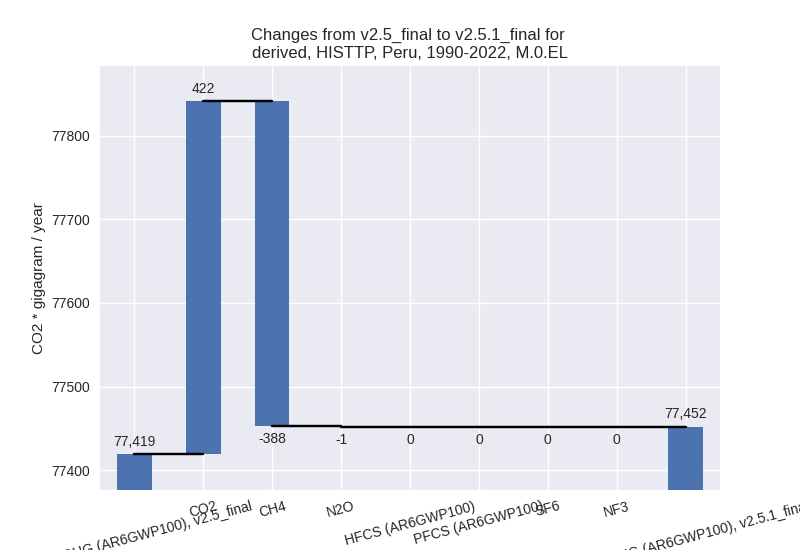
The following figures show the aggregate national total emissions excluding LULUCF AR6GWP100 for the third party priority scenario. The dotted linesshow the v2.5_final data.


Overview over changes
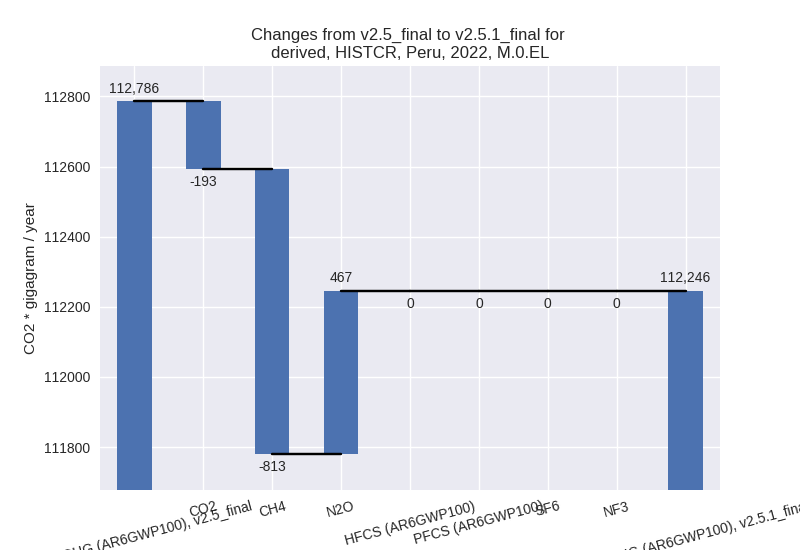
In the country reported priority scenario we have the following changes for aggregate Kyoto GHG and national total emissions excluding LULUCF (M.0.EL):
- Emissions in 2022 have changed by -0.5%% (-540.04 Gg CO2 / year)
- Emissions in 1990-2022 have changed by -0.5%% (-429.46 Gg CO2 / year)
In the third party priority scenario we have the following changes for aggregate Kyoto GHG and national total emissions excluding LULUCF (M.0.EL):
- Emissions in 2022 have changed by 0.8%% (885.28 Gg CO2 / year)
- Emissions in 1990-2022 have changed by 0.0%% (32.89 Gg CO2 / year)
Most important changes per scenario and time frame
In the country reported priority scenario the following sector-gas combinations have the highest absolute impact on national total KyotoGHG (AR6GWP100) emissions in 2022 (top 5):
- 1: 1.B.2, CH4 with -1255.98 Gg CO2 / year (-11.1%)
- 2: 3.A, CH4 with 356.46 Gg CO2 / year (2.3%)
- 3: M.AG.ELV, N2O with 341.81 Gg CO2 / year (3.4%)
- 4: 1.A, CH4 with 225.76 Gg CO2 / year (23.1%)
- 5: 2, CO2 with -178.81 Gg CO2 / year (-2.3%)
In the country reported priority scenario the following sector-gas combinations have the highest absolute impact on national total KyotoGHG (AR6GWP100) emissions in 1990-2022 (top 5):
- 1: 1.B.2, CH4 with -244.12 Gg CO2 / year (-3.2%)
- 2: 2, CO2 with -176.06 Gg CO2 / year (-4.1%)
- 3: 1.B.1, CO2 with -65.82 Gg CO2 / year (-86.0%)
- 4: 1.A, CH4 with 19.83 Gg CO2 / year (2.0%)
- 5: M.AG.ELV, N2O with 19.73 Gg CO2 / year (0.2%)
In the third party priority scenario the following sector-gas combinations have the highest absolute impact on national total KyotoGHG (AR6GWP100) emissions in 2022 (top 5):
- 1: 1.A, CO2 with 2280.23 Gg CO2 / year (4.2%)
- 2: 1.B.2, CH4 with -1911.67 Gg CO2 / year (-23.2%)
- 3: M.AG.ELV, CO2 with 530.65 Gg CO2 / year (119.7%)
- 4: M.AG.ELV, N2O with 198.71 Gg CO2 / year (2.7%)
- 5: 1.A, CH4 with 171.21 Gg CO2 / year (20.9%)
In the third party priority scenario the following sector-gas combinations have the highest absolute impact on national total KyotoGHG (AR6GWP100) emissions in 1990-2022 (top 5):
- 1: 1.A, CO2 with 348.53 Gg CO2 / year (1.1%)
- 2: 1.B.2, CH4 with -324.26 Gg CO2 / year (-8.3%)
- 3: M.AG.ELV, CO2 with 169.67 Gg CO2 / year (51.3%)
- 4: 3.A, CH4 with -71.82 Gg CO2 / year (-0.5%)
- 5: 1.B.1, CO2 with -65.82 Gg CO2 / year (-86.0%)
Notes on data changes
No country specific notes present for this changelog.
Changes by sector and gas
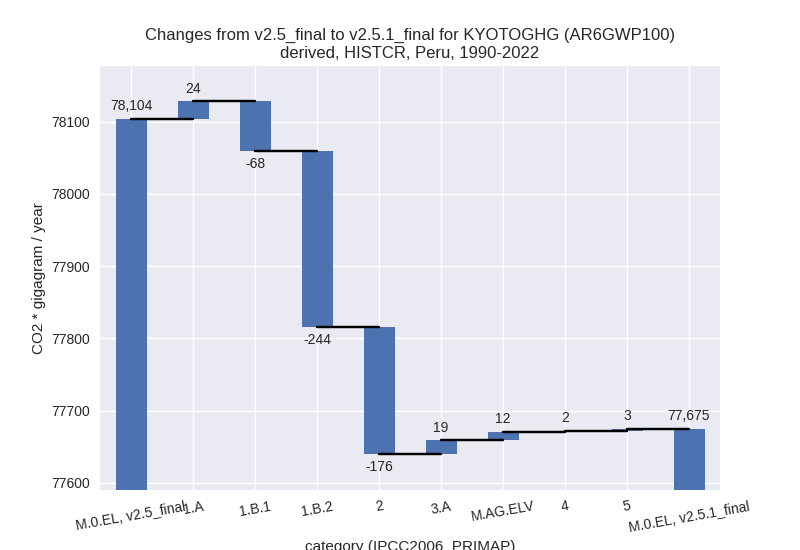
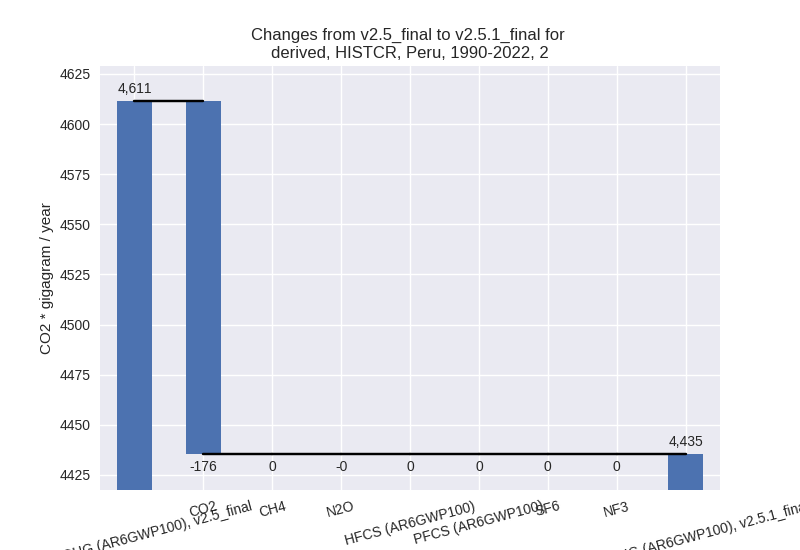
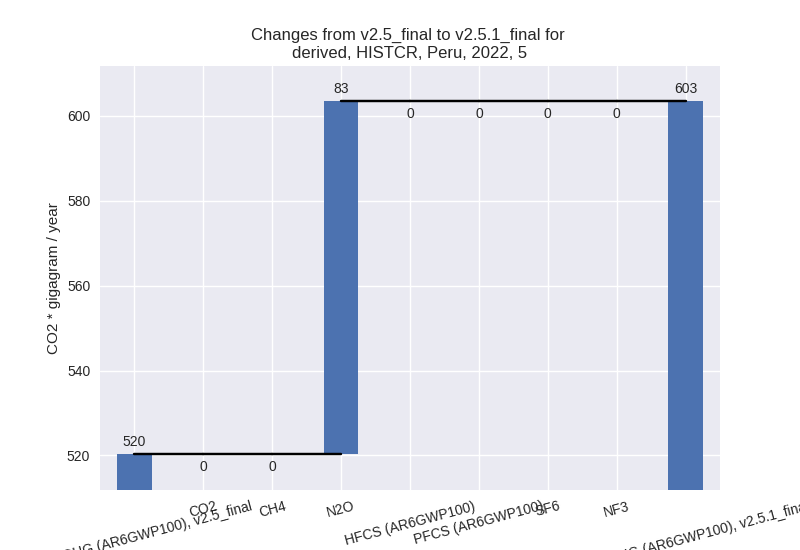
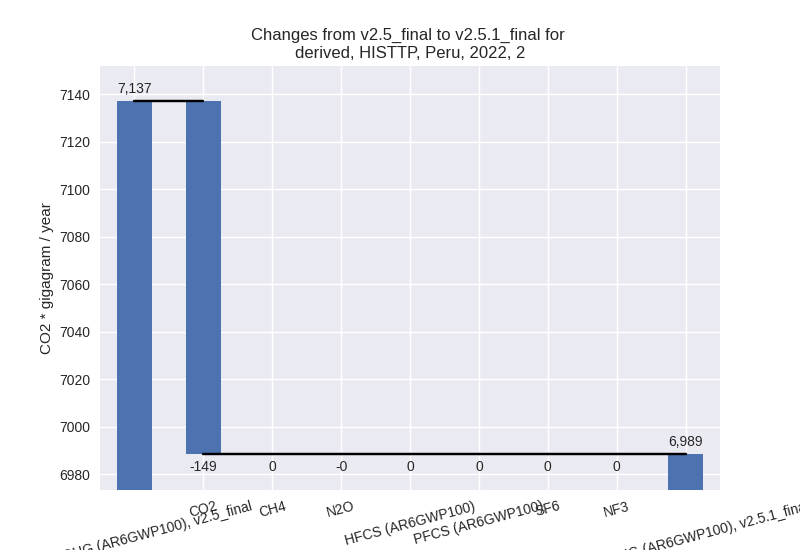
For each scenario and time frame the changes are displayed for all individual sectors and all individual gases. In the sector plot we use aggregate Kyoto GHGs in AR6GWP100. In the gas plot we usenational total emissions without LULUCF. ## country reported scenario
2022

1990-2022
third party scenario
2022
1990-2022

Detailed changes for the scenarios:
country reported scenario (HISTCR):
Most important changes per time frame
For 2022 the following sector-gas combinations have the highest absolute impact on national total KyotoGHG (AR6GWP100) emissions in 2022 (top 5):
- 1: 1.B.2, CH4 with -1255.98 Gg CO2 / year (-11.1%)
- 2: 3.A, CH4 with 356.46 Gg CO2 / year (2.3%)
- 3: M.AG.ELV, N2O with 341.81 Gg CO2 / year (3.4%)
- 4: 1.A, CH4 with 225.76 Gg CO2 / year (23.1%)
- 5: 2, CO2 with -178.81 Gg CO2 / year (-2.3%)
For 1990-2022 the following sector-gas combinations have the highest absolute impact on national total KyotoGHG (AR6GWP100) emissions in 1990-2022 (top 5):
- 1: 1.B.2, CH4 with -244.12 Gg CO2 / year (-3.2%)
- 2: 2, CO2 with -176.06 Gg CO2 / year (-4.1%)
- 3: 1.B.1, CO2 with -65.82 Gg CO2 / year (-86.0%)
- 4: 1.A, CH4 with 19.83 Gg CO2 / year (2.0%)
- 5: M.AG.ELV, N2O with 19.73 Gg CO2 / year (0.2%)
Changes in the main sectors for aggregate KyotoGHG (AR6GWP100) are
- 1: Total sectoral emissions in 2022 are 66277.68 Gg CO2 / year which is 59.0% of M.0.EL emissions. 2022 Emissions have changed by -1.6% (-1047.68 Gg CO2 / year). 1990-2022 Emissions have changed by -0.7% (-288.69 Gg CO2 / year).
- 2: Total sectoral emissions in 2022 are 9271.46 Gg
CO2 / year which is 8.3% of M.0.EL emissions. 2022 Emissions have
changed by -1.9% (-178.86 Gg CO2 /
year). 1990-2022 Emissions have changed by -3.8% (-176.06 Gg CO2 / year). For
1990-2022 the changes per gas
are:
- M.AG: Total sectoral emissions in 2022 are 29386.67 Gg CO2 / year which is 26.2% of M.0.EL emissions. 2022 Emissions have changed by 1.9% (544.58 Gg CO2 / year). 1990-2022 Emissions have changed by 0.1% (30.99 Gg CO2 / year).
- 4: Total sectoral emissions in 2022 are 6706.80 Gg CO2 / year which is 6.0% of M.0.EL emissions. 2022 Emissions have changed by 0.9% (58.75 Gg CO2 / year). 1990-2022 Emissions have changed by 0.0% (1.78 Gg CO2 / year).
- 5: Total sectoral emissions in 2022 are 603.45 Gg
CO2 / year which is 0.5% of M.0.EL emissions. 2022 Emissions have
changed by 16.0% (83.17 Gg CO2 /
year). 1990-2022 Emissions have changed by 0.8% (2.52 Gg CO2 / year). For 2022 the
changes per gas
are:
third party scenario (HISTTP):
Most important changes per time frame
For 2022 the following sector-gas combinations have the highest absolute impact on national total KyotoGHG (AR6GWP100) emissions in 2022 (top 5):
- 1: 1.A, CO2 with 2280.23 Gg CO2 / year (4.2%)
- 2: 1.B.2, CH4 with -1911.67 Gg CO2 / year (-23.2%)
- 3: M.AG.ELV, CO2 with 530.65 Gg CO2 / year (119.7%)
- 4: M.AG.ELV, N2O with 198.71 Gg CO2 / year (2.7%)
- 5: 1.A, CH4 with 171.21 Gg CO2 / year (20.9%)
For 1990-2022 the following sector-gas combinations have the highest absolute impact on national total KyotoGHG (AR6GWP100) emissions in 1990-2022 (top 5):
- 1: 1.A, CO2 with 348.53 Gg CO2 / year (1.1%)
- 2: 1.B.2, CH4 with -324.26 Gg CO2 / year (-8.3%)
- 3: M.AG.ELV, CO2 with 169.67 Gg CO2 / year (51.3%)
- 4: 3.A, CH4 with -71.82 Gg CO2 / year (-0.5%)
- 5: 1.B.1, CO2 with -65.82 Gg CO2 / year (-86.0%)
Changes in the main sectors for aggregate KyotoGHG (AR6GWP100) are
- 1: Total sectoral emissions in 2022 are 64682.36 Gg CO2 / year which is 57.6% of M.0.EL emissions. 2022 Emissions have changed by 0.6% (404.01 Gg CO2 / year). 1990-2022 Emissions have changed by -0.1% (-22.37 Gg CO2 / year).
- 2: Total sectoral emissions in 2022 are 6988.50 Gg
CO2 / year which is 6.2% of M.0.EL emissions. 2022 Emissions have
changed by -2.1% (-148.59 Gg CO2 /
year). 1990-2022 Emissions have changed by -0.8% (-30.40 Gg CO2 / year). For 2022 the
changes per gas
are:
- M.AG: Total sectoral emissions in 2022 are 29145.97
Gg CO2 / year which is 26.0% of M.0.EL emissions. 2022 Emissions have
changed by 2.1% (598.41 Gg CO2 /
year). 1990-2022 Emissions have changed by 0.3% (84.71 Gg CO2 / year). For 2022 the
changes per gas
are:

The changes come from the following subsectors:- 3.A: Total sectoral emissions in 2022 are 17695.33 Gg CO2 / year which is 60.7% of category M.AG emissions. 2022 Emissions have changed by 0.1% (8.96 Gg CO2 / year). 1990-2022 Emissions have changed by -0.4% (-71.10 Gg CO2 / year).
- M.AG.ELV: Total sectoral emissions in 2022 are
11450.64 Gg CO2 / year which is 39.3% of category M.AG emissions. 2022
Emissions have changed by 5.4%
(589.45 Gg CO2 / year). 1990-2022 Emissions have changed by 1.8% (155.81 Gg CO2 / year). For 2022 the
changes per gas
are:

There is no subsector information available in PRIMAP-hist.
- 4: Total sectoral emissions in 2022 are 10883.00 Gg CO2 / year which is 9.7% of M.0.EL emissions. 2022 Emissions have changed by -0.5% (-51.71 Gg CO2 / year). 1990-2022 Emissions have changed by -0.0% (-1.57 Gg CO2 / year).
- 5: Total sectoral emissions in 2022 are 603.45 Gg
CO2 / year which is 0.5% of M.0.EL emissions. 2022 Emissions have
changed by 16.0% (83.17 Gg CO2 /
year). 1990-2022 Emissions have changed by 0.8% (2.52 Gg CO2 / year). For 2022 the
changes per gas
are:
