Changes in PRIMAP-hist v2.5.1_final compared to v2.5_final for Poland
2024-02-29
Johannes Gütschow
Change analysis for Poland for PRIMAP-hist v2.5.1_final compared to v2.5_final
Overview over emissions by sector and gas
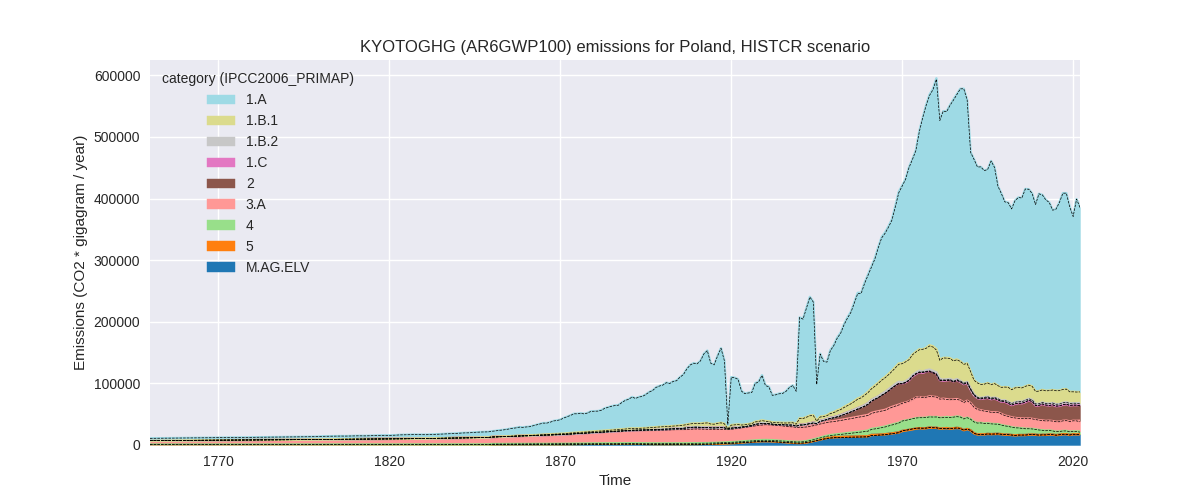
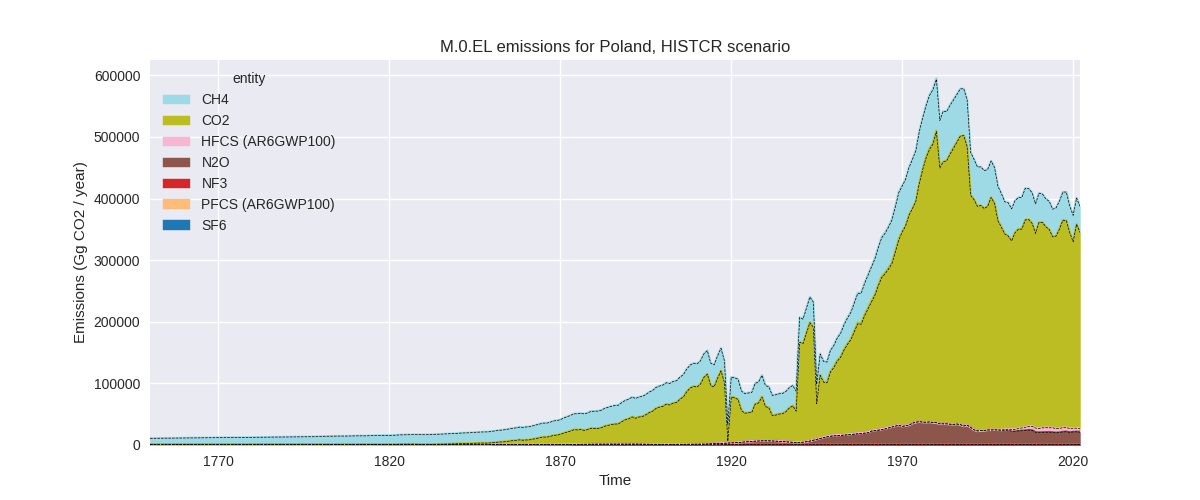
The following figures show the aggregate national total emissions excluding LULUCF AR6GWP100 for the country reported priority scenario. The dotted linesshow the v2.5_final data.

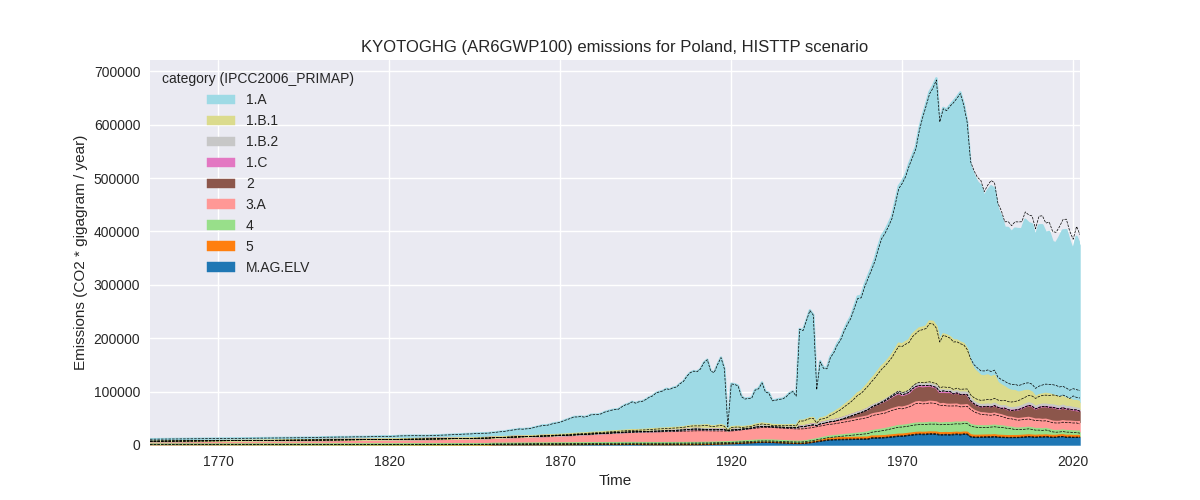
The following figures show the aggregate national total emissions excluding LULUCF AR6GWP100 for the third party priority scenario. The dotted linesshow the v2.5_final data.


Overview over changes
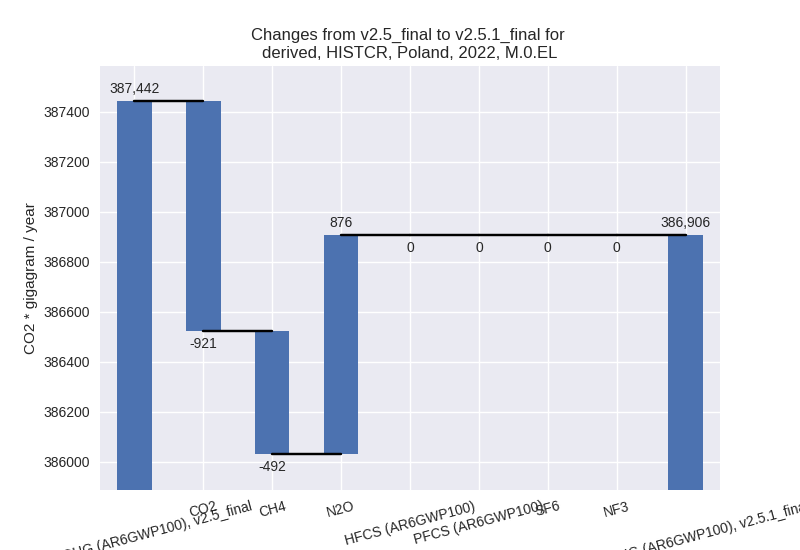
In the country reported priority scenario we have the following changes for aggregate Kyoto GHG and national total emissions excluding LULUCF (M.0.EL):
- Emissions in 2022 have changed by -0.1%% (-536.33 Gg CO2 / year)
- Emissions in 1990-2022 have changed by -0.0%% (-16.25 Gg CO2 / year)
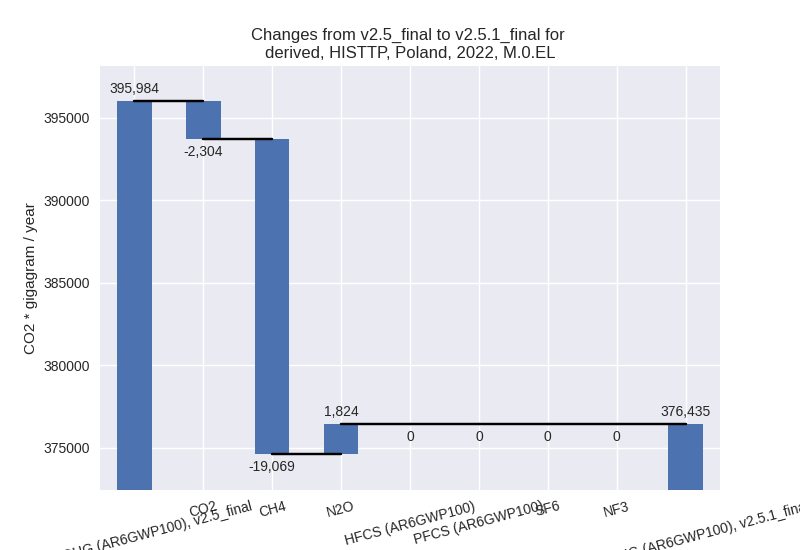
In the third party priority scenario we have the following changes for aggregate Kyoto GHG and national total emissions excluding LULUCF (M.0.EL):
- Emissions in 2022 have changed by -4.9%% (-19549.14 Gg CO2 / year)
- Emissions in 1990-2022 have changed by -3.4%% (-14903.04 Gg CO2 / year)
Most important changes per scenario and time frame
In the country reported priority scenario the following sector-gas combinations have the highest absolute impact on national total KyotoGHG (AR6GWP100) emissions in 2022 (top 5):
- 1: 1.B.1, CH4 with -1445.52 Gg CO2 / year (-8.7%)
- 2: 4, CH4 with 996.76 Gg CO2 / year (38.7%)
- 3: 2, CO2 with -547.59 Gg CO2 / year (-2.7%)
- 4: 3.A, CH4 with 497.85 Gg CO2 / year (3.2%)
- 5: 2, N2O with 449.67 Gg CO2 / year (363.5%)
In the country reported priority scenario the following sector-gas combinations have the highest absolute impact on national total KyotoGHG (AR6GWP100) emissions in 1990-2022 (top 5):
- 1: 1.B.1, CH4 with -43.80 Gg CO2 / year (-0.2%)
- 2: 4, CH4 with 30.20 Gg CO2 / year (0.3%)
- 3: 2, CO2 with -16.59 Gg CO2 / year (-0.1%)
- 4: 3.A, CH4 with 15.09 Gg CO2 / year (0.1%)
- 5: 2, N2O with 13.63 Gg CO2 / year (0.6%)
In the third party priority scenario the following sector-gas combinations have the highest absolute impact on national total KyotoGHG (AR6GWP100) emissions in 2022 (top 5):
- 1: 1.B.2, CH4 with -22082.01 Gg CO2 / year (-89.5%)
- 2: 2, CO2 with -1905.27 Gg CO2 / year (-11.3%)
- 3: M.AG.ELV, N2O with 1610.34 Gg CO2 / year (11.5%)
- 4: 4, CH4 with 1321.56 Gg CO2 / year (22.4%)
- 5: 1.A, CH4 with 973.66 Gg CO2 / year (20.3%)
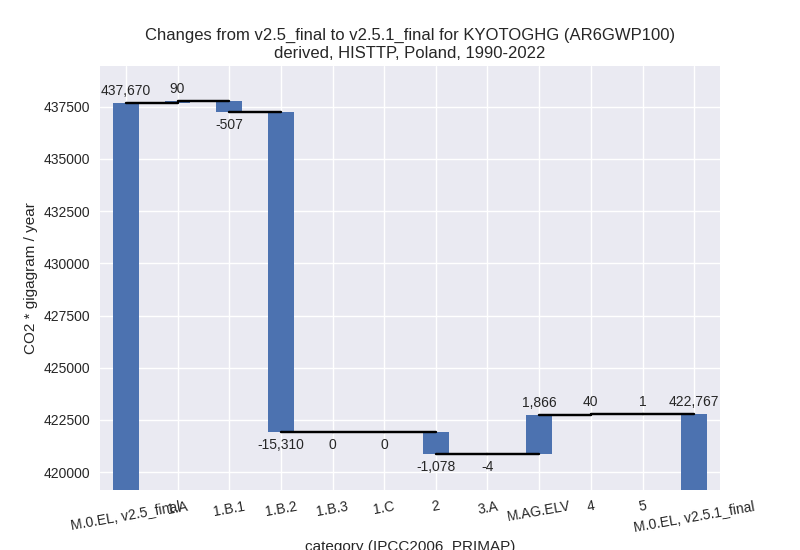
In the third party priority scenario the following sector-gas combinations have the highest absolute impact on national total KyotoGHG (AR6GWP100) emissions in 1990-2022 (top 5):
- 1: 1.B.2, CH4 with -15310.77 Gg CO2 / year (-85.6%)
- 2: M.AG.ELV, N2O with 1866.08 Gg CO2 / year (13.3%)
- 3: 2, CO2 with -1066.41 Gg CO2 / year (-8.1%)
- 4: 1.B.1, CH4 with -365.73 Gg CO2 / year (-1.3%)
- 5: 1.A, CH4 with 170.84 Gg CO2 / year (3.1%)
Notes on data changes
No country specific notes present for this changelog.
Changes by sector and gas
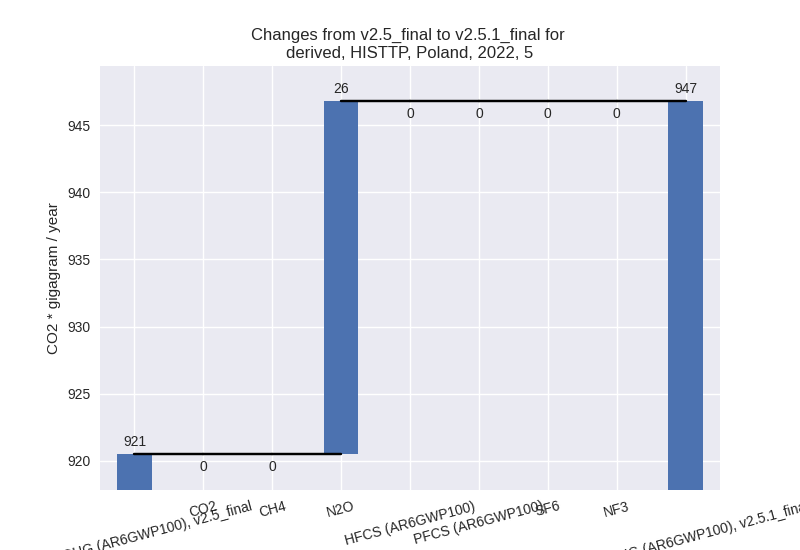
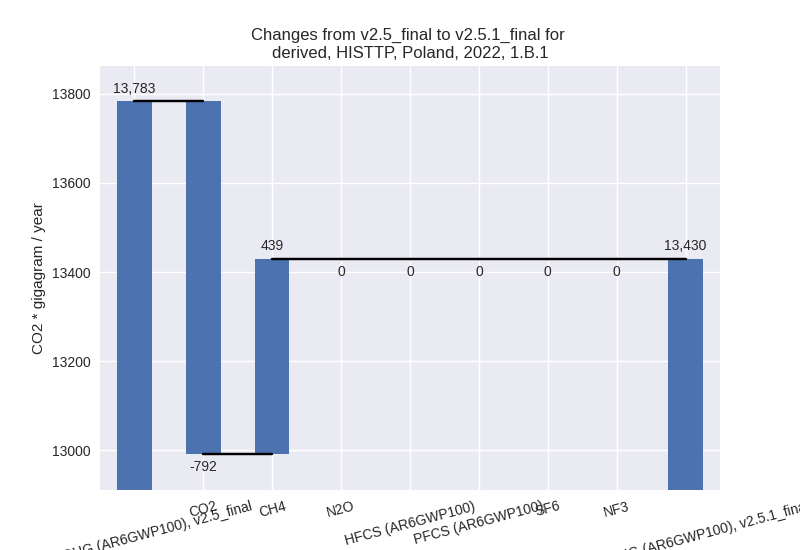
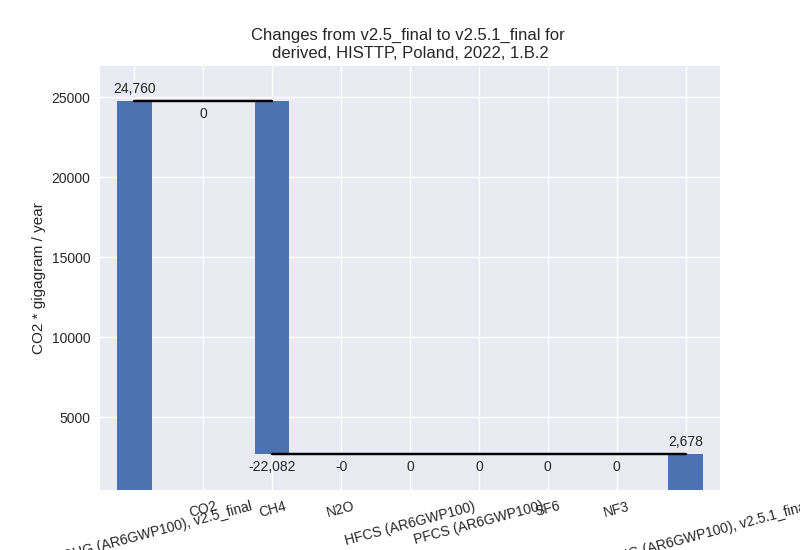
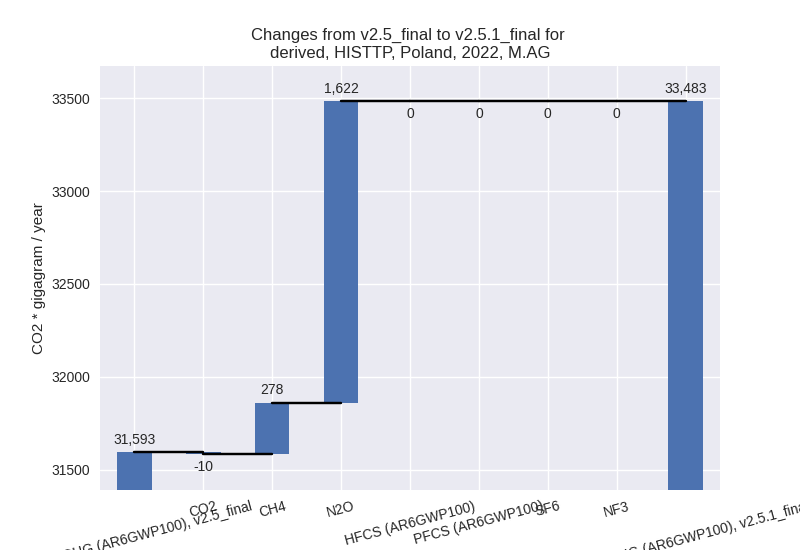
For each scenario and time frame the changes are displayed for all individual sectors and all individual gases. In the sector plot we use aggregate Kyoto GHGs in AR6GWP100. In the gas plot we usenational total emissions without LULUCF. ## country reported scenario
2022
1990-2022


third party scenario
2022
1990-2022

Detailed changes for the scenarios:
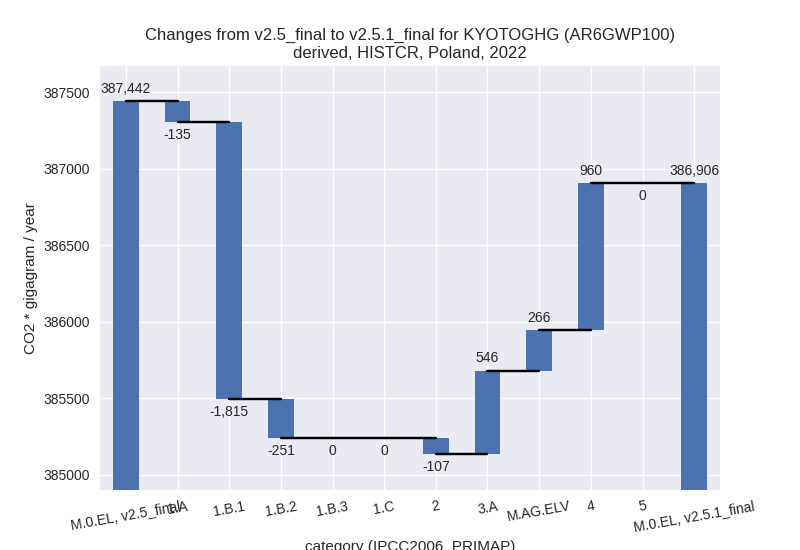
country reported scenario (HISTCR):
Most important changes per time frame
For 2022 the following sector-gas combinations have the highest absolute impact on national total KyotoGHG (AR6GWP100) emissions in 2022 (top 5):
- 1: 1.B.1, CH4 with -1445.52 Gg CO2 / year (-8.7%)
- 2: 4, CH4 with 996.76 Gg CO2 / year (38.7%)
- 3: 2, CO2 with -547.59 Gg CO2 / year (-2.7%)
- 4: 3.A, CH4 with 497.85 Gg CO2 / year (3.2%)
- 5: 2, N2O with 449.67 Gg CO2 / year (363.5%)
For 1990-2022 the following sector-gas combinations have the highest absolute impact on national total KyotoGHG (AR6GWP100) emissions in 1990-2022 (top 5):
- 1: 1.B.1, CH4 with -43.80 Gg CO2 / year (-0.2%)
- 2: 4, CH4 with 30.20 Gg CO2 / year (0.3%)
- 3: 2, CO2 with -16.59 Gg CO2 / year (-0.1%)
- 4: 3.A, CH4 with 15.09 Gg CO2 / year (0.1%)
- 5: 2, N2O with 13.63 Gg CO2 / year (0.6%)
Changes in the main sectors for aggregate KyotoGHG (AR6GWP100) are
- 1: Total sectoral emissions in 2022 are 321672.18 Gg CO2 / year which is 83.1% of M.0.EL emissions. 2022 Emissions have changed by -0.7% (-2201.03 Gg CO2 / year). 1990-2022 Emissions have changed by -0.0% (-66.70 Gg CO2 / year).
- 2: Total sectoral emissions in 2022 are 25808.17 Gg CO2 / year which is 6.7% of M.0.EL emissions. 2022 Emissions have changed by -0.4% (-107.03 Gg CO2 / year). 1990-2022 Emissions have changed by -0.0% (-3.24 Gg CO2 / year).
- M.AG: Total sectoral emissions in 2022 are 34727.15
Gg CO2 / year which is 9.0% of M.0.EL emissions. 2022 Emissions have
changed by 2.4% (811.56 Gg CO2 /
year). 1990-2022 Emissions have changed by 0.1% (24.59 Gg CO2 / year). For 2022 the
changes per gas
are:

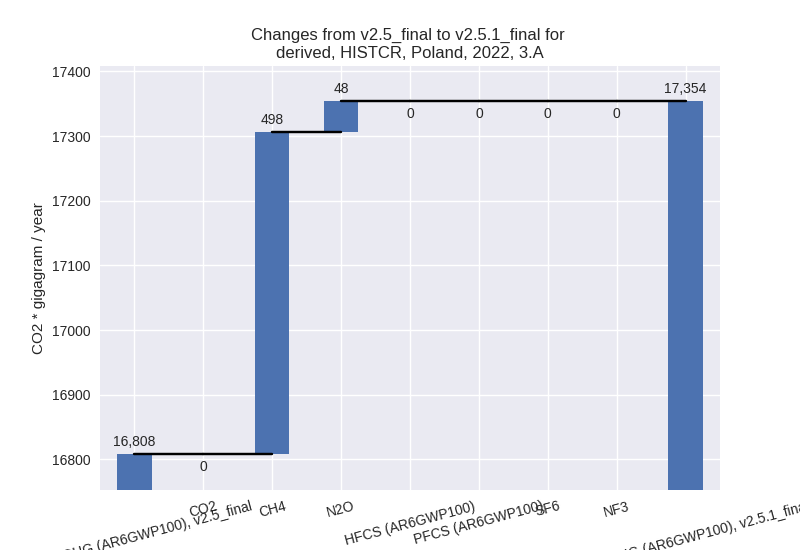
The changes come from the following subsectors:- 3.A: Total sectoral emissions in 2022 are 17353.76
Gg CO2 / year which is 50.0% of category M.AG emissions. 2022 Emissions
have changed by 3.2% (545.83 Gg CO2
/ year). 1990-2022 Emissions have changed by 0.1% (16.54 Gg CO2 / year). For 2022 the
changes per gas
are:
There is no subsector information available in PRIMAP-hist. - M.AG.ELV: Total sectoral emissions in 2022 are 17373.39 Gg CO2 / year which is 50.0% of category M.AG emissions. 2022 Emissions have changed by 1.6% (265.73 Gg CO2 / year). 1990-2022 Emissions have changed by 0.0% (8.05 Gg CO2 / year).
- 3.A: Total sectoral emissions in 2022 are 17353.76
Gg CO2 / year which is 50.0% of category M.AG emissions. 2022 Emissions
have changed by 3.2% (545.83 Gg CO2
/ year). 1990-2022 Emissions have changed by 0.1% (16.54 Gg CO2 / year). For 2022 the
changes per gas
are:
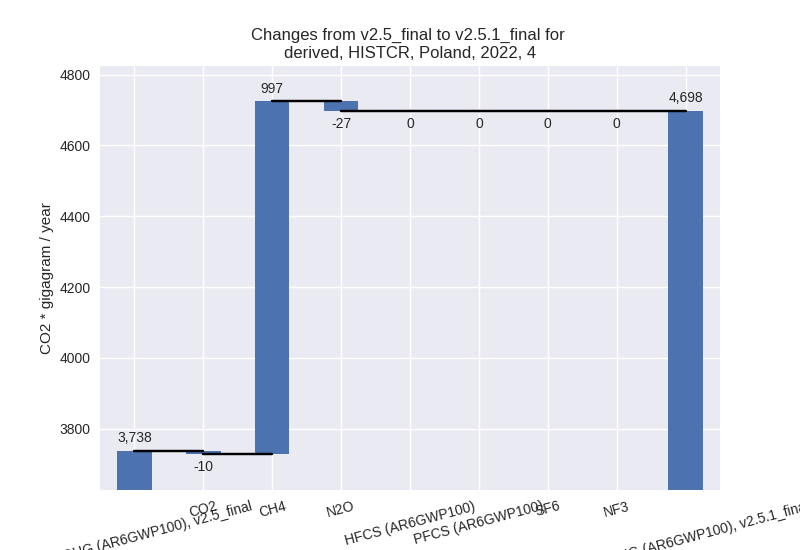
- 4: Total sectoral emissions in 2022 are 4698.07 Gg
CO2 / year which is 1.2% of M.0.EL emissions. 2022 Emissions have
changed by 25.7% (960.17 Gg CO2 /
year). 1990-2022 Emissions have changed by 0.3% (29.10 Gg CO2 / year). For 2022 the
changes per gas
are:
- 5: No data
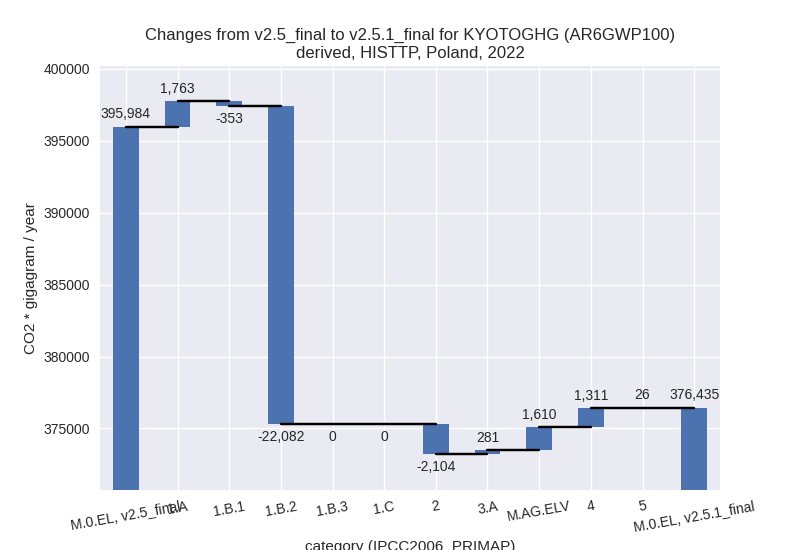
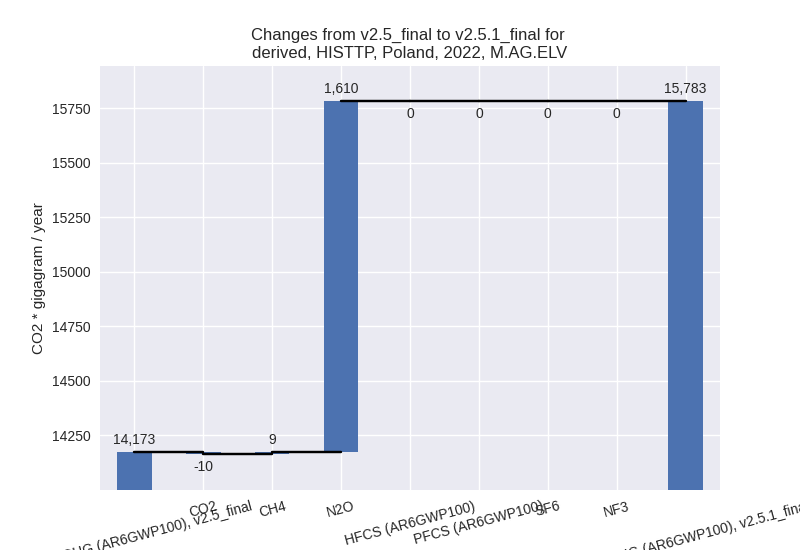
third party scenario (HISTTP):
Most important changes per time frame
For 2022 the following sector-gas combinations have the highest absolute impact on national total KyotoGHG (AR6GWP100) emissions in 2022 (top 5):
- 1: 1.B.2, CH4 with -22082.01 Gg CO2 / year (-89.5%)
- 2: 2, CO2 with -1905.27 Gg CO2 / year (-11.3%)
- 3: M.AG.ELV, N2O with 1610.34 Gg CO2 / year (11.5%)
- 4: 4, CH4 with 1321.56 Gg CO2 / year (22.4%)
- 5: 1.A, CH4 with 973.66 Gg CO2 / year (20.3%)
For 1990-2022 the following sector-gas combinations have the highest absolute impact on national total KyotoGHG (AR6GWP100) emissions in 1990-2022 (top 5):
- 1: 1.B.2, CH4 with -15310.77 Gg CO2 / year (-85.6%)
- 2: M.AG.ELV, N2O with 1866.08 Gg CO2 / year (13.3%)
- 3: 2, CO2 with -1066.41 Gg CO2 / year (-8.1%)
- 4: 1.B.1, CH4 with -365.73 Gg CO2 / year (-1.3%)
- 5: 1.A, CH4 with 170.84 Gg CO2 / year (3.1%)
Changes in the main sectors for aggregate KyotoGHG (AR6GWP100) are
- 1: Total sectoral emissions in 2022 are 312061.51
Gg CO2 / year which is 82.9% of M.0.EL emissions. 2022 Emissions have
changed by -6.2% (-20672.14 Gg CO2 /
year). 1990-2022 Emissions have changed by -4.3% (-15727.72 Gg CO2 / year). For 2022
the changes per gas
are:
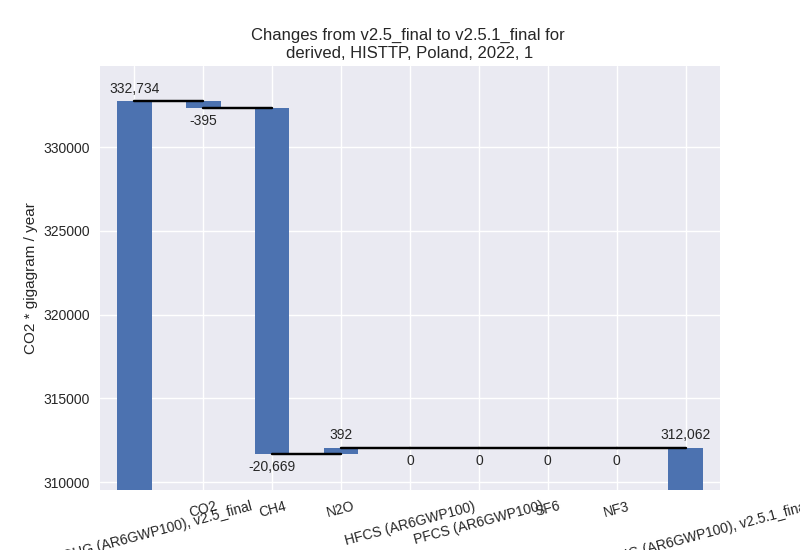
For 1990-2022 the changes per gas are:
The changes come from the following subsectors:- 1.A: Total sectoral emissions in 2022 are 293909.04 Gg CO2 / year which is 94.8% of category 1 emissions. 2022 Emissions have changed by 0.6% (1762.87 Gg CO2 / year). 1990-2022 Emissions have changed by 0.0% (89.53 Gg CO2 / year).
- 1.B.1: Total sectoral emissions in 2022 are
13430.24 Gg CO2 / year which is 4.3% of category 1 emissions. 2022
Emissions have changed by -2.6%
(-352.85 Gg CO2 / year). 1990-2022 Emissions have changed by -1.6% (-506.91 Gg CO2 / year). For 2022
the changes per gas
are:
There is no subsector information available in PRIMAP-hist. - 1.B.2: Total sectoral emissions in 2022 are 2677.82
Gg CO2 / year which is 0.9% of category 1 emissions. 2022 Emissions have
changed by -89.2% (-22082.17 Gg CO2
/ year). 1990-2022 Emissions have changed by -85.1% (-15310.34 Gg CO2 / year). For 2022
the changes per gas
are:
For 1990-2022 the changes per gas are:
There is no subsector information available in PRIMAP-hist.
- 2: Total sectoral emissions in 2022 are 21552.39 Gg
CO2 / year which is 5.7% of M.0.EL emissions. 2022 Emissions have
changed by -8.9% (-2104.24 Gg CO2 /
year). 1990-2022 Emissions have changed by -5.1% (-1078.23 Gg CO2 / year). For 2022
the changes per gas
are:

For 1990-2022 the changes per gas are: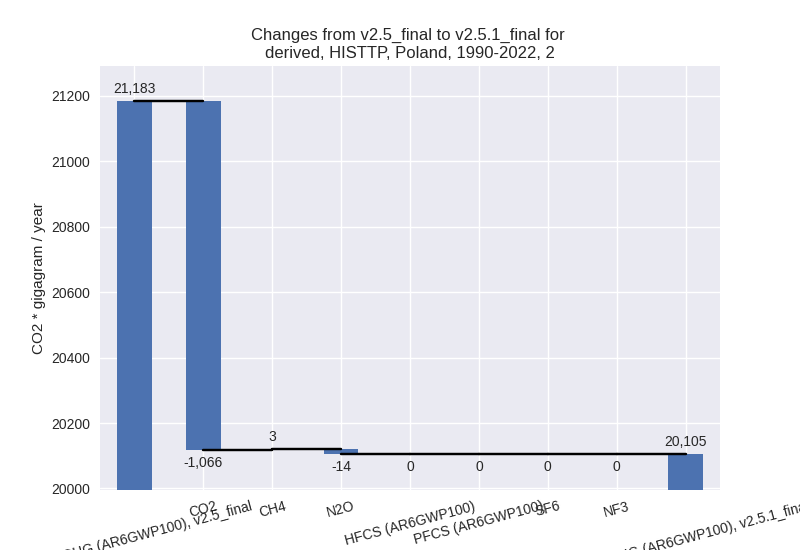
- M.AG: Total sectoral emissions in 2022 are 33483.26
Gg CO2 / year which is 8.9% of M.0.EL emissions. 2022 Emissions have
changed by 6.0% (1890.43 Gg CO2 /
year). 1990-2022 Emissions have changed by 5.5% (1862.40 Gg CO2 / year). For 2022 the
changes per gas
are:
For 1990-2022 the changes per gas are: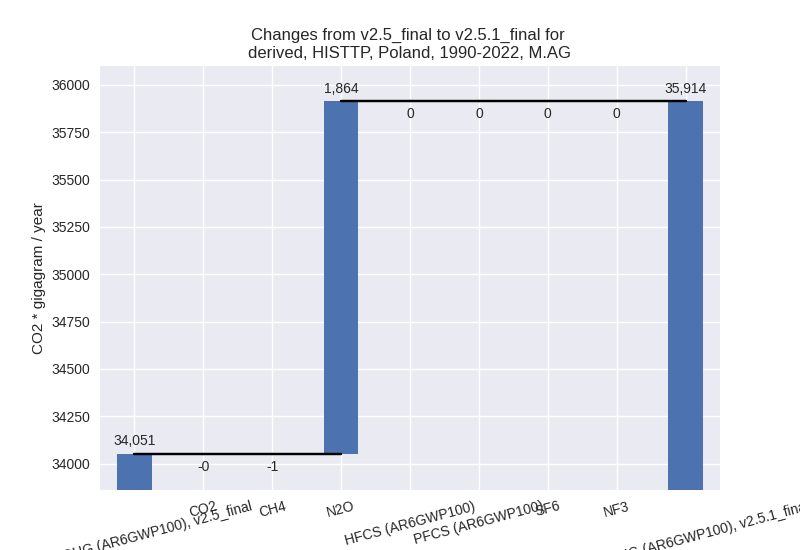
The changes come from the following subsectors:- 3.A: Total sectoral emissions in 2022 are 17700.40 Gg CO2 / year which is 52.9% of category M.AG emissions. 2022 Emissions have changed by 1.6% (280.52 Gg CO2 / year). 1990-2022 Emissions have changed by -0.0% (-3.89 Gg CO2 / year).
- M.AG.ELV: Total sectoral emissions in 2022 are
15782.87 Gg CO2 / year which is 47.1% of category M.AG emissions. 2022
Emissions have changed by 11.4%
(1609.92 Gg CO2 / year). 1990-2022 Emissions have changed by 13.2% (1866.29 Gg CO2 / year). For 2022
the changes per gas
are:
For 1990-2022 the changes per gas are: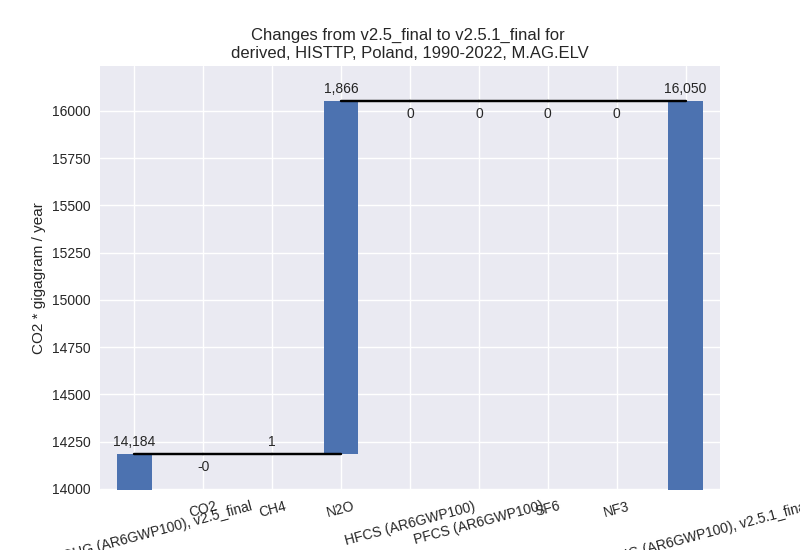
There is no subsector information available in PRIMAP-hist.
- 4: Total sectoral emissions in 2022 are 8390.75 Gg
CO2 / year which is 2.2% of M.0.EL emissions. 2022 Emissions have
changed by 18.5% (1310.54 Gg CO2 /
year). 1990-2022 Emissions have changed by 0.3% (39.71 Gg CO2 / year). For 2022 the
changes per gas
are:

- 5: Total sectoral emissions in 2022 are 946.77 Gg
CO2 / year which is 0.3% of M.0.EL emissions. 2022 Emissions have
changed by 2.9% (26.27 Gg CO2 /
year). 1990-2022 Emissions have changed by 0.1% (0.80 Gg CO2 / year). For 2022 the
changes per gas
are: