Changes in PRIMAP-hist v2.5.1_final compared to v2.5_final for Portugal
2024-02-29
Johannes Gütschow
Change analysis for Portugal for PRIMAP-hist v2.5.1_final compared to v2.5_final
Overview over emissions by sector and gas
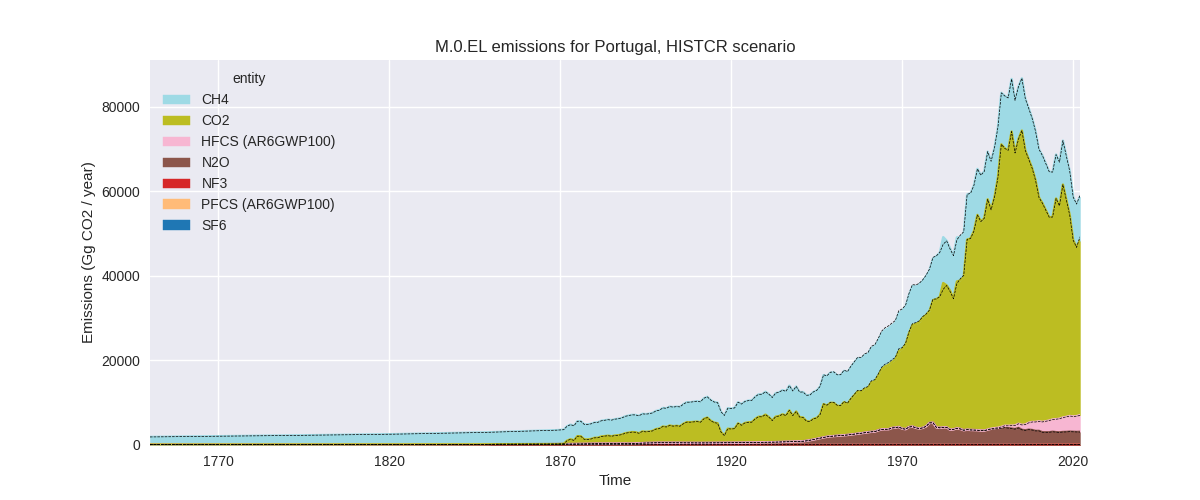
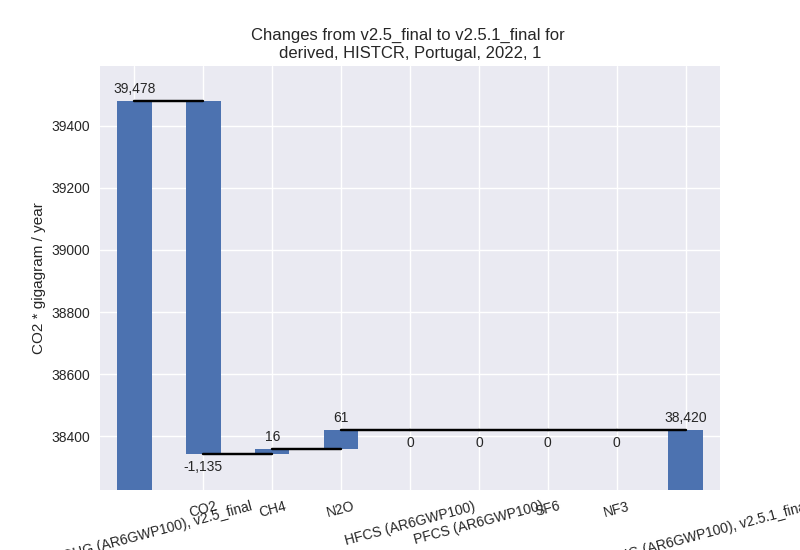
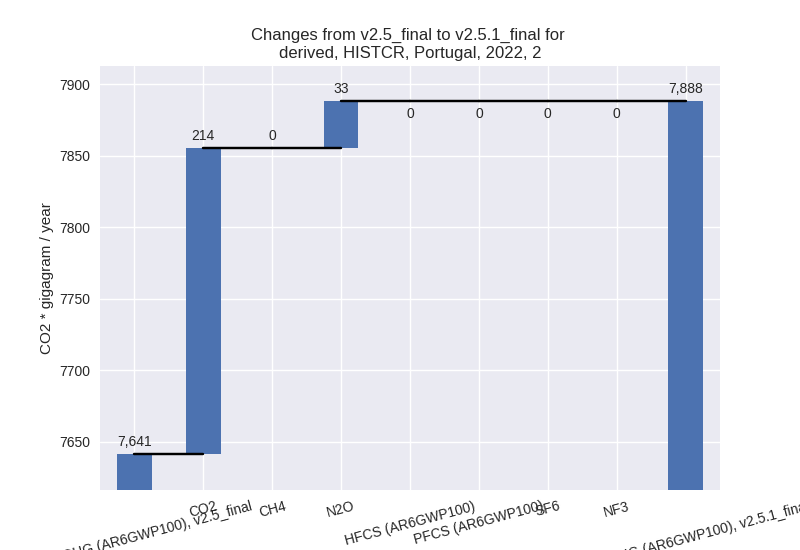
The following figures show the aggregate national total emissions excluding LULUCF AR6GWP100 for the country reported priority scenario. The dotted linesshow the v2.5_final data.
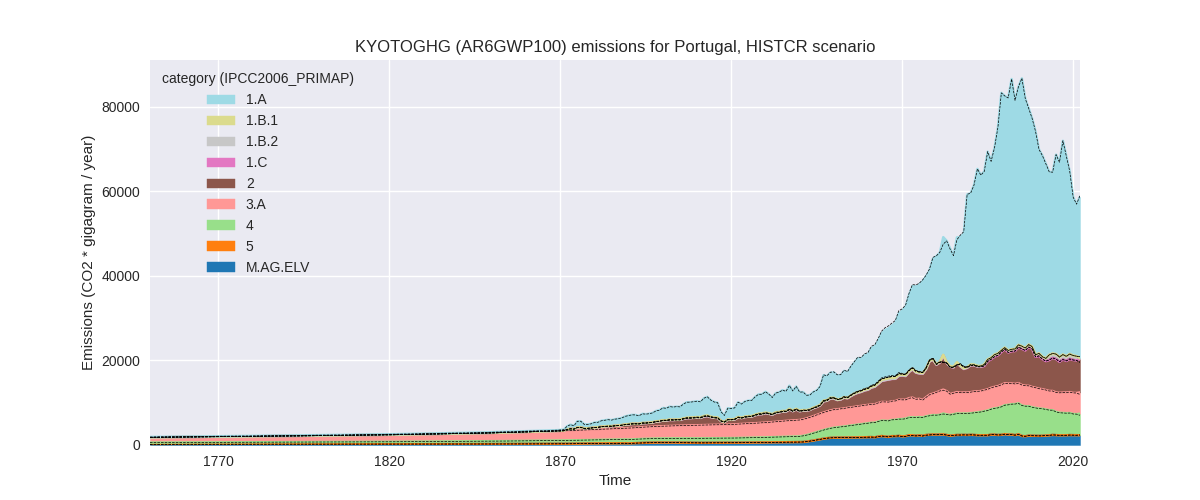
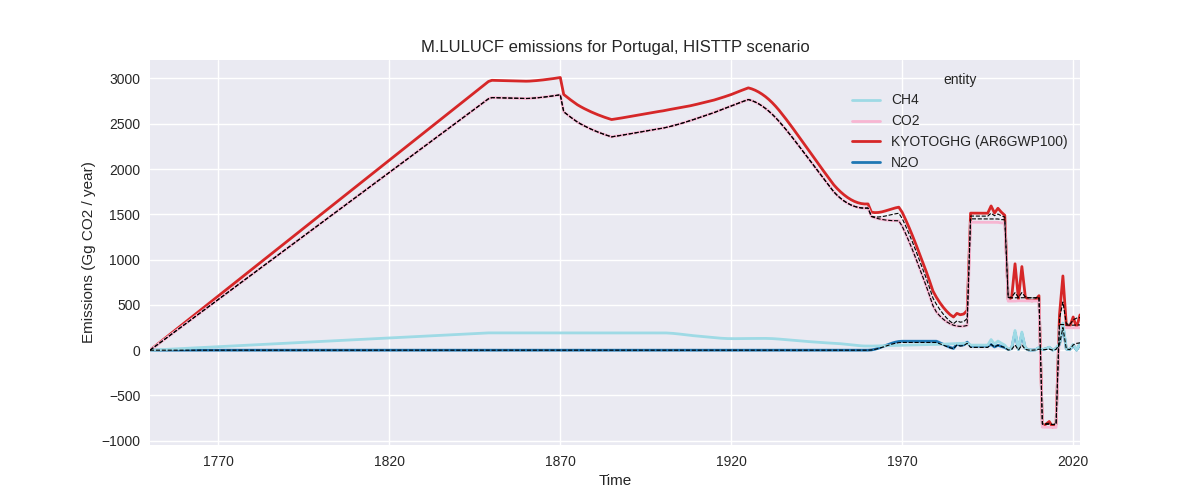
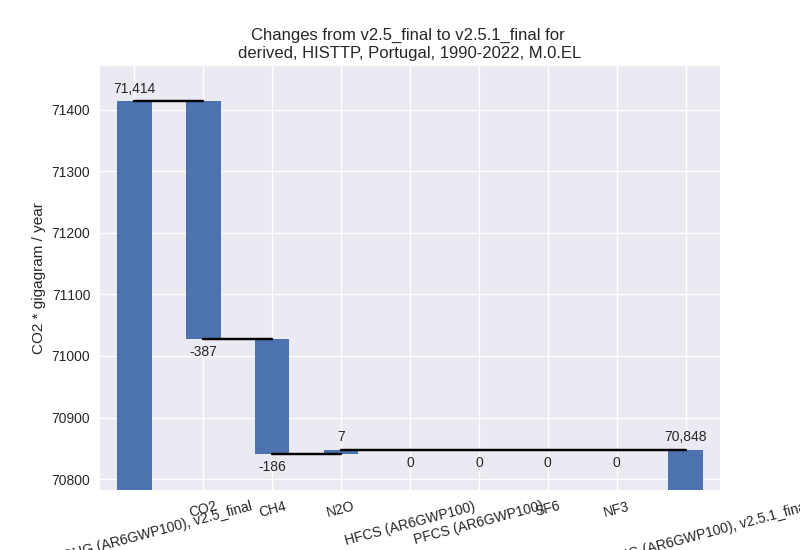
The following figures show the aggregate national total emissions excluding LULUCF AR6GWP100 for the third party priority scenario. The dotted linesshow the v2.5_final data.


Overview over changes
In the country reported priority scenario we have the following changes for aggregate Kyoto GHG and national total emissions excluding LULUCF (M.0.EL):
- Emissions in 2022 have changed by -0.5%% (-290.34 Gg CO2 / year)
- Emissions in 1990-2022 have changed by -0.0%% (-8.80 Gg CO2 / year)
In the third party priority scenario we have the following changes for aggregate Kyoto GHG and national total emissions excluding LULUCF (M.0.EL):
- Emissions in 2022 have changed by 2.8%% (1616.38 Gg CO2 / year)
- Emissions in 1990-2022 have changed by -0.8%% (-565.57 Gg CO2 / year)
Most important changes per scenario and time frame
In the country reported priority scenario the following sector-gas combinations have the highest absolute impact on national total KyotoGHG (AR6GWP100) emissions in 2022 (top 5):
- 1: 1.B.2, CO2 with -1135.40 Gg CO2 / year (-93.3%)
- 2: 4, CH4 with 434.81 Gg CO2 / year (9.9%)
- 3: 2, CO2 with 213.80 Gg CO2 / year (6.0%)
- 4: 3.A, CH4 with 118.26 Gg CO2 / year (2.5%)
- 5: 1.A, N2O with 60.97 Gg CO2 / year (12.4%)
In the country reported priority scenario the following sector-gas combinations have the highest absolute impact on national total KyotoGHG (AR6GWP100) emissions in 1990-2022 (top 5):
- 1: 1.B.2, CO2 with -34.41 Gg CO2 / year (-5.9%)
- 2: 4, CH4 with 13.18 Gg CO2 / year (0.2%)
- 3: 2, CO2 with 6.48 Gg CO2 / year (0.1%)
- 4: 3.A, CH4 with 3.58 Gg CO2 / year (0.1%)
- 5: 1.A, N2O with 1.85 Gg CO2 / year (0.3%)
In the third party priority scenario the following sector-gas combinations have the highest absolute impact on national total KyotoGHG (AR6GWP100) emissions in 2022 (top 5):
- 1: 1.A, CO2 with 2126.40 Gg CO2 / year (5.9%)
- 2: 4, CH4 with 552.93 Gg CO2 / year (13.9%)
- 3: 2, CO2 with -351.75 Gg CO2 / year (-10.9%)
- 4: 1.B.2, CH4 with -300.13 Gg CO2 / year (-31.5%)
- 5: M.AG.ELV, CO2 with -243.25 Gg CO2 / year (-40.9%)
In the third party priority scenario the following sector-gas combinations have the highest absolute impact on national total KyotoGHG (AR6GWP100) emissions in 1990-2022 (top 5):
- 1: 2, CO2 with -542.75 Gg CO2 / year (-11.3%)
- 2: 1.B.2, CH4 with -190.47 Gg CO2 / year (-45.6%)
- 3: 1.A, CO2 with 172.90 Gg CO2 / year (0.4%)
- 4: 4, CH4 with 16.76 Gg CO2 / year (0.3%)
- 5: 1.B.1, CO2 with -9.20 Gg CO2 / year (-4.8%)
Notes on data changes
No country specific notes present for this changelog.
Changes by sector and gas
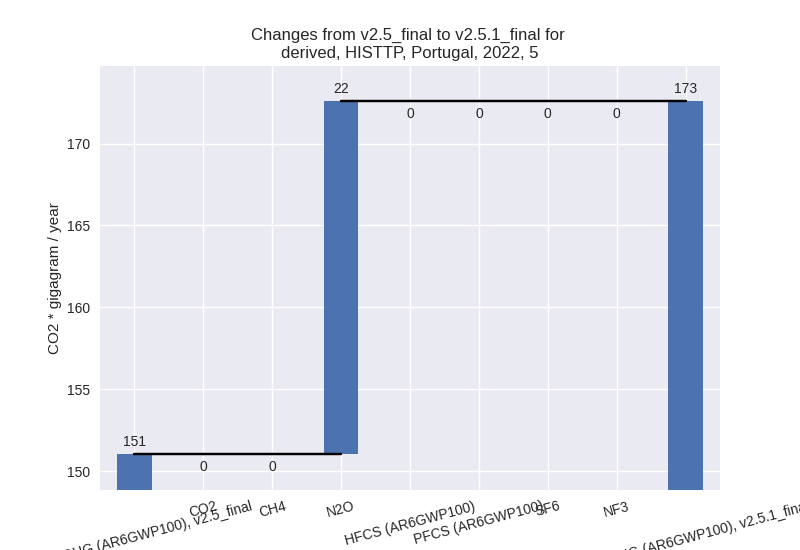
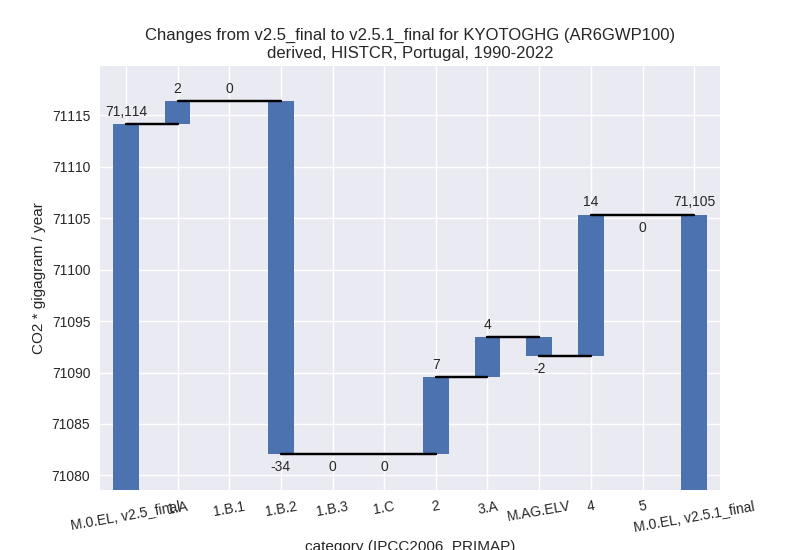
For each scenario and time frame the changes are displayed for all individual sectors and all individual gases. In the sector plot we use aggregate Kyoto GHGs in AR6GWP100. In the gas plot we usenational total emissions without LULUCF. ## country reported scenario
2022

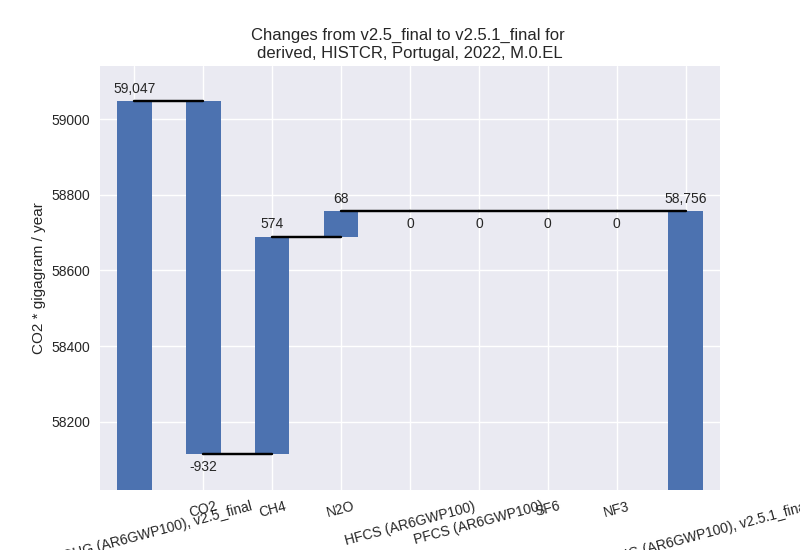
1990-2022

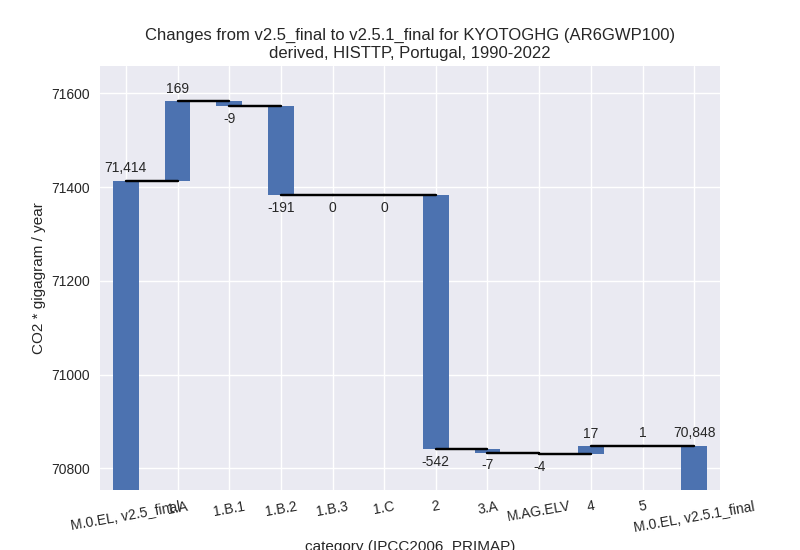
third party scenario
2022

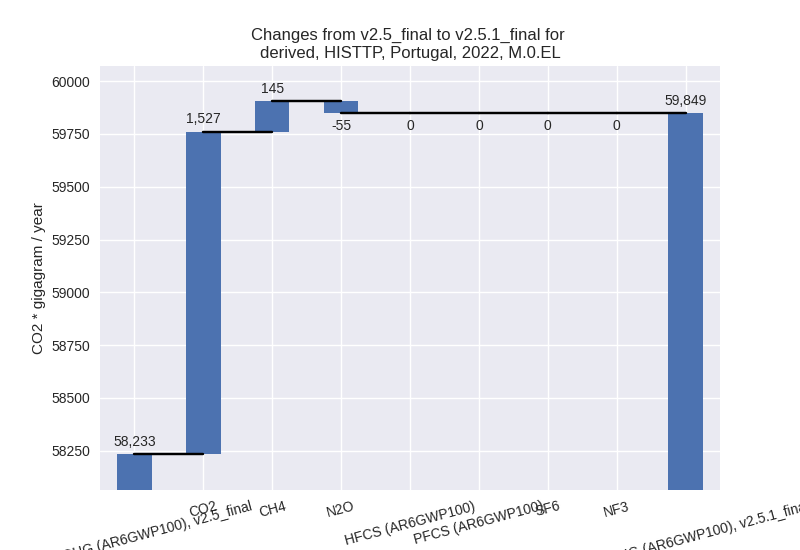
1990-2022
Detailed changes for the scenarios:
country reported scenario (HISTCR):
Most important changes per time frame
For 2022 the following sector-gas combinations have the highest absolute impact on national total KyotoGHG (AR6GWP100) emissions in 2022 (top 5):
- 1: 1.B.2, CO2 with -1135.40 Gg CO2 / year (-93.3%)
- 2: 4, CH4 with 434.81 Gg CO2 / year (9.9%)
- 3: 2, CO2 with 213.80 Gg CO2 / year (6.0%)
- 4: 3.A, CH4 with 118.26 Gg CO2 / year (2.5%)
- 5: 1.A, N2O with 60.97 Gg CO2 / year (12.4%)
For 1990-2022 the following sector-gas combinations have the highest absolute impact on national total KyotoGHG (AR6GWP100) emissions in 1990-2022 (top 5):
- 1: 1.B.2, CO2 with -34.41 Gg CO2 / year (-5.9%)
- 2: 4, CH4 with 13.18 Gg CO2 / year (0.2%)
- 3: 2, CO2 with 6.48 Gg CO2 / year (0.1%)
- 4: 3.A, CH4 with 3.58 Gg CO2 / year (0.1%)
- 5: 1.A, N2O with 1.85 Gg CO2 / year (0.3%)
Changes in the main sectors for aggregate KyotoGHG (AR6GWP100) are
- 1: Total sectoral emissions in 2022 are 38419.96 Gg
CO2 / year which is 65.4% of M.0.EL emissions. 2022 Emissions have
changed by -2.7% (-1058.08 Gg CO2 /
year). 1990-2022 Emissions have changed by -0.1% (-32.06 Gg CO2 / year). For 2022 the
changes per gas
are:
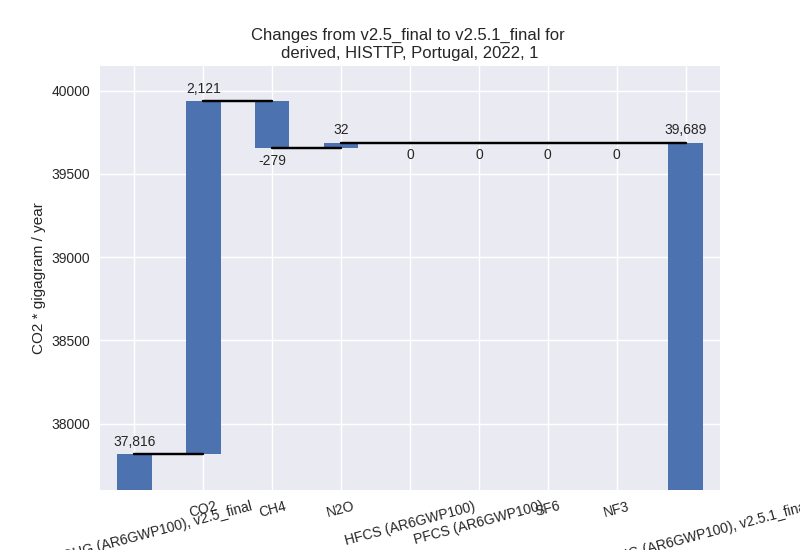
The changes come from the following subsectors:- 1.A: Total sectoral emissions in 2022 are 38215.16 Gg CO2 / year which is 99.6% of category 1 emissions. 2022 Emissions have changed by 0.2% (73.73 Gg CO2 / year). 1990-2022 Emissions have changed by 0.0% (2.23 Gg CO2 / year).
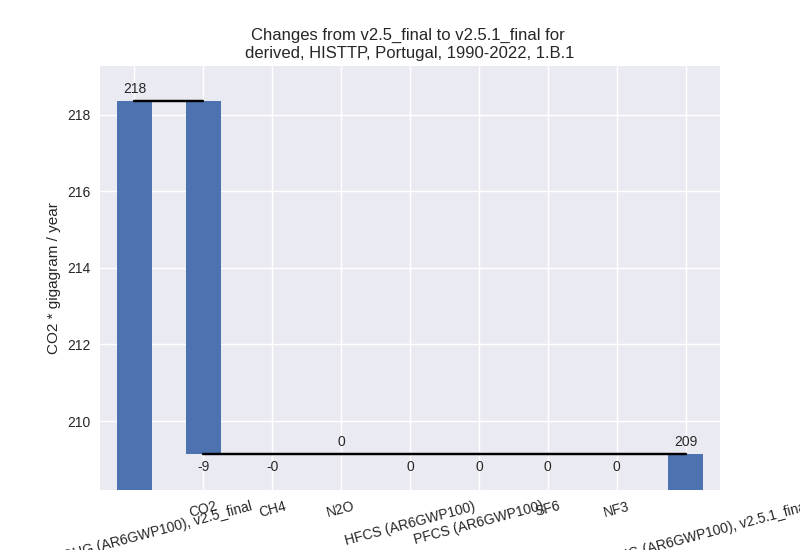
- 1.B.1: Total sectoral emissions in 2022 are 16.94
Gg CO2 / year which is 0.0% of category 1 emissions. 2022 Emissions have
changed by 3.1% (0.52 Gg CO2 /
year). 1990-2022 Emissions have changed by 0.0% (0.02 Gg CO2 / year). For 2022 the
changes per gas
are:

There is no subsector information available in PRIMAP-hist. - 1.B.2: Total sectoral emissions in 2022 are 150.94
Gg CO2 / year which is 0.4% of category 1 emissions. 2022 Emissions have
changed by -88.2% (-1132.33 Gg CO2 /
year). 1990-2022 Emissions have changed by -5.5% (-34.31 Gg CO2 / year). For 2022 the
changes per gas
are:

For 1990-2022 the changes per gas are:
There is no subsector information available in PRIMAP-hist.
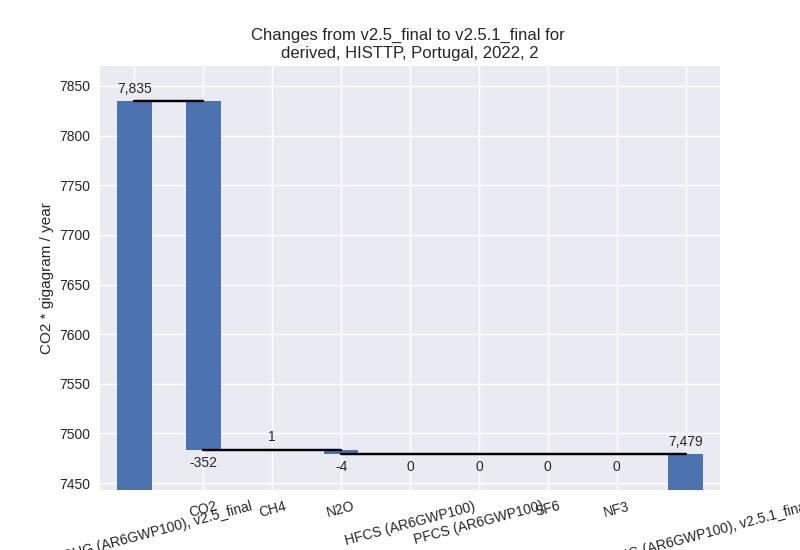
- 2: Total sectoral emissions in 2022 are 7888.02 Gg
CO2 / year which is 13.4% of M.0.EL emissions. 2022 Emissions have
changed by 3.2% (246.73 Gg CO2 /
year). 1990-2022 Emissions have changed by 0.1% (7.48 Gg CO2 / year). For 2022 the
changes per gas
are:
- M.AG: Total sectoral emissions in 2022 are 7335.92 Gg CO2 / year which is 12.5% of M.0.EL emissions. 2022 Emissions have changed by 0.9% (68.49 Gg CO2 / year). 1990-2022 Emissions have changed by 0.0% (2.08 Gg CO2 / year).
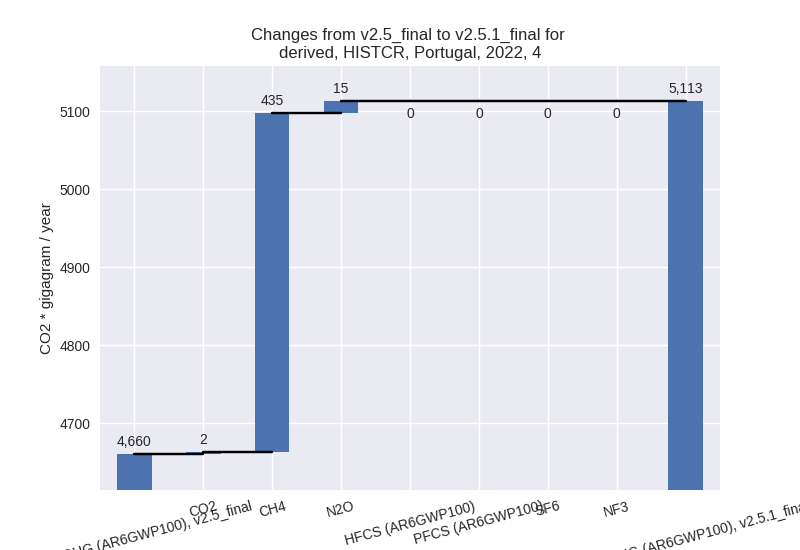
- 4: Total sectoral emissions in 2022 are 5112.55 Gg
CO2 / year which is 8.7% of M.0.EL emissions. 2022 Emissions have
changed by 9.7% (452.52 Gg CO2 /
year). 1990-2022 Emissions have changed by 0.2% (13.71 Gg CO2 / year). For 2022 the
changes per gas
are:
- 5: No data
third party scenario (HISTTP):
Most important changes per time frame
For 2022 the following sector-gas combinations have the highest absolute impact on national total KyotoGHG (AR6GWP100) emissions in 2022 (top 5):
- 1: 1.A, CO2 with 2126.40 Gg CO2 / year (5.9%)
- 2: 4, CH4 with 552.93 Gg CO2 / year (13.9%)
- 3: 2, CO2 with -351.75 Gg CO2 / year (-10.9%)
- 4: 1.B.2, CH4 with -300.13 Gg CO2 / year (-31.5%)
- 5: M.AG.ELV, CO2 with -243.25 Gg CO2 / year (-40.9%)
For 1990-2022 the following sector-gas combinations have the highest absolute impact on national total KyotoGHG (AR6GWP100) emissions in 1990-2022 (top 5):
- 1: 2, CO2 with -542.75 Gg CO2 / year (-11.3%)
- 2: 1.B.2, CH4 with -190.47 Gg CO2 / year (-45.6%)
- 3: 1.A, CO2 with 172.90 Gg CO2 / year (0.4%)
- 4: 4, CH4 with 16.76 Gg CO2 / year (0.3%)
- 5: 1.B.1, CO2 with -9.20 Gg CO2 / year (-4.8%)
Changes in the main sectors for aggregate KyotoGHG (AR6GWP100) are
- 1: Total sectoral emissions in 2022 are 39688.88 Gg
CO2 / year which is 66.3% of M.0.EL emissions. 2022 Emissions have
changed by 5.0% (1873.05 Gg CO2 /
year). 1990-2022 Emissions have changed by -0.1% (-30.45 Gg CO2 / year). For 2022 the
changes per gas
are:
The changes come from the following subsectors:- 1.A: Total sectoral emissions in 2022 are 38856.07
Gg CO2 / year which is 98.0% of category 1 emissions. 2022 Emissions
have changed by 5.9% (2175.11 Gg CO2
/ year). 1990-2022 Emissions have changed by 0.3% (169.28 Gg CO2 / year). For 2022 the
changes per gas
are:

There is no subsector information available in PRIMAP-hist. - 1.B.1: Total sectoral emissions in 2022 are 140.69
Gg CO2 / year which is 0.4% of category 1 emissions. 2022 Emissions have
changed by -0.3% (-0.42 Gg CO2 /
year). 1990-2022 Emissions have changed by -4.2% (-9.21 Gg CO2 / year). For 1990-2022
the changes per gas
are:
There is no subsector information available in PRIMAP-hist. - 1.B.2: Total sectoral emissions in 2022 are 655.20
Gg CO2 / year which is 1.7% of category 1 emissions. 2022 Emissions have
changed by -31.5% (-301.64 Gg CO2 /
year). 1990-2022 Emissions have changed by -45.3% (-190.52 Gg CO2 / year). For 2022
the changes per gas
are:

For 1990-2022 the changes per gas are:
There is no subsector information available in PRIMAP-hist.
- 1.A: Total sectoral emissions in 2022 are 38856.07
Gg CO2 / year which is 98.0% of category 1 emissions. 2022 Emissions
have changed by 5.9% (2175.11 Gg CO2
/ year). 1990-2022 Emissions have changed by 0.3% (169.28 Gg CO2 / year). For 2022 the
changes per gas
are:
- 2: Total sectoral emissions in 2022 are 7479.06 Gg
CO2 / year which is 12.5% of M.0.EL emissions. 2022 Emissions have
changed by -4.5% (-355.52 Gg CO2 /
year). 1990-2022 Emissions have changed by -7.9% (-541.92 Gg CO2 / year). For 2022
the changes per gas
are:
For 1990-2022 the changes per gas are:
- M.AG: Total sectoral emissions in 2022 are 7735.92
Gg CO2 / year which is 12.9% of M.0.EL emissions. 2022 Emissions have
changed by -5.9% (-484.61 Gg CO2 /
year). 1990-2022 Emissions have changed by -0.1% (-10.89 Gg CO2 / year). For 2022 the
changes per gas
are:

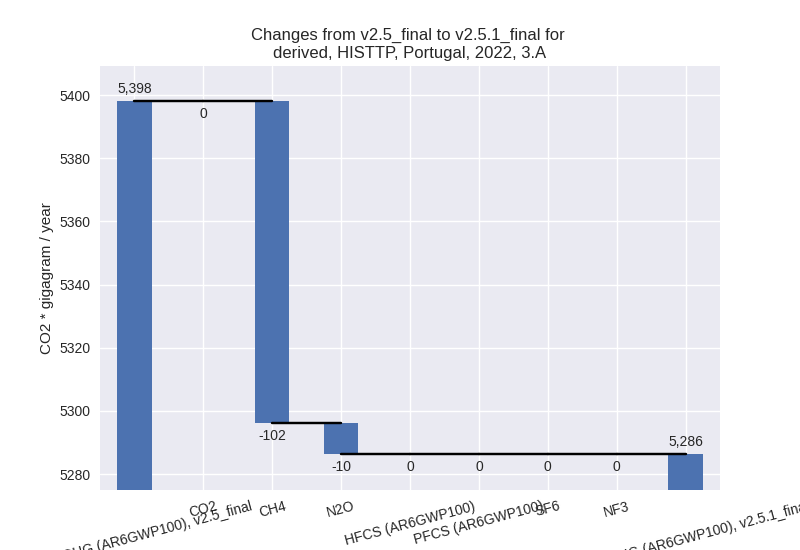
The changes come from the following subsectors:- 3.A: Total sectoral emissions in 2022 are 5286.27
Gg CO2 / year which is 68.3% of category M.AG emissions. 2022 Emissions
have changed by -2.1% (-111.77 Gg
CO2 / year). 1990-2022 Emissions have changed by -0.1% (-7.30 Gg CO2 / year). For 2022 the
changes per gas
are:
There is no subsector information available in PRIMAP-hist. - M.AG.ELV: Total sectoral emissions in 2022 are
2449.64 Gg CO2 / year which is 31.7% of category M.AG emissions. 2022
Emissions have changed by -13.2%
(-372.84 Gg CO2 / year). 1990-2022 Emissions have changed by -0.1% (-3.59 Gg CO2 / year). For 2022 the
changes per gas
are:

There is no subsector information available in PRIMAP-hist.
- 3.A: Total sectoral emissions in 2022 are 5286.27
Gg CO2 / year which is 68.3% of category M.AG emissions. 2022 Emissions
have changed by -2.1% (-111.77 Gg
CO2 / year). 1990-2022 Emissions have changed by -0.1% (-7.30 Gg CO2 / year). For 2022 the
changes per gas
are:
- 4: Total sectoral emissions in 2022 are 4772.92 Gg
CO2 / year which is 8.0% of M.0.EL emissions. 2022 Emissions have
changed by 13.3% (561.91 Gg CO2 /
year). 1990-2022 Emissions have changed by 0.3% (17.03 Gg CO2 / year). For 2022 the
changes per gas
are:

- 5: Total sectoral emissions in 2022 are 172.58 Gg
CO2 / year which is 0.3% of M.0.EL emissions. 2022 Emissions have
changed by 14.3% (21.55 Gg CO2 /
year). 1990-2022 Emissions have changed by 0.2% (0.65 Gg CO2 / year). For 2022 the
changes per gas
are: