Changes in PRIMAP-hist v2.5.1_final compared to v2.5_final for Romania
2024-02-29
Johannes Gütschow
Change analysis for Romania for PRIMAP-hist v2.5.1_final compared to v2.5_final
Overview over emissions by sector and gas
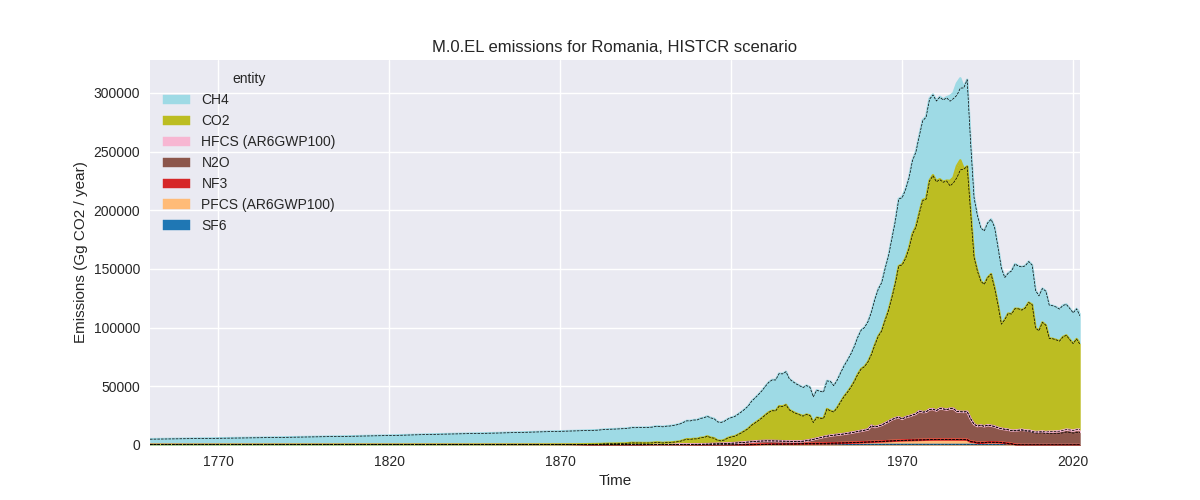
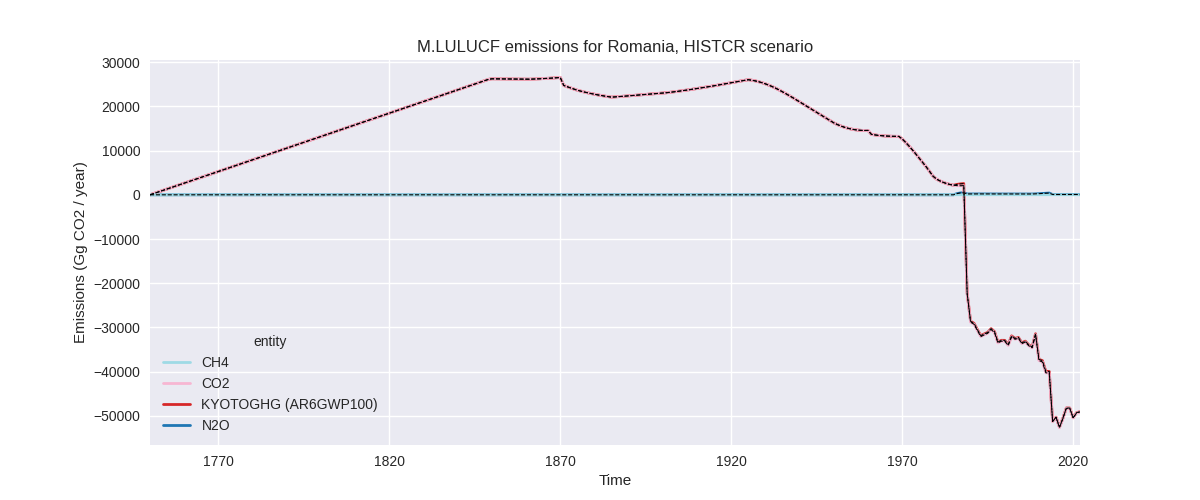
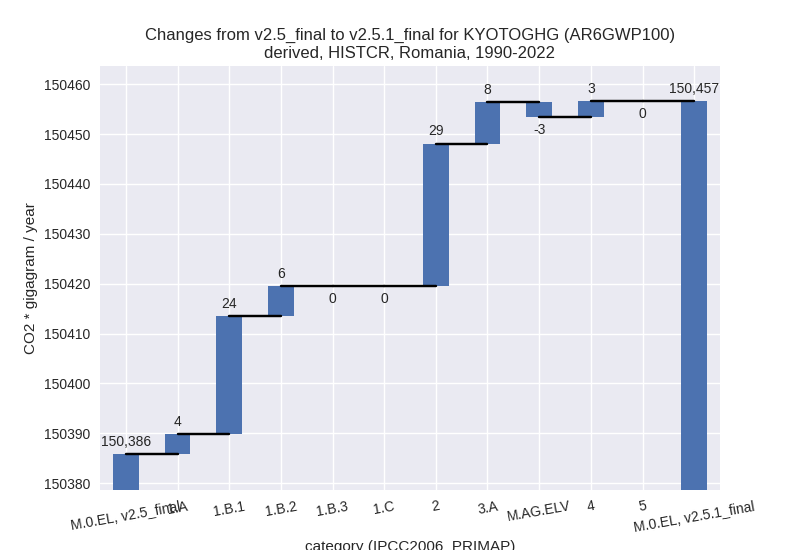
The following figures show the aggregate national total emissions excluding LULUCF AR6GWP100 for the country reported priority scenario. The dotted linesshow the v2.5_final data.

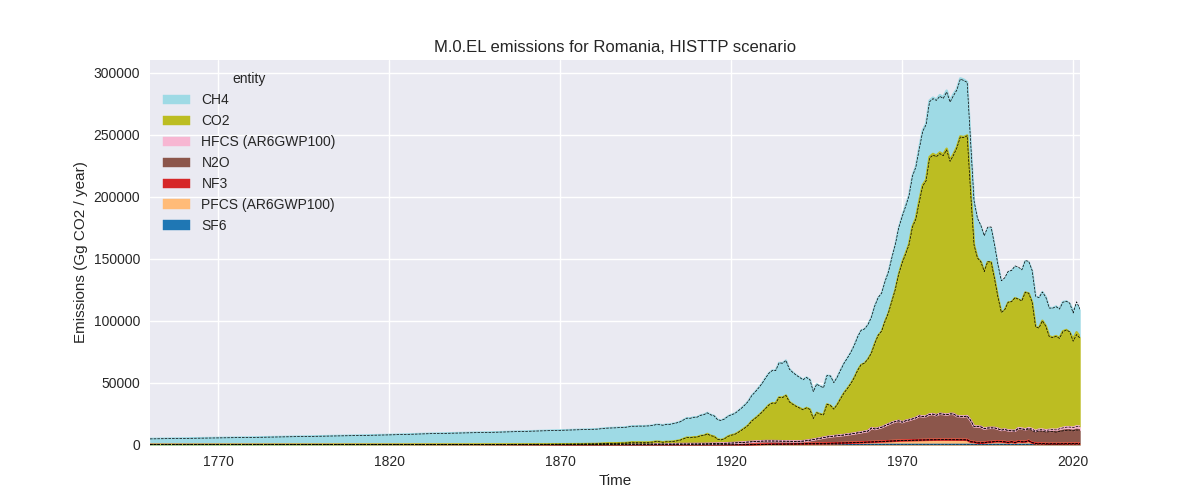
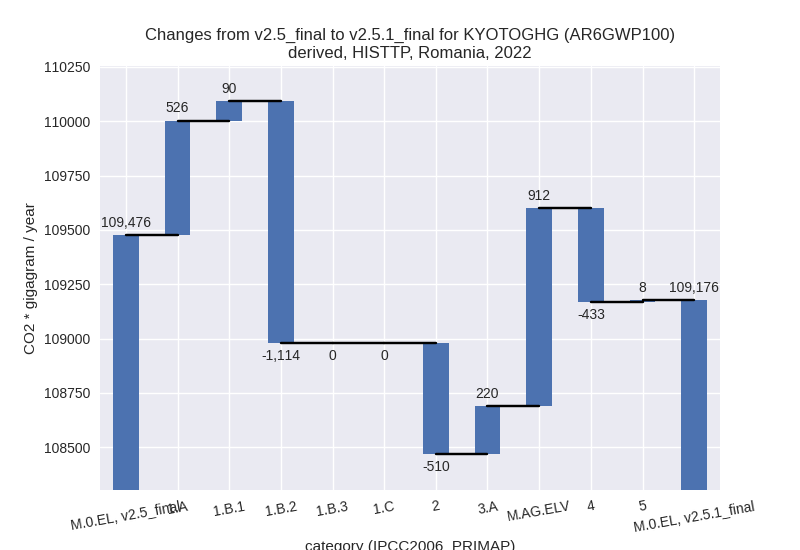
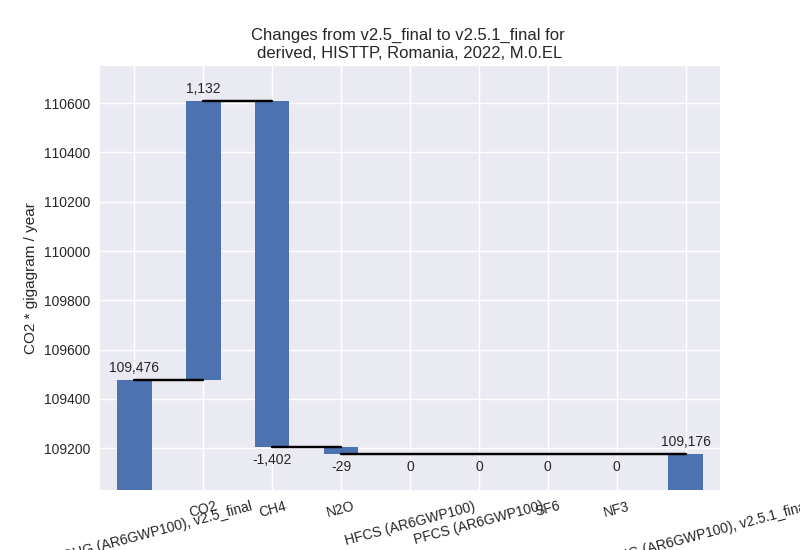
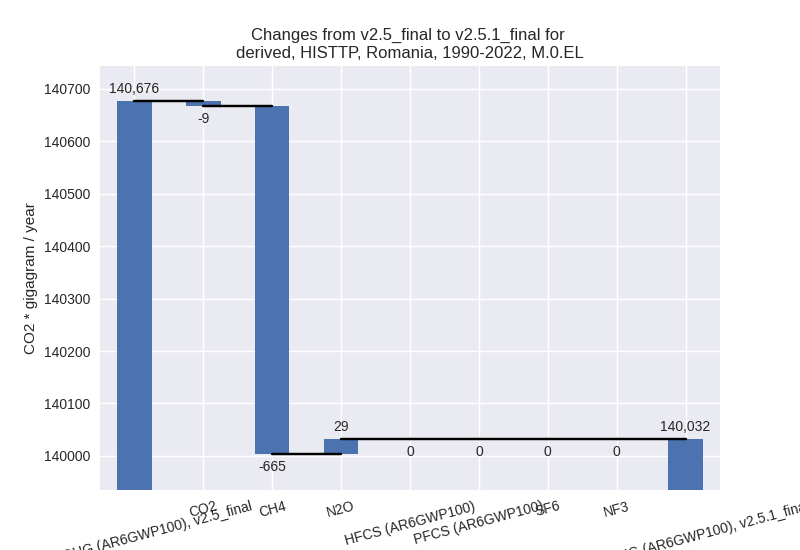
The following figures show the aggregate national total emissions excluding LULUCF AR6GWP100 for the third party priority scenario. The dotted linesshow the v2.5_final data.


Overview over changes
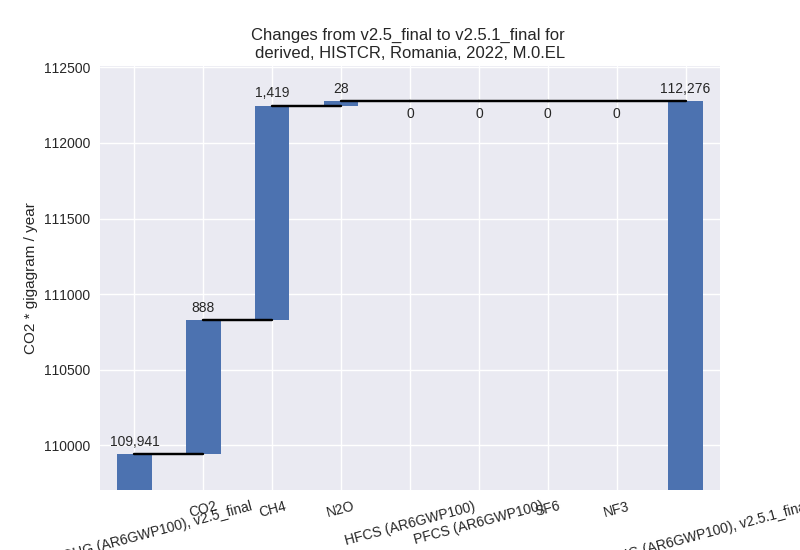
In the country reported priority scenario we have the following changes for aggregate Kyoto GHG and national total emissions excluding LULUCF (M.0.EL):
- Emissions in 2022 have changed by 2.1%% (2334.45 Gg CO2 / year)
- Emissions in 1990-2022 have changed by 0.0%% (70.74 Gg CO2 / year)
In the third party priority scenario we have the following changes for aggregate Kyoto GHG and national total emissions excluding LULUCF (M.0.EL):
- Emissions in 2022 have changed by -0.3%% (-299.51 Gg CO2 / year)
- Emissions in 1990-2022 have changed by -0.5%% (-644.14 Gg CO2 / year)
Most important changes per scenario and time frame
In the country reported priority scenario the following sector-gas combinations have the highest absolute impact on national total KyotoGHG (AR6GWP100) emissions in 2022 (top 5):
- 1: 2, CO2 with 860.88 Gg CO2 / year (9.4%)
- 2: 1.B.1, CH4 with 781.42 Gg CO2 / year (15.2%)
- 3: 3.A, CH4 with 274.00 Gg CO2 / year (3.1%)
- 4: 1.B.2, CH4 with 195.81 Gg CO2 / year (7.7%)
- 5: M.AG.ELV, N2O with -114.07 Gg CO2 / year (-1.3%)
In the country reported priority scenario the following sector-gas combinations have the highest absolute impact on national total KyotoGHG (AR6GWP100) emissions in 1990-2022 (top 5):
- 1: 2, CO2 with 26.09 Gg CO2 / year (0.2%)
- 2: 1.B.1, CH4 with 23.68 Gg CO2 / year (0.3%)
- 3: 3.A, CH4 with 8.30 Gg CO2 / year (0.1%)
- 4: 1.B.2, CH4 with 5.93 Gg CO2 / year (0.1%)
- 5: M.AG.ELV, N2O with -3.46 Gg CO2 / year (-0.0%)
In the third party priority scenario the following sector-gas combinations have the highest absolute impact on national total KyotoGHG (AR6GWP100) emissions in 2022 (top 5):
- 1: 1.B.2, CH4 with -1113.76 Gg CO2 / year (-21.9%)
- 2: M.AG.ELV, CO2 with 998.32 Gg CO2 / year (356.9%)
- 3: 1.A, CO2 with 512.71 Gg CO2 / year (0.8%)
- 4: 4, CH4 with -449.91 Gg CO2 / year (-5.4%)
- 5: 2, CO2 with -389.04 Gg CO2 / year (-4.9%)
In the third party priority scenario the following sector-gas combinations have the highest absolute impact on national total KyotoGHG (AR6GWP100) emissions in 1990-2022 (top 5):
- 1: M.AG.ELV, CO2 with 537.14 Gg CO2 / year (263.7%)
- 2: 1.B.2, CH4 with -470.13 Gg CO2 / year (-7.2%)
- 3: 2, CO2 with -365.14 Gg CO2 / year (-4.6%)
- 4: 1.B.1, CO2 with -202.36 Gg CO2 / year (-20.9%)
- 5: 1.B.1, CH4 with -176.51 Gg CO2 / year (-12.4%)
Notes on data changes
No country specific notes present for this changelog.
Changes by sector and gas
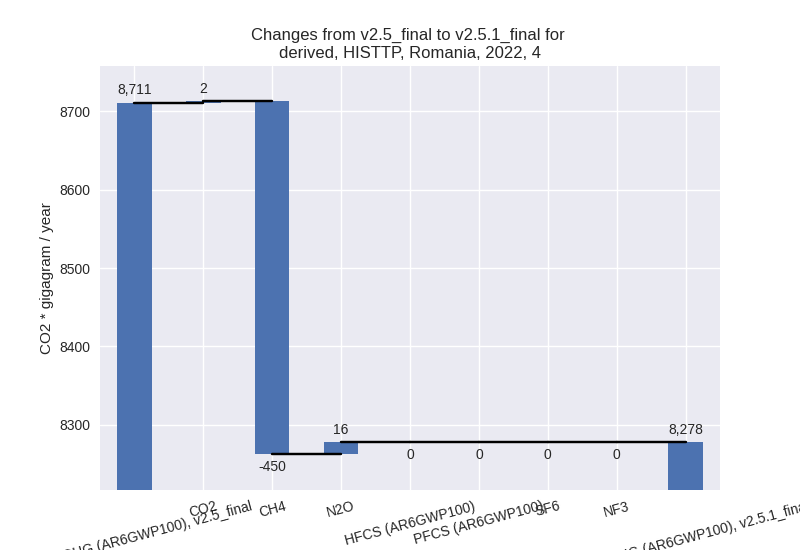
For each scenario and time frame the changes are displayed for all individual sectors and all individual gases. In the sector plot we use aggregate Kyoto GHGs in AR6GWP100. In the gas plot we usenational total emissions without LULUCF. ## country reported scenario
2022

1990-2022

third party scenario
2022
1990-2022

Detailed changes for the scenarios:
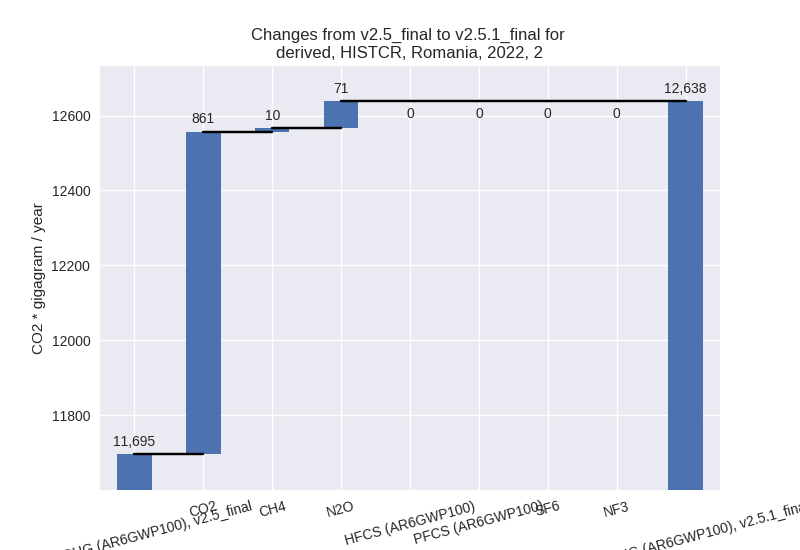
country reported scenario (HISTCR):
Most important changes per time frame
For 2022 the following sector-gas combinations have the highest absolute impact on national total KyotoGHG (AR6GWP100) emissions in 2022 (top 5):
- 1: 2, CO2 with 860.88 Gg CO2 / year (9.4%)
- 2: 1.B.1, CH4 with 781.42 Gg CO2 / year (15.2%)
- 3: 3.A, CH4 with 274.00 Gg CO2 / year (3.1%)
- 4: 1.B.2, CH4 with 195.81 Gg CO2 / year (7.7%)
- 5: M.AG.ELV, N2O with -114.07 Gg CO2 / year (-1.3%)
For 1990-2022 the following sector-gas combinations have the highest absolute impact on national total KyotoGHG (AR6GWP100) emissions in 1990-2022 (top 5):
- 1: 2, CO2 with 26.09 Gg CO2 / year (0.2%)
- 2: 1.B.1, CH4 with 23.68 Gg CO2 / year (0.3%)
- 3: 3.A, CH4 with 8.30 Gg CO2 / year (0.1%)
- 4: 1.B.2, CH4 with 5.93 Gg CO2 / year (0.1%)
- 5: M.AG.ELV, N2O with -3.46 Gg CO2 / year (-0.0%)
Changes in the main sectors for aggregate KyotoGHG (AR6GWP100) are
- 1: Total sectoral emissions in 2022 are 73956.46 Gg CO2 / year which is 65.9% of M.0.EL emissions. 2022 Emissions have changed by 1.5% (1110.16 Gg CO2 / year). 1990-2022 Emissions have changed by 0.0% (33.64 Gg CO2 / year).
- 2: Total sectoral emissions in 2022 are 12637.96 Gg
CO2 / year which is 11.3% of M.0.EL emissions. 2022 Emissions have
changed by 8.1% (942.52 Gg CO2 /
year). 1990-2022 Emissions have changed by 0.2% (28.56 Gg CO2 / year). For 2022 the
changes per gas
are:
- M.AG: Total sectoral emissions in 2022 are 19058.23 Gg CO2 / year which is 17.0% of M.0.EL emissions. 2022 Emissions have changed by 0.9% (178.64 Gg CO2 / year). 1990-2022 Emissions have changed by 0.0% (5.41 Gg CO2 / year).
- 4: Total sectoral emissions in 2022 are 6623.13 Gg CO2 / year which is 5.9% of M.0.EL emissions. 2022 Emissions have changed by 1.6% (103.13 Gg CO2 / year). 1990-2022 Emissions have changed by 0.1% (3.13 Gg CO2 / year).
- 5: No data
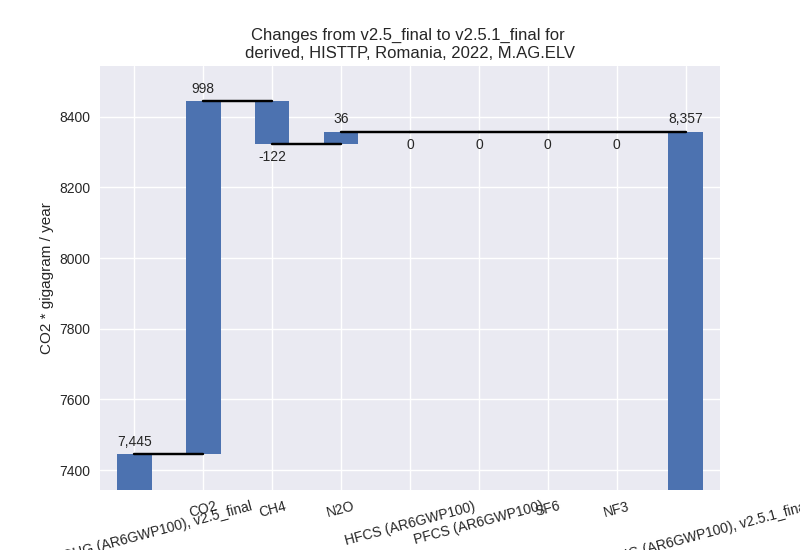
third party scenario (HISTTP):
Most important changes per time frame
For 2022 the following sector-gas combinations have the highest absolute impact on national total KyotoGHG (AR6GWP100) emissions in 2022 (top 5):
- 1: 1.B.2, CH4 with -1113.76 Gg CO2 / year (-21.9%)
- 2: M.AG.ELV, CO2 with 998.32 Gg CO2 / year (356.9%)
- 3: 1.A, CO2 with 512.71 Gg CO2 / year (0.8%)
- 4: 4, CH4 with -449.91 Gg CO2 / year (-5.4%)
- 5: 2, CO2 with -389.04 Gg CO2 / year (-4.9%)
For 1990-2022 the following sector-gas combinations have the highest absolute impact on national total KyotoGHG (AR6GWP100) emissions in 1990-2022 (top 5):
- 1: M.AG.ELV, CO2 with 537.14 Gg CO2 / year (263.7%)
- 2: 1.B.2, CH4 with -470.13 Gg CO2 / year (-7.2%)
- 3: 2, CO2 with -365.14 Gg CO2 / year (-4.6%)
- 4: 1.B.1, CO2 with -202.36 Gg CO2 / year (-20.9%)
- 5: 1.B.1, CH4 with -176.51 Gg CO2 / year (-12.4%)
Changes in the main sectors for aggregate KyotoGHG (AR6GWP100) are
- 1: Total sectoral emissions in 2022 are 69586.36 Gg CO2 / year which is 63.7% of M.0.EL emissions. 2022 Emissions have changed by -0.7% (-497.73 Gg CO2 / year). 1990-2022 Emissions have changed by -0.8% (-815.58 Gg CO2 / year).
- 2: Total sectoral emissions in 2022 are 13906.32 Gg
CO2 / year which is 12.7% of M.0.EL emissions. 2022 Emissions have
changed by -3.5% (-509.85 Gg CO2 /
year). 1990-2022 Emissions have changed by -2.8% (-372.59 Gg CO2 / year). For 2022
the changes per gas
are:

For 1990-2022 the changes per gas are: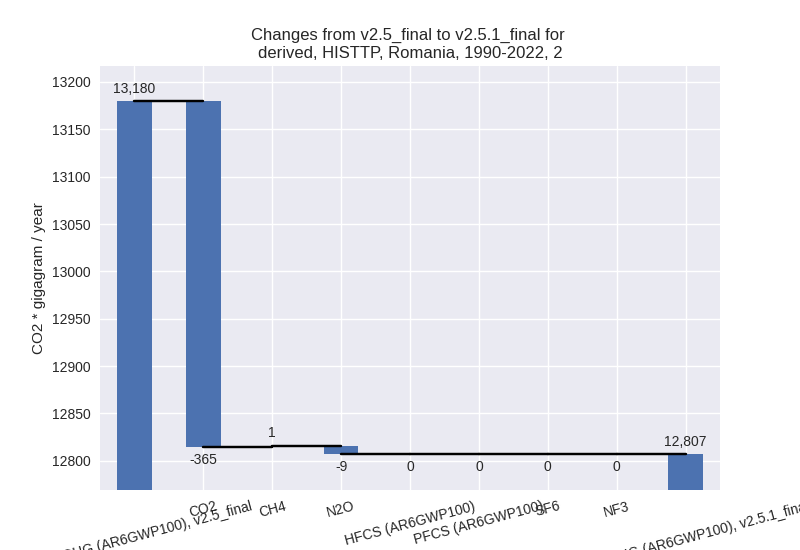
- M.AG: Total sectoral emissions in 2022 are 17137.29
Gg CO2 / year which is 15.7% of M.0.EL emissions. 2022 Emissions have
changed by 7.1% (1132.23 Gg CO2 /
year). 1990-2022 Emissions have changed by 3.0% (556.88 Gg CO2 / year). For 2022 the
changes per gas
are:

For 1990-2022 the changes per gas are: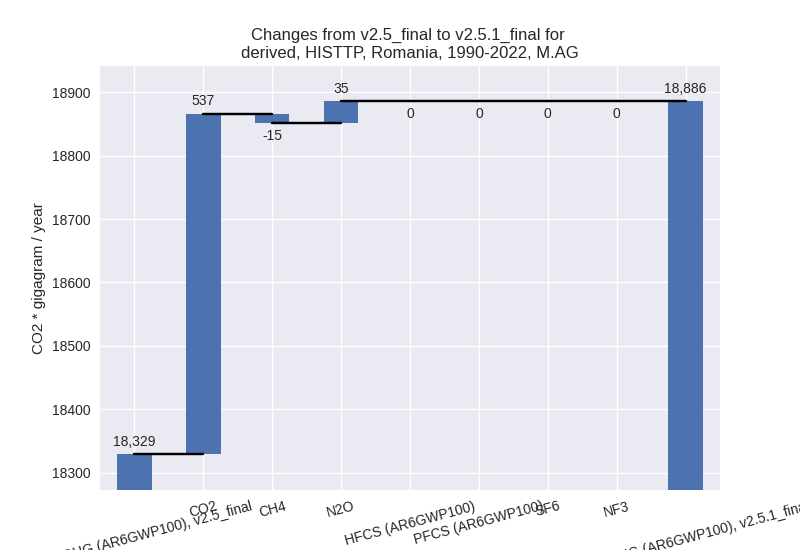
The changes come from the following subsectors:- 3.A: Total sectoral emissions in 2022 are 8780.30
Gg CO2 / year which is 51.2% of category M.AG emissions. 2022 Emissions
have changed by 2.6% (220.40 Gg CO2
/ year). 1990-2022 Emissions have changed by -0.1% (-6.85 Gg CO2 / year). For 2022 the
changes per gas
are:

There is no subsector information available in PRIMAP-hist. - M.AG.ELV: Total sectoral emissions in 2022 are
8356.99 Gg CO2 / year which is 48.8% of category M.AG emissions. 2022
Emissions have changed by 12.2%
(911.83 Gg CO2 / year). 1990-2022 Emissions have changed by 8.8% (563.73 Gg CO2 / year). For 2022 the
changes per gas
are:
For 1990-2022 the changes per gas are: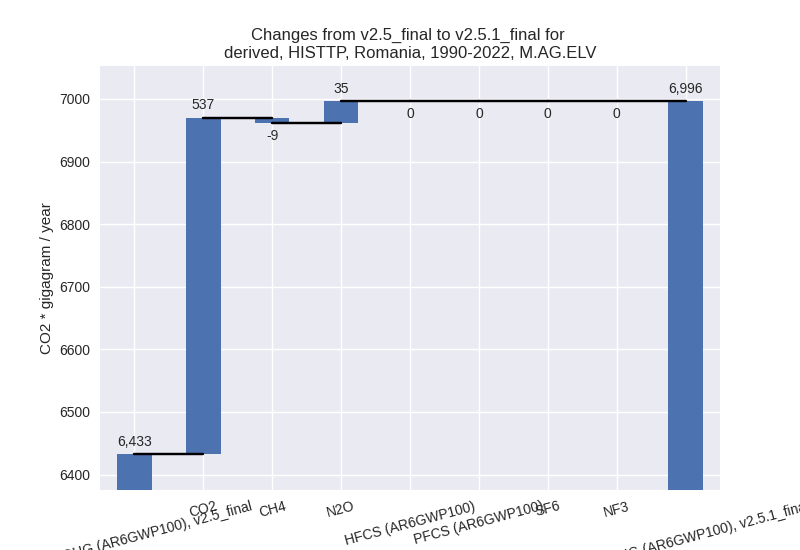
There is no subsector information available in PRIMAP-hist.
- 3.A: Total sectoral emissions in 2022 are 8780.30
Gg CO2 / year which is 51.2% of category M.AG emissions. 2022 Emissions
have changed by 2.6% (220.40 Gg CO2
/ year). 1990-2022 Emissions have changed by -0.1% (-6.85 Gg CO2 / year). For 2022 the
changes per gas
are:
- 4: Total sectoral emissions in 2022 are 8278.22 Gg
CO2 / year which is 7.6% of M.0.EL emissions. 2022 Emissions have
changed by -5.0% (-432.65 Gg CO2 /
year). 1990-2022 Emissions have changed by -0.2% (-13.11 Gg CO2 / year). For 2022 the
changes per gas
are:
- 5: Total sectoral emissions in 2022 are 267.82 Gg
CO2 / year which is 0.2% of M.0.EL emissions. 2022 Emissions have
changed by 3.3% (8.49 Gg CO2 /
year). 1990-2022 Emissions have changed by 0.1% (0.26 Gg CO2 / year). For 2022 the
changes per gas
are:
