Changes in PRIMAP-hist v2.5.1_final compared to v2.5_final for Russian Federation
2024-02-29
Johannes Gütschow
Change analysis for Russian Federation for PRIMAP-hist v2.5.1_final compared to v2.5_final
Overview over emissions by sector and gas
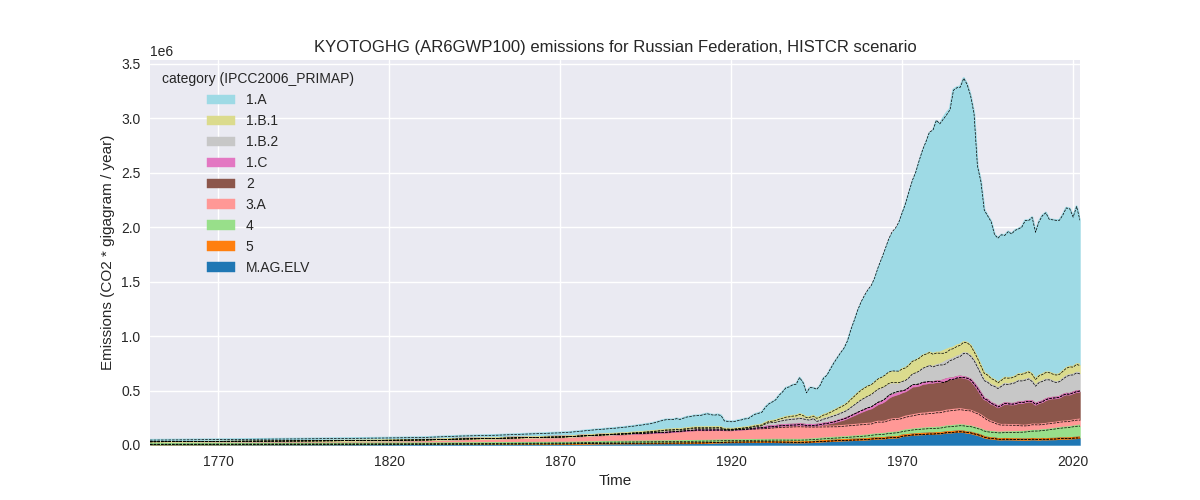
The following figures show the aggregate national total emissions excluding LULUCF AR6GWP100 for the country reported priority scenario. The dotted linesshow the v2.5_final data.
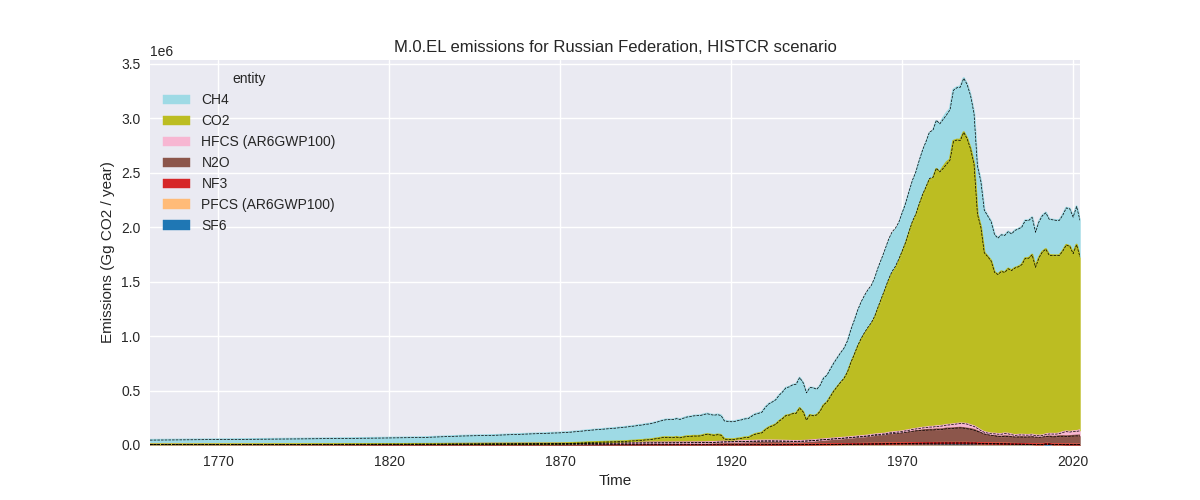

The following figures show the aggregate national total emissions excluding LULUCF AR6GWP100 for the third party priority scenario. The dotted linesshow the v2.5_final data.


Overview over changes
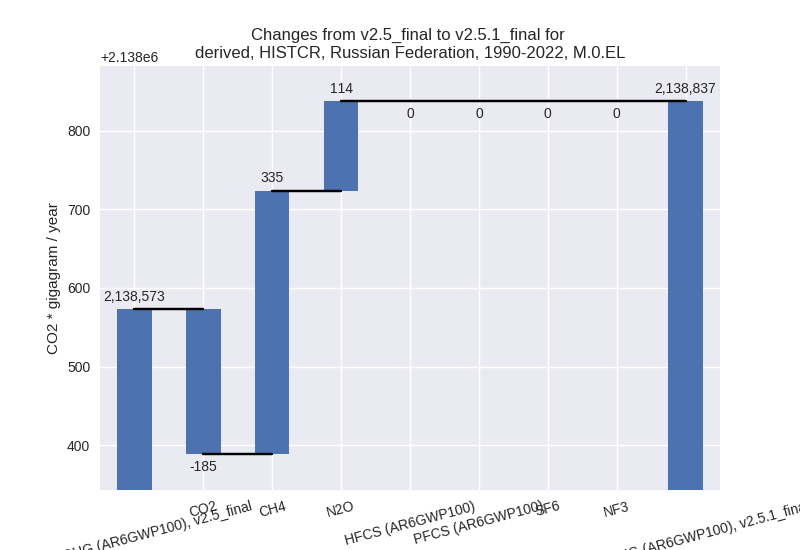
In the country reported priority scenario we have the following changes for aggregate Kyoto GHG and national total emissions excluding LULUCF (M.0.EL):
- Emissions in 2022 have changed by 0.4%% (8716.30 Gg CO2 / year)
- Emissions in 1990-2022 have changed by 0.0%% (264.13 Gg CO2 / year)
In the third party priority scenario we have the following changes for aggregate Kyoto GHG and national total emissions excluding LULUCF (M.0.EL):
- Emissions in 2022 have changed by 0.3%% (7493.80 Gg CO2 / year)
- Emissions in 1990-2022 have changed by -0.4%% (-9313.25 Gg CO2 / year)
Most important changes per scenario and time frame
In the country reported priority scenario the following sector-gas combinations have the highest absolute impact on national total KyotoGHG (AR6GWP100) emissions in 2022 (top 5):
- 1: 1.B.2, CH4 with 10648.38 Gg CO2 / year (11.0%)
- 2: 2, CO2 with -6053.87 Gg CO2 / year (-2.9%)
- 3: M.AG.ELV, N2O with 4715.22 Gg CO2 / year (7.6%)
- 4: 1.B.1, CH4 with 2167.77 Gg CO2 / year (2.8%)
- 5: 4, CH4 with -1211.17 Gg CO2 / year (-1.1%)
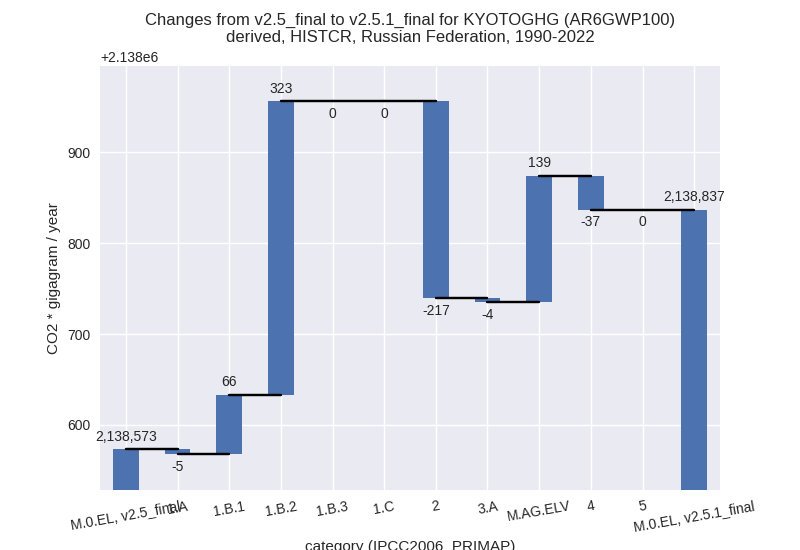
In the country reported priority scenario the following sector-gas combinations have the highest absolute impact on national total KyotoGHG (AR6GWP100) emissions in 1990-2022 (top 5):
- 1: 1.B.2, CH4 with 322.68 Gg CO2 / year (0.2%)
- 2: 2, CO2 with -183.45 Gg CO2 / year (-0.1%)
- 3: M.AG.ELV, N2O with 142.89 Gg CO2 / year (0.2%)
- 4: 1.B.1, CH4 with 65.69 Gg CO2 / year (0.1%)
- 5: 4, CH4 with -36.70 Gg CO2 / year (-0.1%)
In the third party priority scenario the following sector-gas combinations have the highest absolute impact on national total KyotoGHG (AR6GWP100) emissions in 2022 (top 5):
- 1: 1.A, CO2 with 21673.10 Gg CO2 / year (1.3%)
- 2: 1.B.2, CH4 with -15056.03 Gg CO2 / year (-7.0%)
- 3: M.AG.ELV, N2O with 6094.76 Gg CO2 / year (15.3%)
- 4: M.AG.ELV, CO2 with 5702.71 Gg CO2 / year (479.7%)
- 5: 2, N2O with -5083.54 Gg CO2 / year (-22.7%)
In the third party priority scenario the following sector-gas combinations have the highest absolute impact on national total KyotoGHG (AR6GWP100) emissions in 1990-2022 (top 5):
- 1: 1.B.2, CH4 with -6917.71 Gg CO2 / year (-3.9%)
- 2: 1.A, CO2 with -4633.74 Gg CO2 / year (-0.3%)
- 3: M.AG.ELV, N2O with 3456.92 Gg CO2 / year (9.1%)
- 4: 2, CO2 with -2844.14 Gg CO2 / year (-3.5%)
- 5: M.AG.ELV, CO2 with 1949.40 Gg CO2 / year (99.8%)
Notes on data changes
No country specific notes present for this changelog.
Changes by sector and gas
For each scenario and time frame the changes are displayed for all individual sectors and all individual gases. In the sector plot we use aggregate Kyoto GHGs in AR6GWP100. In the gas plot we usenational total emissions without LULUCF. ## country reported scenario
2022


1990-2022
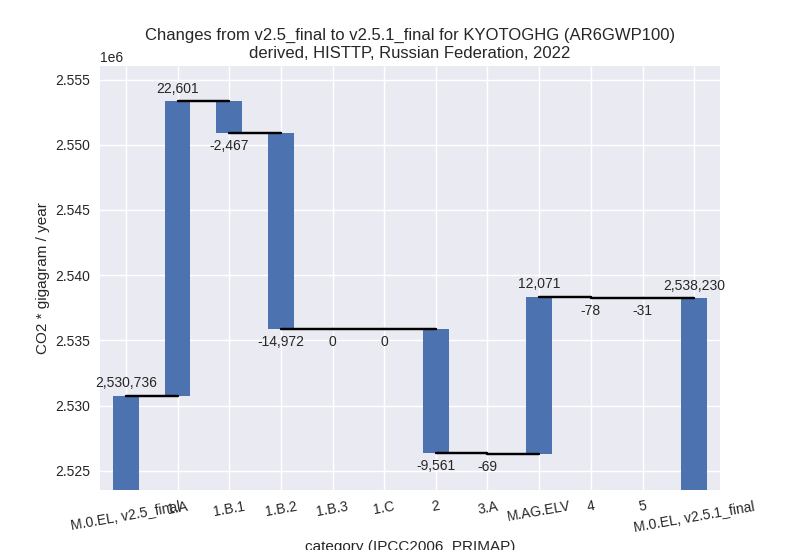
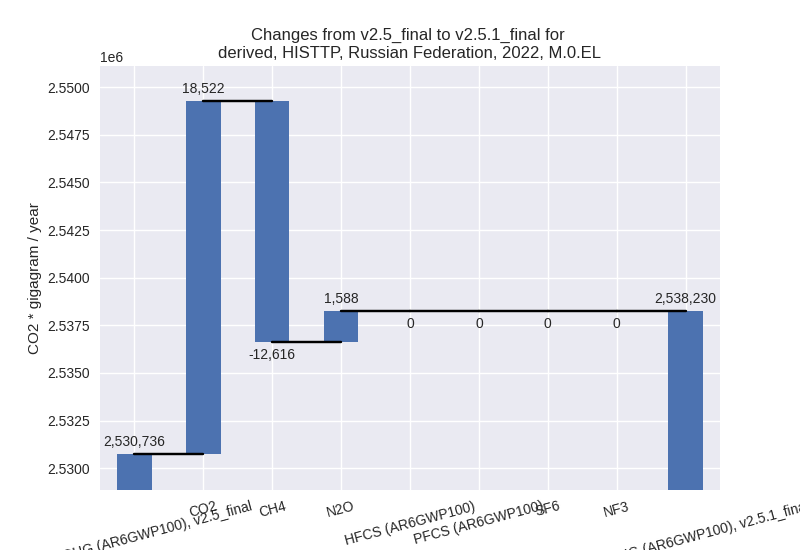
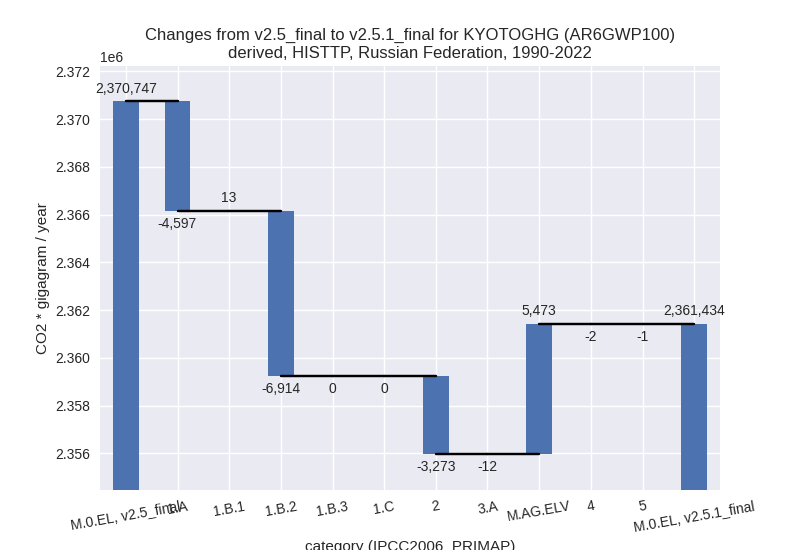
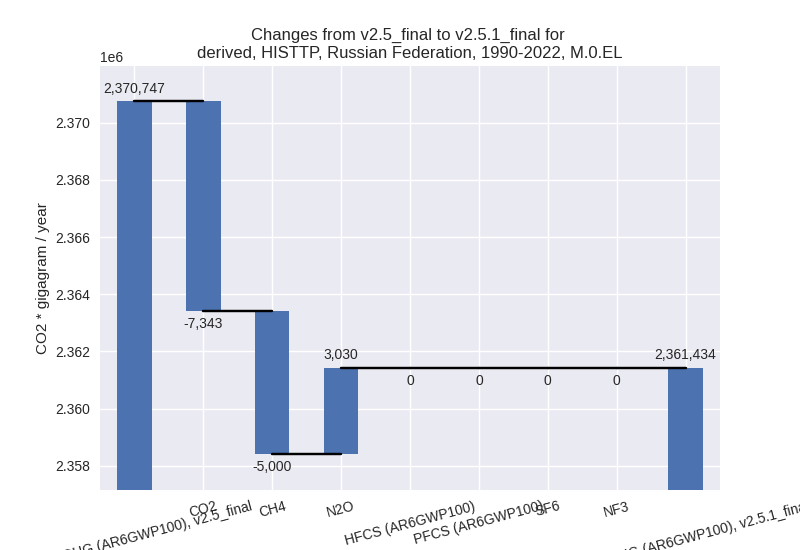
third party scenario
2022
1990-2022
Detailed changes for the scenarios:
country reported scenario (HISTCR):
Most important changes per time frame
For 2022 the following sector-gas combinations have the highest absolute impact on national total KyotoGHG (AR6GWP100) emissions in 2022 (top 5):
- 1: 1.B.2, CH4 with 10648.38 Gg CO2 / year (11.0%)
- 2: 2, CO2 with -6053.87 Gg CO2 / year (-2.9%)
- 3: M.AG.ELV, N2O with 4715.22 Gg CO2 / year (7.6%)
- 4: 1.B.1, CH4 with 2167.77 Gg CO2 / year (2.8%)
- 5: 4, CH4 with -1211.17 Gg CO2 / year (-1.1%)
For 1990-2022 the following sector-gas combinations have the highest absolute impact on national total KyotoGHG (AR6GWP100) emissions in 1990-2022 (top 5):
- 1: 1.B.2, CH4 with 322.68 Gg CO2 / year (0.2%)
- 2: 2, CO2 with -183.45 Gg CO2 / year (-0.1%)
- 3: M.AG.ELV, N2O with 142.89 Gg CO2 / year (0.2%)
- 4: 1.B.1, CH4 with 65.69 Gg CO2 / year (0.1%)
- 5: 4, CH4 with -36.70 Gg CO2 / year (-0.1%)
Changes in the main sectors for aggregate KyotoGHG (AR6GWP100) are
- 1: Total sectoral emissions in 2022 are 1579282.10 Gg CO2 / year which is 76.3% of M.0.EL emissions. 2022 Emissions have changed by 0.8% (12651.20 Gg CO2 / year). 1990-2022 Emissions have changed by 0.0% (383.37 Gg CO2 / year).
- 2: Total sectoral emissions in 2022 are 260053.20
Gg CO2 / year which is 12.6% of M.0.EL emissions. 2022 Emissions have
changed by -2.7% (-7157.02 Gg CO2 /
year). 1990-2022 Emissions have changed by -0.1% (-216.88 Gg CO2 / year). For 2022
the changes per gas
are:

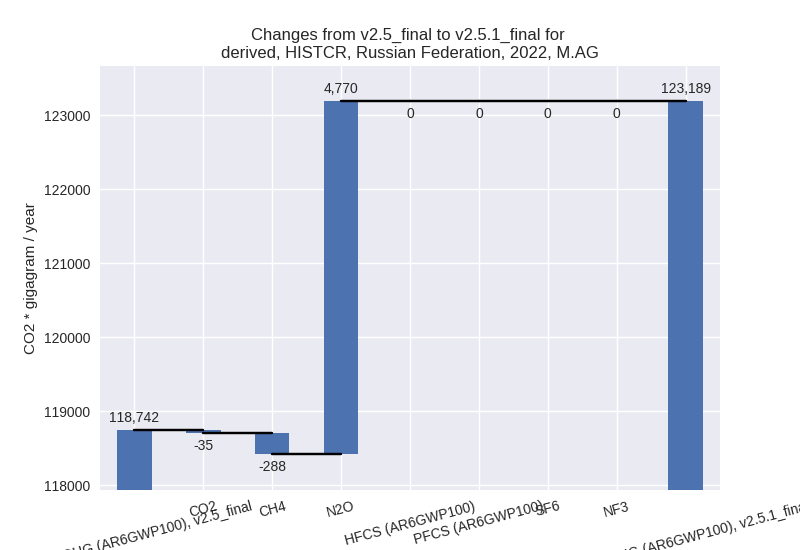
- M.AG: Total sectoral emissions in 2022 are
123188.97 Gg CO2 / year which is 5.9% of M.0.EL emissions. 2022
Emissions have changed by 3.7%
(4446.83 Gg CO2 / year). 1990-2022 Emissions have changed by 0.1% (134.75 Gg CO2 / year). For 2022 the
changes per gas
are:
The changes come from the following subsectors:- 3.A: Total sectoral emissions in 2022 are 55139.06 Gg CO2 / year which is 44.8% of category M.AG emissions. 2022 Emissions have changed by -0.3% (-147.64 Gg CO2 / year). 1990-2022 Emissions have changed by -0.0% (-4.47 Gg CO2 / year).
- M.AG.ELV: Total sectoral emissions in 2022 are
68049.91 Gg CO2 / year which is 55.2% of category M.AG emissions. 2022
Emissions have changed by 7.2%
(4594.47 Gg CO2 / year). 1990-2022 Emissions have changed by 0.2% (139.23 Gg CO2 / year). For 2022 the
changes per gas
are:
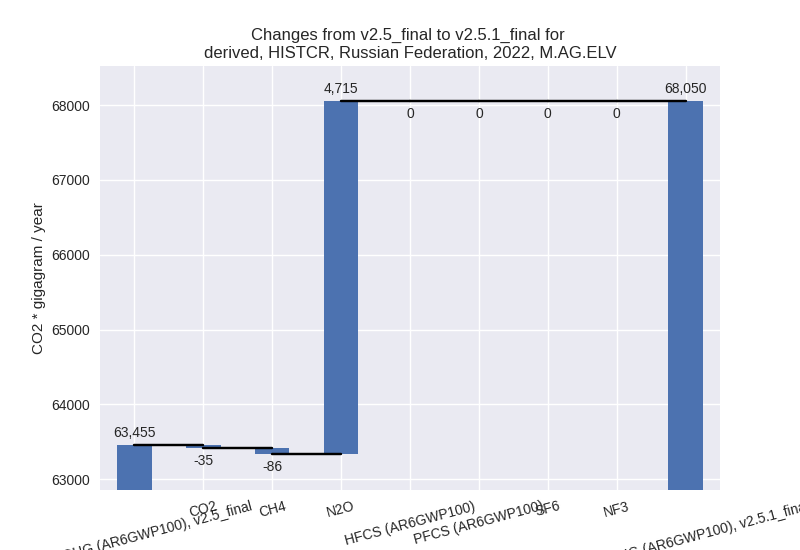
There is no subsector information available in PRIMAP-hist.
- 4: Total sectoral emissions in 2022 are 108564.61 Gg CO2 / year which is 5.2% of M.0.EL emissions. 2022 Emissions have changed by -1.1% (-1224.68 Gg CO2 / year). 1990-2022 Emissions have changed by -0.0% (-37.11 Gg CO2 / year).
- 5: No data
third party scenario (HISTTP):
Most important changes per time frame
For 2022 the following sector-gas combinations have the highest absolute impact on national total KyotoGHG (AR6GWP100) emissions in 2022 (top 5):
- 1: 1.A, CO2 with 21673.10 Gg CO2 / year (1.3%)
- 2: 1.B.2, CH4 with -15056.03 Gg CO2 / year (-7.0%)
- 3: M.AG.ELV, N2O with 6094.76 Gg CO2 / year (15.3%)
- 4: M.AG.ELV, CO2 with 5702.71 Gg CO2 / year (479.7%)
- 5: 2, N2O with -5083.54 Gg CO2 / year (-22.7%)
For 1990-2022 the following sector-gas combinations have the highest absolute impact on national total KyotoGHG (AR6GWP100) emissions in 1990-2022 (top 5):
- 1: 1.B.2, CH4 with -6917.71 Gg CO2 / year (-3.9%)
- 2: 1.A, CO2 with -4633.74 Gg CO2 / year (-0.3%)
- 3: M.AG.ELV, N2O with 3456.92 Gg CO2 / year (9.1%)
- 4: 2, CO2 with -2844.14 Gg CO2 / year (-3.5%)
- 5: M.AG.ELV, CO2 with 1949.40 Gg CO2 / year (99.8%)
Changes in the main sectors for aggregate KyotoGHG (AR6GWP100) are
- 1: Total sectoral emissions in 2022 are 2136637.90 Gg CO2 / year which is 84.2% of M.0.EL emissions. 2022 Emissions have changed by 0.2% (5161.50 Gg CO2 / year). 1990-2022 Emissions have changed by -0.6% (-11498.02 Gg CO2 / year).
- 2: Total sectoral emissions in 2022 are 168211.14
Gg CO2 / year which is 6.6% of M.0.EL emissions. 2022 Emissions have
changed by -5.4% (-9560.60 Gg CO2 /
year). 1990-2022 Emissions have changed by -2.2% (-3273.48 Gg CO2 / year). For 2022
the changes per gas
are:
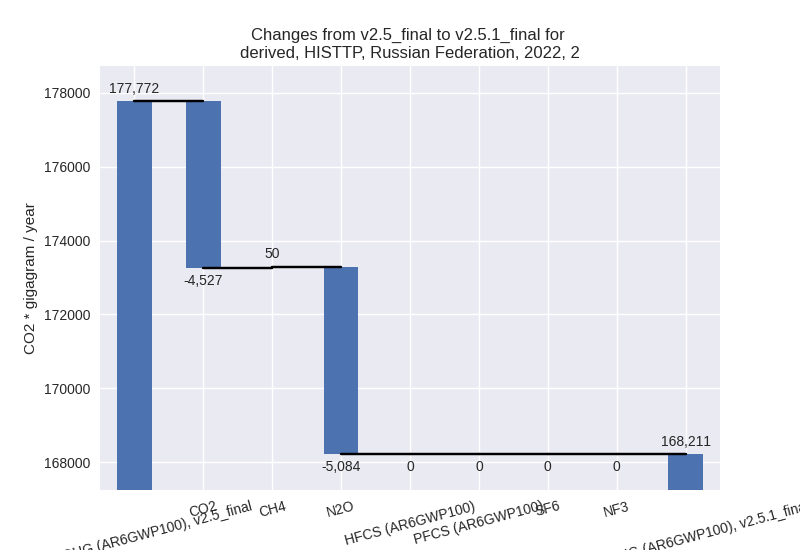
For 1990-2022 the changes per gas are:
- M.AG: Total sectoral emissions in 2022 are
112595.45 Gg CO2 / year which is 4.4% of M.0.EL emissions. 2022
Emissions have changed by 11.9%
(12001.86 Gg CO2 / year). 1990-2022 Emissions have changed by 4.3% (5461.54 Gg CO2 / year). For 2022 the
changes per gas
are:
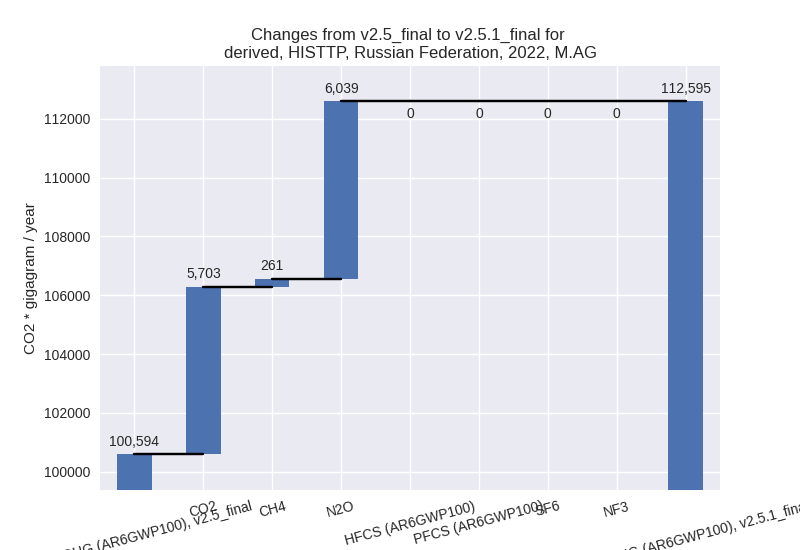
For 1990-2022 the changes per gas are:
The changes come from the following subsectors:- 3.A: Total sectoral emissions in 2022 are 54333.93 Gg CO2 / year which is 48.3% of category M.AG emissions. 2022 Emissions have changed by -0.1% (-69.22 Gg CO2 / year). 1990-2022 Emissions have changed by -0.0% (-11.50 Gg CO2 / year).
- M.AG.ELV: Total sectoral emissions in 2022 are
58261.51 Gg CO2 / year which is 51.7% of category M.AG emissions. 2022
Emissions have changed by 26.1%
(12071.08 Gg CO2 / year). 1990-2022 Emissions have changed by 12.3% (5473.04 Gg CO2 / year). For 2022
the changes per gas
are:

For 1990-2022 the changes per gas are: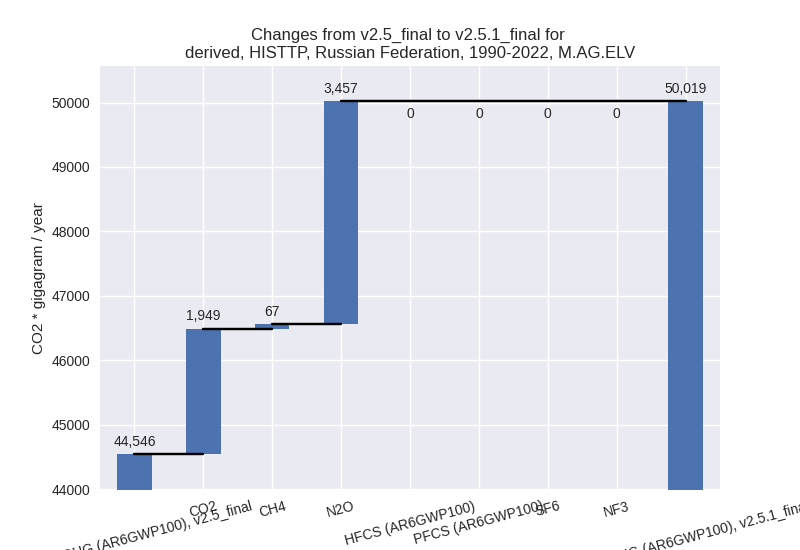
There is no subsector information available in PRIMAP-hist.
- 4: Total sectoral emissions in 2022 are 115696.51 Gg CO2 / year which is 4.6% of M.0.EL emissions. 2022 Emissions have changed by -0.1% (-78.20 Gg CO2 / year). 1990-2022 Emissions have changed by -0.0% (-2.37 Gg CO2 / year).
- 5: Total sectoral emissions in 2022 are 5088.69 Gg CO2 / year which is 0.2% of M.0.EL emissions. 2022 Emissions have changed by -0.6% (-30.79 Gg CO2 / year). 1990-2022 Emissions have changed by -0.0% (-0.93 Gg CO2 / year).