Changes in PRIMAP-hist v2.5.1_final compared to v2.5_final for Saint Helena, Ascension and Tristan da Cunha
2024-02-29
Johannes Gütschow
Change analysis for Saint Helena, Ascension and Tristan da Cunha for PRIMAP-hist v2.5.1_final compared to v2.5_final
Overview over emissions by sector and gas
The following figures show the aggregate national total emissions excluding LULUCF AR6GWP100 for the country reported priority scenario. The dotted linesshow the v2.5_final data.
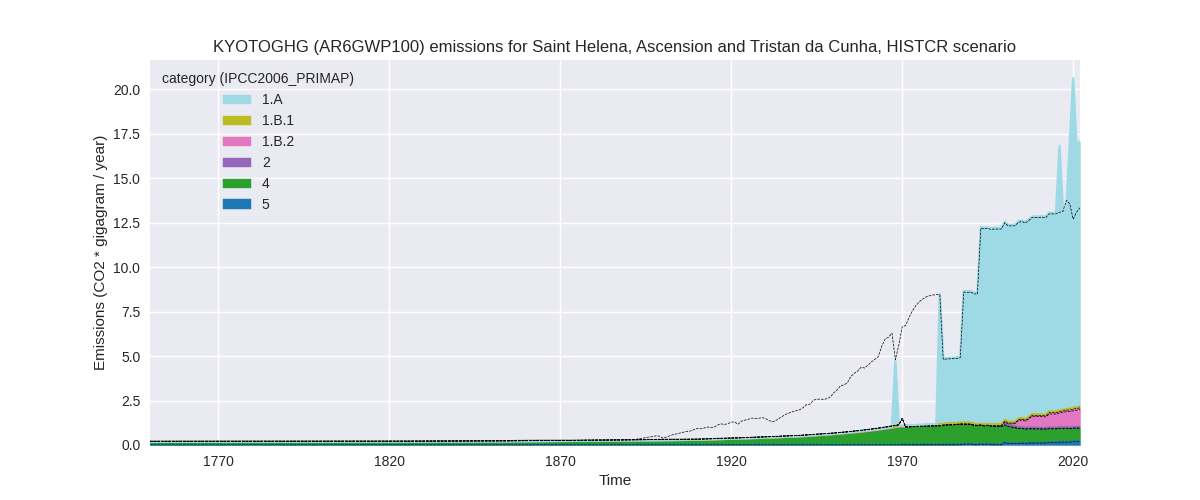


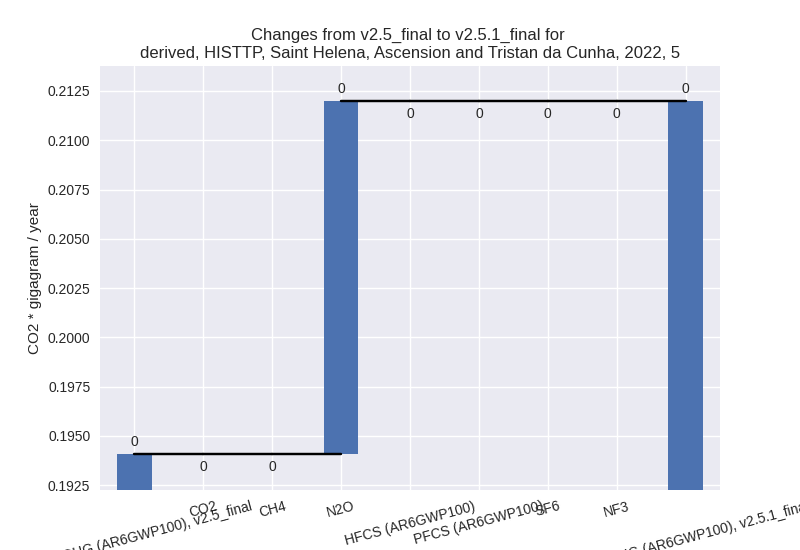
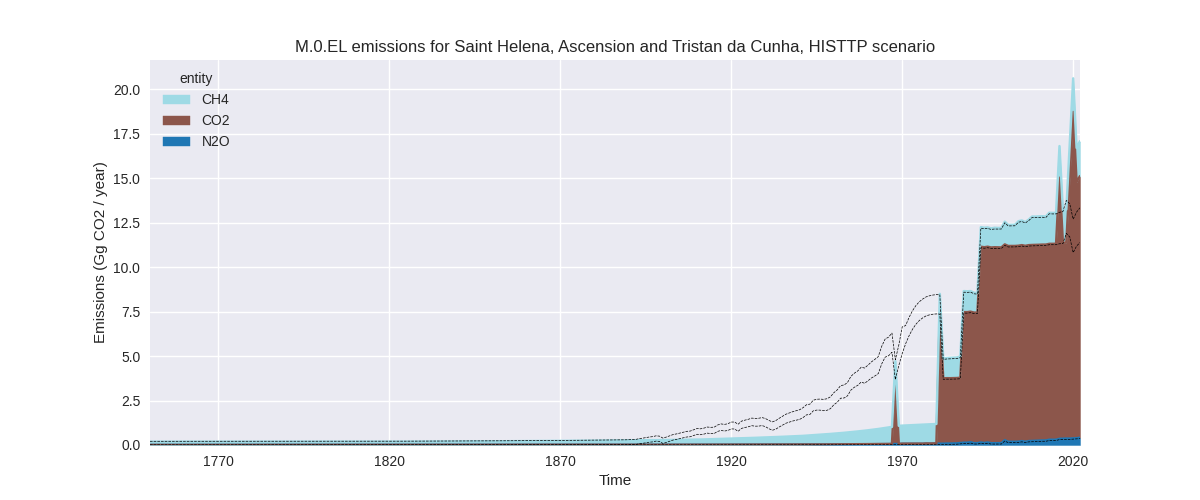
The following figures show the aggregate national total emissions excluding LULUCF AR6GWP100 for the third party priority scenario. The dotted linesshow the v2.5_final data.


Overview over changes
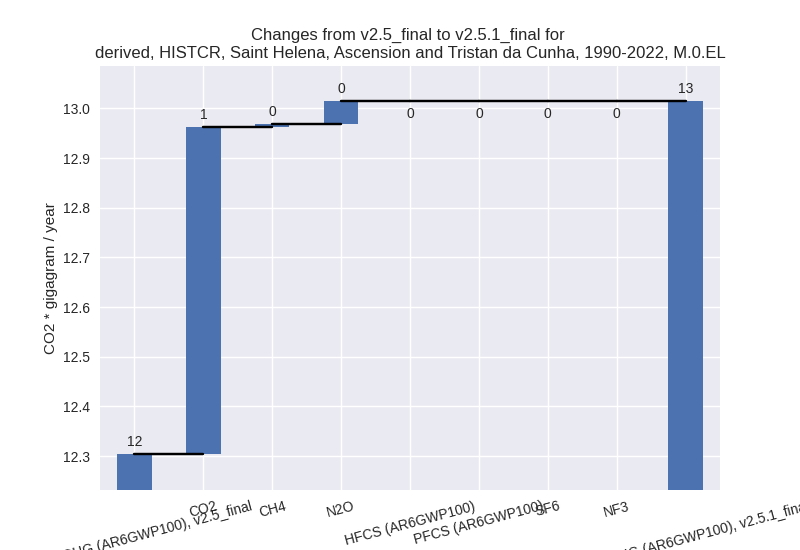
In the country reported priority scenario we have the following changes for aggregate Kyoto GHG and national total emissions excluding LULUCF (M.0.EL):
- Emissions in 2022 have changed by 28.1%% (3.75 Gg CO2 / year)
- Emissions in 1990-2022 have changed by 5.8%% (0.71 Gg CO2 / year)
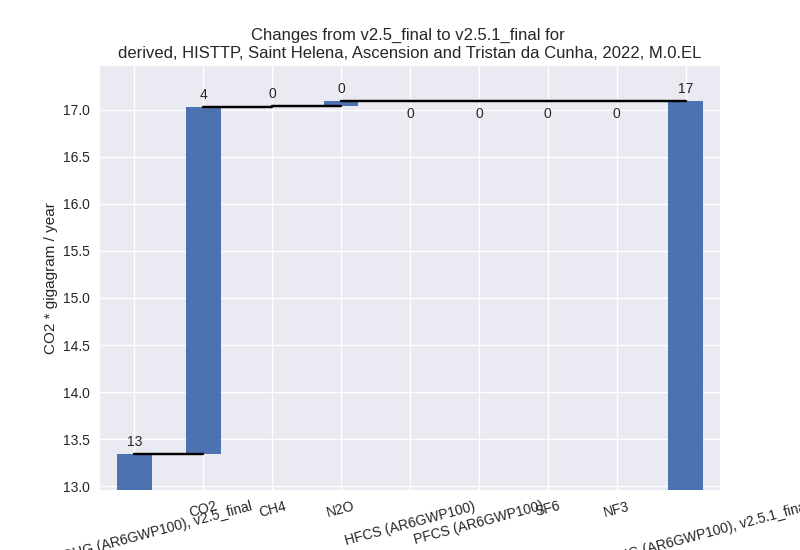
In the third party priority scenario we have the following changes for aggregate Kyoto GHG and national total emissions excluding LULUCF (M.0.EL):
- Emissions in 2022 have changed by 28.1%% (3.75 Gg CO2 / year)
- Emissions in 1990-2022 have changed by 5.8%% (0.71 Gg CO2 / year)
Most important changes per scenario and time frame
In the country reported priority scenario the following sector-gas combinations have the highest absolute impact on national total KyotoGHG (AR6GWP100) emissions in 2022 (top 5):
- 1: 1.A, CO2 with 3.68 Gg CO2 / year (33.4%)
- 2: 4, N2O with 0.04 Gg CO2 / year (inf%)
- 3: 5, N2O with 0.02 Gg CO2 / year (9.2%)
- 4: 1.B.1, CH4 with 0.01 Gg CO2 / year (10.7%)
- 5: 1.A, N2O with -0.01 Gg CO2 / year (-5.7%)
In the country reported priority scenario the following sector-gas combinations have the highest absolute impact on national total KyotoGHG (AR6GWP100) emissions in 1990-2022 (top 5):
- 1: 1.A, CO2 with 0.65 Gg CO2 / year (6.1%)
- 2: 4, N2O with 0.05 Gg CO2 / year (inf%)
- 3: 2, CO2 with 0.01 Gg CO2 / year (inf%)
- 4: 1.B.1, CH4 with 0.01 Gg CO2 / year (11.4%)
- 5: 1.A, N2O with -0.00 Gg CO2 / year (-0.5%)
In the third party priority scenario the following sector-gas combinations have the highest absolute impact on national total KyotoGHG (AR6GWP100) emissions in 2022 (top 5):
- 1: 1.A, CO2 with 3.68 Gg CO2 / year (33.4%)
- 2: 4, N2O with 0.04 Gg CO2 / year (inf%)
- 3: 5, N2O with 0.02 Gg CO2 / year (9.2%)
- 4: 1.B.1, CH4 with 0.01 Gg CO2 / year (10.7%)
- 5: 1.A, N2O with -0.01 Gg CO2 / year (-5.7%)
In the third party priority scenario the following sector-gas combinations have the highest absolute impact on national total KyotoGHG (AR6GWP100) emissions in 1990-2022 (top 5):
- 1: 1.A, CO2 with 0.65 Gg CO2 / year (6.1%)
- 2: 4, N2O with 0.05 Gg CO2 / year (inf%)
- 3: 2, CO2 with 0.01 Gg CO2 / year (inf%)
- 4: 1.B.1, CH4 with 0.01 Gg CO2 / year (11.4%)
- 5: 1.A, N2O with -0.00 Gg CO2 / year (-0.5%)
Notes on data changes
Here we list notes explaining important emissions changes for the country. ’' means that the following text only applies to the TP time series, while means that it only applies to the CR scenario. Otherwise the note applies to both scenarios.
General note: There are no country reported data for Saint Helena, Ascensions and Tristan da Cunha. Thus the CR and TP time-series are identical.
- 1.A, KYOTOGHG (AR6GWP100): The changes are due to higher CDIAC emissions for the last years which were not modeled by the EI data based extrapolation used in v2.5. Changes in cumulative emissions are due to the changes in the latest years. Additionally pre 1980 emissions have changed as many data points have beel replaced by 0 in CDIAC data.
- 1.B.1, KYOTOGHG (AR6GWP100): Higher emissions both in 2022 and cumulatively are due to higher emissions in eDGAR v8.0. compared to v7.0 used in PRIMAP-hist v2.5.
- 2, KYOTOGHG (AR6GWP100): EDGAR 8.0 includes CO2 emissions in 2.D for the first time which explains the high changes. Before emissions in category 2 were near zero.
Changes by sector and gas
For each scenario and time frame the changes are displayed for all individual sectors and all individual gases. In the sector plot we use aggregate Kyoto GHGs in AR6GWP100. In the gas plot we usenational total emissions without LULUCF. ## country reported scenario
2022


1990-2022
third party scenario
2022

1990-2022


Detailed changes for the scenarios:
country reported scenario (HISTCR):
Most important changes per time frame
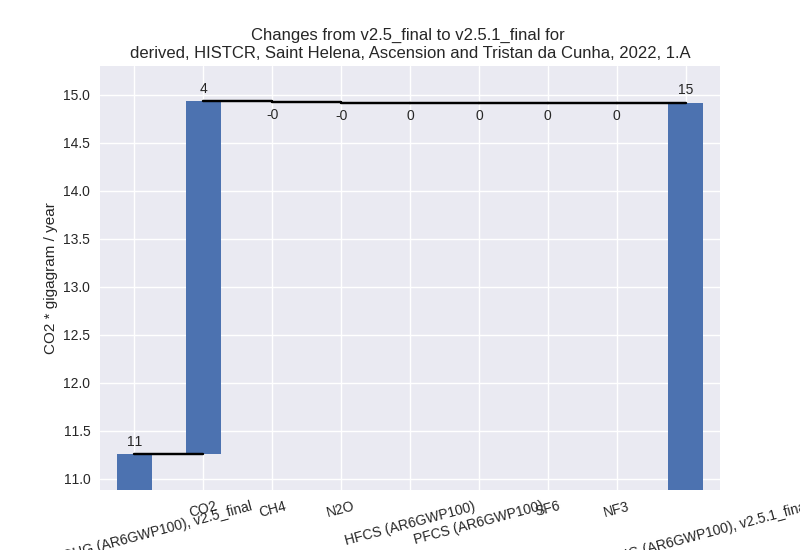
For 2022 the following sector-gas combinations have the highest absolute impact on national total KyotoGHG (AR6GWP100) emissions in 2022 (top 5):
- 1: 1.A, CO2 with 3.68 Gg CO2 / year (33.4%)
- 2: 4, N2O with 0.04 Gg CO2 / year (inf%)
- 3: 5, N2O with 0.02 Gg CO2 / year (9.2%)
- 4: 1.B.1, CH4 with 0.01 Gg CO2 / year (10.7%)
- 5: 1.A, N2O with -0.01 Gg CO2 / year (-5.7%)
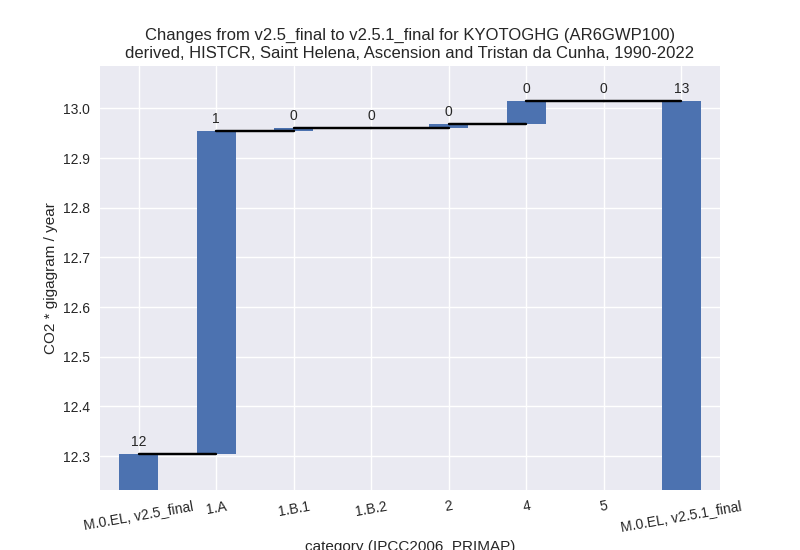
For 1990-2022 the following sector-gas combinations have the highest absolute impact on national total KyotoGHG (AR6GWP100) emissions in 1990-2022 (top 5):
- 1: 1.A, CO2 with 0.65 Gg CO2 / year (6.1%)
- 2: 4, N2O with 0.05 Gg CO2 / year (inf%)
- 3: 2, CO2 with 0.01 Gg CO2 / year (inf%)
- 4: 1.B.1, CH4 with 0.01 Gg CO2 / year (11.4%)
- 5: 1.A, N2O with -0.00 Gg CO2 / year (-0.5%)
Changes in the main sectors for aggregate KyotoGHG (AR6GWP100) are
1: Total sectoral emissions in 2022 are 16.07 Gg CO2 / year which is 94.0% of M.0.EL emissions. 2022 Emissions have changed by 29.6% (3.67 Gg CO2 / year). 1990-2022 Emissions have changed by 5.8% (0.66 Gg CO2 / year). For 2022 the changes per gas are:

For 1990-2022 the changes per gas are:
The changes come from the following subsectors:- 1.A: Total sectoral emissions in 2022 are 14.92 Gg
CO2 / year which is 92.8% of category 1 emissions. 2022 Emissions have
changed by 32.6% (3.66 Gg CO2 /
year). 1990-2022 Emissions have changed by 6.0% (0.65 Gg CO2 / year). For 2022 the
changes per gas
are:
For 1990-2022 the changes per gas are: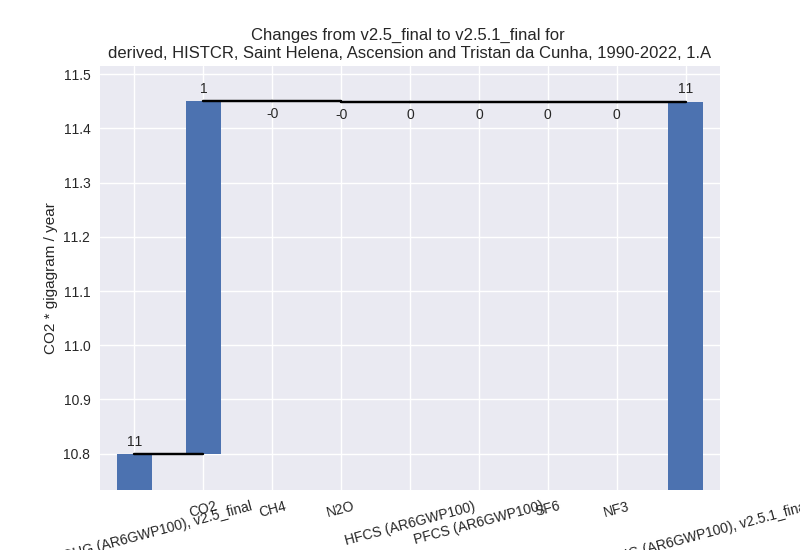
There is no subsector information available in PRIMAP-hist. - 1.B.1: Total sectoral emissions in 2022 are 0.11 Gg
CO2 / year which is 0.7% of category 1 emissions. 2022 Emissions have
changed by 10.4% (0.01 Gg CO2 /
year). 1990-2022 Emissions have changed by 11.1% (0.01 Gg CO2 / year). For 2022 the
changes per gas
are:

For 1990-2022 the changes per gas are:
There is no subsector information available in PRIMAP-hist. - 1.B.2: Total sectoral emissions in 2022 are 1.04 Gg CO2 / year which is 6.5% of category 1 emissions. 2022 Emissions have changed by -0.2% (-0.00 Gg CO2 / year). 1990-2022 Emissions have changed by 0.0% (0.00 Gg CO2 / year).
- 1.A: Total sectoral emissions in 2022 are 14.92 Gg
CO2 / year which is 92.8% of category 1 emissions. 2022 Emissions have
changed by 32.6% (3.66 Gg CO2 /
year). 1990-2022 Emissions have changed by 6.0% (0.65 Gg CO2 / year). For 2022 the
changes per gas
are:
2: Total sectoral emissions in 2022 are 0.01 Gg CO2 / year which is 0.0% of M.0.EL emissions. 2022 Emissions have changed by 48058.6% (0.01 Gg CO2 / year). 1990-2022 Emissions have changed by 52844.4% (0.01 Gg CO2 / year). For 2022 the changes per gas are:

For 1990-2022 the changes per gas are:
M.AG: No data
4: Total sectoral emissions in 2022 are 0.80 Gg CO2 / year which is 4.7% of M.0.EL emissions. 2022 Emissions have changed by 6.6% (0.05 Gg CO2 / year). 1990-2022 Emissions have changed by 5.2% (0.05 Gg CO2 / year). For 2022 the changes per gas are:

For 1990-2022 the changes per gas are:
5: Total sectoral emissions in 2022 are 0.21 Gg CO2 / year which is 1.2% of M.0.EL emissions. 2022 Emissions have changed by 9.2% (0.02 Gg CO2 / year). 1990-2022 Emissions have changed by 0.4% (0.00 Gg CO2 / year). For 2022 the changes per gas are:

third party scenario (HISTTP):
Most important changes per time frame
For 2022 the following sector-gas combinations have the highest absolute impact on national total KyotoGHG (AR6GWP100) emissions in 2022 (top 5):
- 1: 1.A, CO2 with 3.68 Gg CO2 / year (33.4%)
- 2: 4, N2O with 0.04 Gg CO2 / year (inf%)
- 3: 5, N2O with 0.02 Gg CO2 / year (9.2%)
- 4: 1.B.1, CH4 with 0.01 Gg CO2 / year (10.7%)
- 5: 1.A, N2O with -0.01 Gg CO2 / year (-5.7%)
For 1990-2022 the following sector-gas combinations have the highest absolute impact on national total KyotoGHG (AR6GWP100) emissions in 1990-2022 (top 5):
- 1: 1.A, CO2 with 0.65 Gg CO2 / year (6.1%)
- 2: 4, N2O with 0.05 Gg CO2 / year (inf%)
- 3: 2, CO2 with 0.01 Gg CO2 / year (inf%)
- 4: 1.B.1, CH4 with 0.01 Gg CO2 / year (11.4%)
- 5: 1.A, N2O with -0.00 Gg CO2 / year (-0.5%)
Changes in the main sectors for aggregate KyotoGHG (AR6GWP100) are
1: Total sectoral emissions in 2022 are 16.07 Gg CO2 / year which is 94.0% of M.0.EL emissions. 2022 Emissions have changed by 29.6% (3.67 Gg CO2 / year). 1990-2022 Emissions have changed by 5.8% (0.66 Gg CO2 / year). For 2022 the changes per gas are:

For 1990-2022 the changes per gas are:
The changes come from the following subsectors:- 1.A: Total sectoral emissions in 2022 are 14.92 Gg
CO2 / year which is 92.8% of category 1 emissions. 2022 Emissions have
changed by 32.6% (3.66 Gg CO2 /
year). 1990-2022 Emissions have changed by 6.0% (0.65 Gg CO2 / year). For 2022 the
changes per gas
are:

For 1990-2022 the changes per gas are:
There is no subsector information available in PRIMAP-hist. - 1.B.1: Total sectoral emissions in 2022 are 0.11 Gg
CO2 / year which is 0.7% of category 1 emissions. 2022 Emissions have
changed by 10.4% (0.01 Gg CO2 /
year). 1990-2022 Emissions have changed by 11.1% (0.01 Gg CO2 / year). For 2022 the
changes per gas
are:
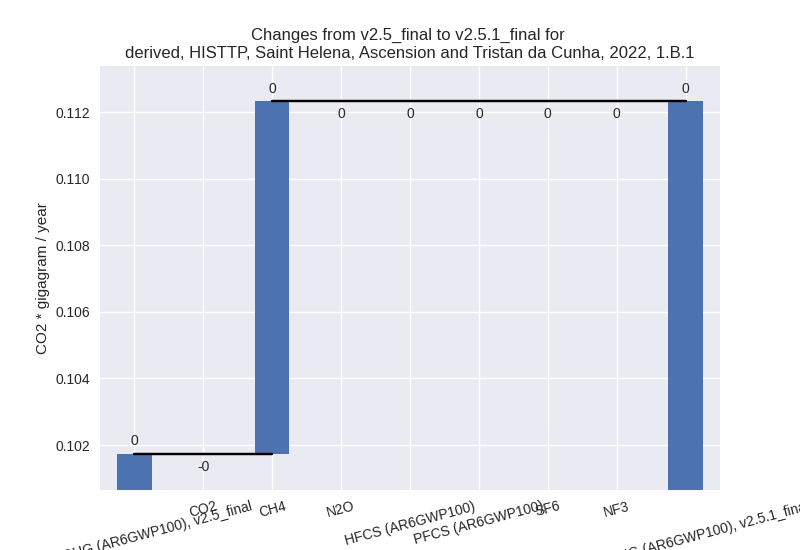
For 1990-2022 the changes per gas are:
There is no subsector information available in PRIMAP-hist. - 1.B.2: Total sectoral emissions in 2022 are 1.04 Gg CO2 / year which is 6.5% of category 1 emissions. 2022 Emissions have changed by -0.2% (-0.00 Gg CO2 / year). 1990-2022 Emissions have changed by 0.0% (0.00 Gg CO2 / year).
- 1.A: Total sectoral emissions in 2022 are 14.92 Gg
CO2 / year which is 92.8% of category 1 emissions. 2022 Emissions have
changed by 32.6% (3.66 Gg CO2 /
year). 1990-2022 Emissions have changed by 6.0% (0.65 Gg CO2 / year). For 2022 the
changes per gas
are:
2: Total sectoral emissions in 2022 are 0.01 Gg CO2 / year which is 0.0% of M.0.EL emissions. 2022 Emissions have changed by 48058.6% (0.01 Gg CO2 / year). 1990-2022 Emissions have changed by 52844.4% (0.01 Gg CO2 / year). For 2022 the changes per gas are:
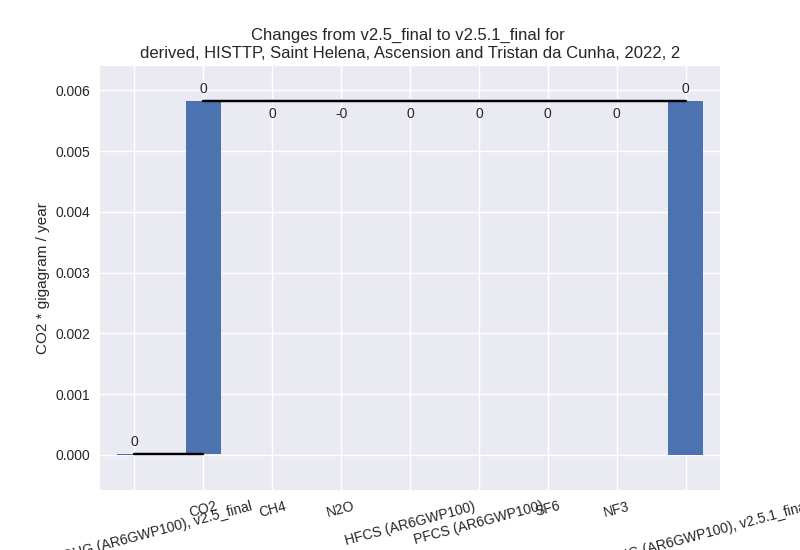
For 1990-2022 the changes per gas are: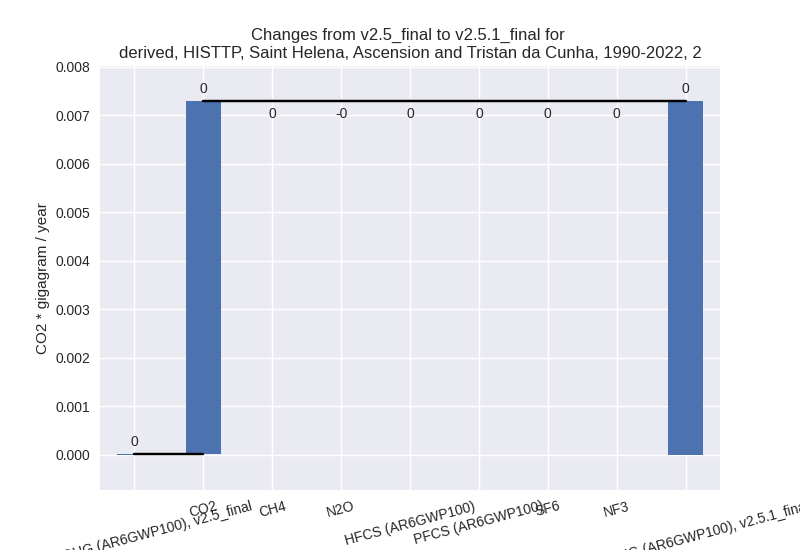
M.AG: No data
4: Total sectoral emissions in 2022 are 0.80 Gg CO2 / year which is 4.7% of M.0.EL emissions. 2022 Emissions have changed by 6.6% (0.05 Gg CO2 / year). 1990-2022 Emissions have changed by 5.2% (0.05 Gg CO2 / year). For 2022 the changes per gas are:
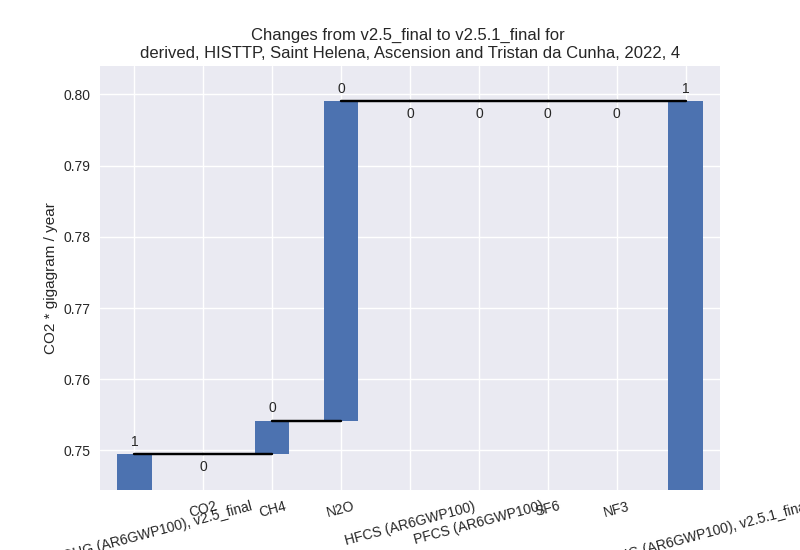
For 1990-2022 the changes per gas are: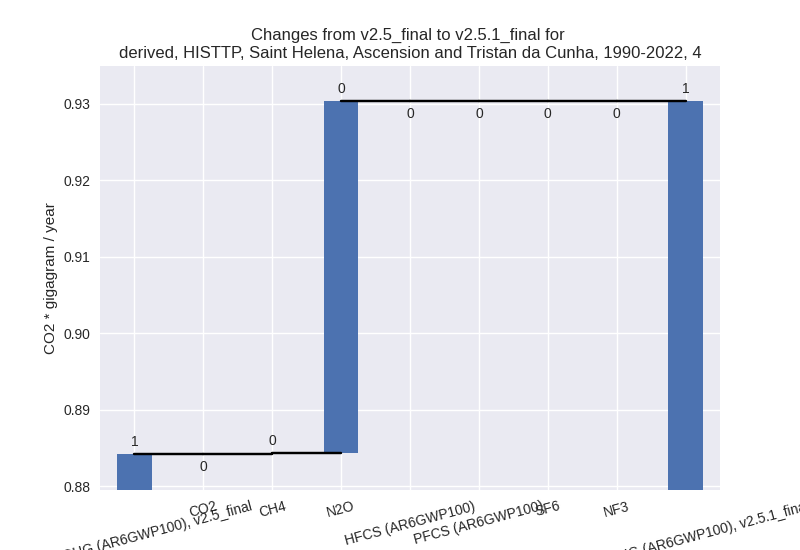
5: Total sectoral emissions in 2022 are 0.21 Gg CO2 / year which is 1.2% of M.0.EL emissions. 2022 Emissions have changed by 9.2% (0.02 Gg CO2 / year). 1990-2022 Emissions have changed by 0.4% (0.00 Gg CO2 / year). For 2022 the changes per gas are: