Changes in PRIMAP-hist v2.5.1_final compared to v2.5_final for Somalia
2024-02-29
Johannes Gütschow
Change analysis for Somalia for PRIMAP-hist v2.5.1_final compared to v2.5_final
Overview over emissions by sector and gas
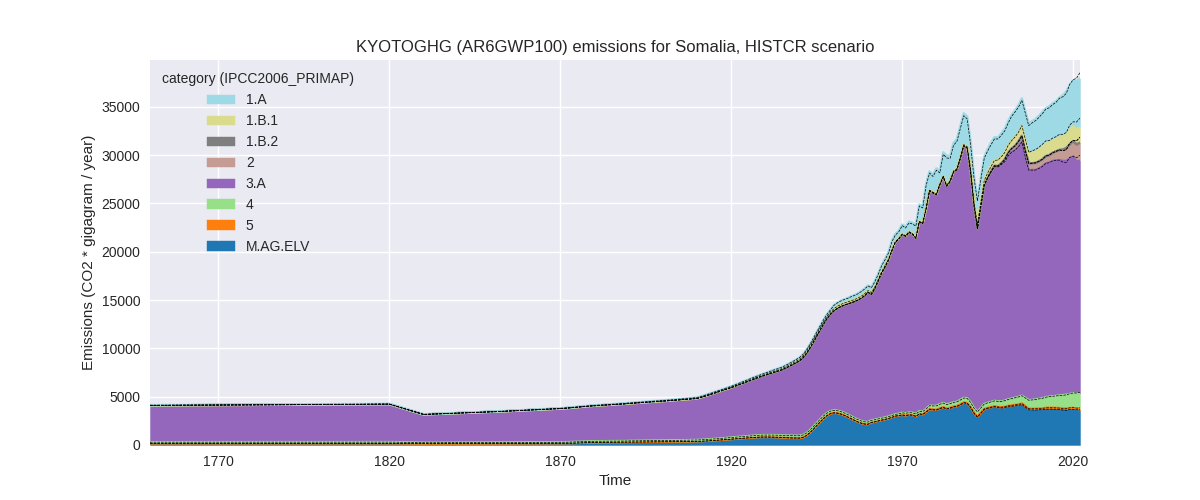
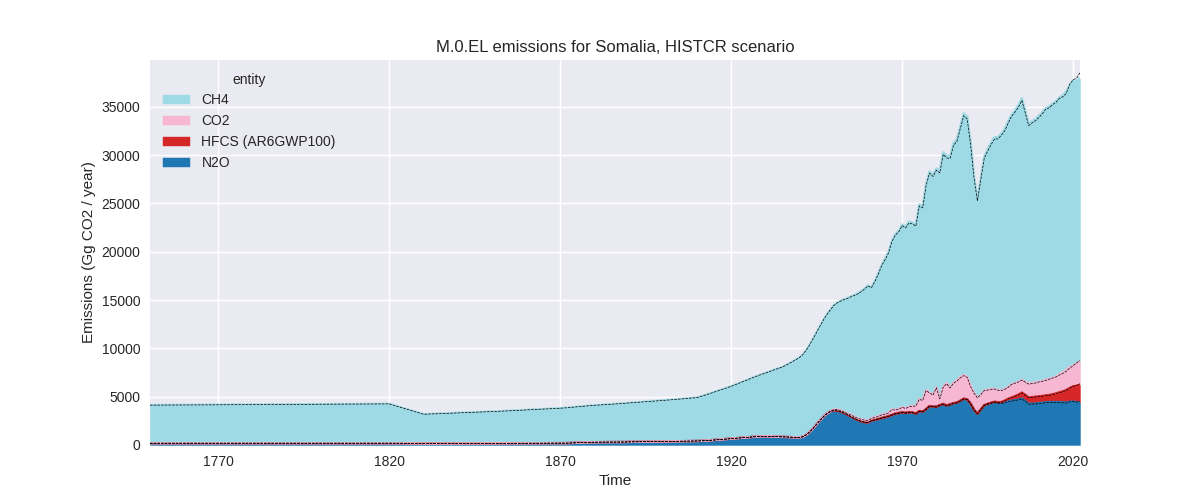
The following figures show the aggregate national total emissions excluding LULUCF AR6GWP100 for the country reported priority scenario. The dotted linesshow the v2.5_final data.
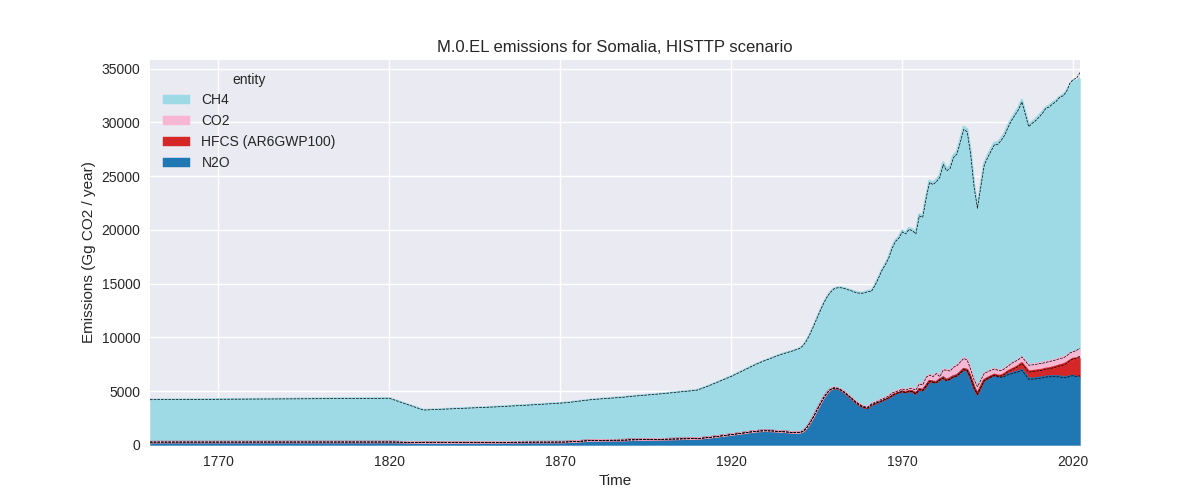
The following figures show the aggregate national total emissions excluding LULUCF AR6GWP100 for the third party priority scenario. The dotted linesshow the v2.5_final data.


Overview over changes
In the country reported priority scenario we have the following changes for aggregate Kyoto GHG and national total emissions excluding LULUCF (M.0.EL):
- Emissions in 2022 have changed by -1.5%% (-595.23 Gg CO2 / year)
- Emissions in 1990-2022 have changed by 0.4%% (121.62 Gg CO2 / year)
In the third party priority scenario we have the following changes for aggregate Kyoto GHG and national total emissions excluding LULUCF (M.0.EL):
- Emissions in 2022 have changed by -1.6%% (-538.06 Gg CO2 / year)
- Emissions in 1990-2022 have changed by 0.3%% (104.11 Gg CO2 / year)
Most important changes per scenario and time frame
In the country reported priority scenario the following sector-gas combinations have the highest absolute impact on national total KyotoGHG (AR6GWP100) emissions in 2022 (top 5):
- 1: 3.A, CH4 with -451.72 Gg CO2 / year (-1.9%)
- 2: 1.B.1, CH4 with -407.84 Gg CO2 / year (-20.9%)
- 3: 1.A, CH4 with 353.74 Gg CO2 / year (17.2%)
- 4: M.AG.ELV, N2O with -102.45 Gg CO2 / year (-2.8%)
- 5: 1.A, N2O with 35.22 Gg CO2 / year (12.6%)
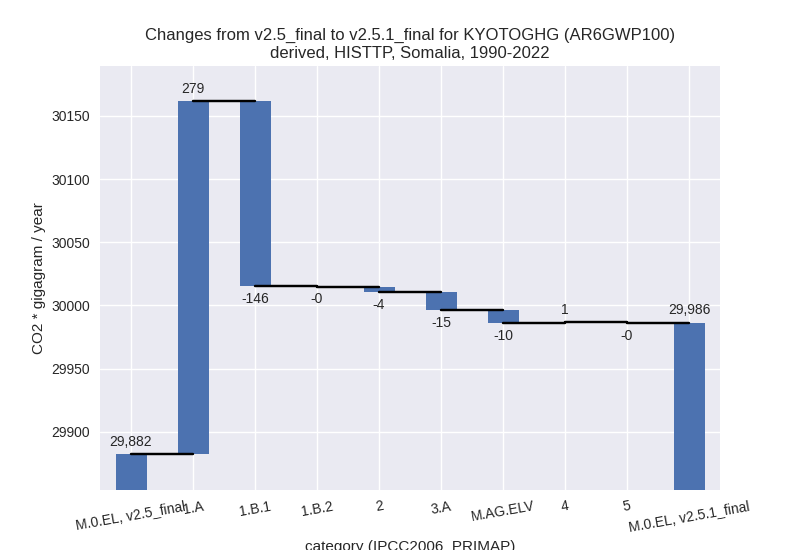
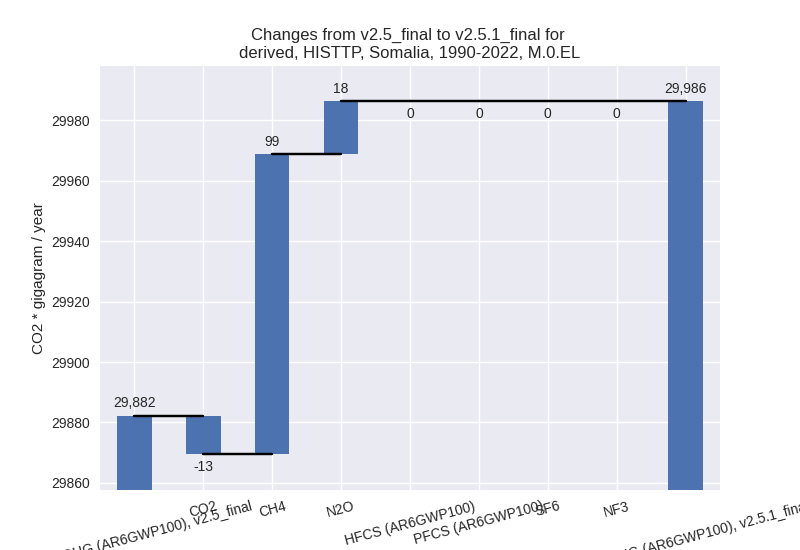
In the country reported priority scenario the following sector-gas combinations have the highest absolute impact on national total KyotoGHG (AR6GWP100) emissions in 1990-2022 (top 5):
- 1: 1.A, CH4 with 258.51 Gg CO2 / year (20.6%)
- 2: 1.B.1, CH4 with -144.49 Gg CO2 / year (-13.0%)
- 3: 1.A, N2O with 28.88 Gg CO2 / year (16.9%)
- 4: 3.A, CH4 with -19.07 Gg CO2 / year (-0.1%)
- 5: 1.A, CO2 with 12.46 Gg CO2 / year (0.8%)
In the third party priority scenario the following sector-gas combinations have the highest absolute impact on national total KyotoGHG (AR6GWP100) emissions in 2022 (top 5):
- 1: 1.B.1, CH4 with -407.84 Gg CO2 / year (-20.9%)
- 2: 1.A, CH4 with 353.74 Gg CO2 / year (17.2%)
- 3: 3.A, CH4 with -342.65 Gg CO2 / year (-1.9%)
- 4: M.AG.ELV, N2O with -166.69 Gg CO2 / year (-2.9%)
- 5: 1.A, N2O with 35.22 Gg CO2 / year (12.6%)
In the third party priority scenario the following sector-gas combinations have the highest absolute impact on national total KyotoGHG (AR6GWP100) emissions in 1990-2022 (top 5):
- 1: 1.A, CH4 with 258.51 Gg CO2 / year (20.6%)
- 2: 1.B.1, CH4 with -144.49 Gg CO2 / year (-13.0%)
- 3: 1.A, N2O with 28.88 Gg CO2 / year (16.9%)
- 4: 3.A, CH4 with -14.42 Gg CO2 / year (-0.1%)
- 5: M.AG.ELV, N2O with -9.13 Gg CO2 / year (-0.2%)
Notes on data changes
No country specific notes present for this changelog.
Changes by sector and gas
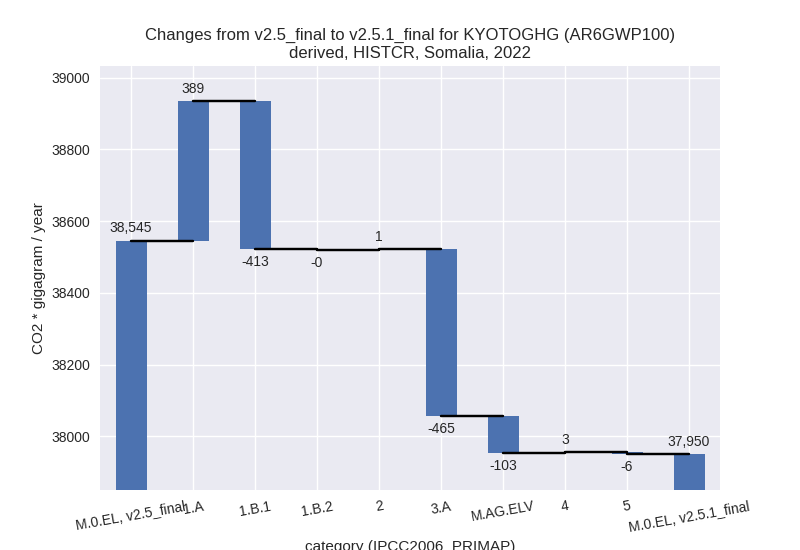
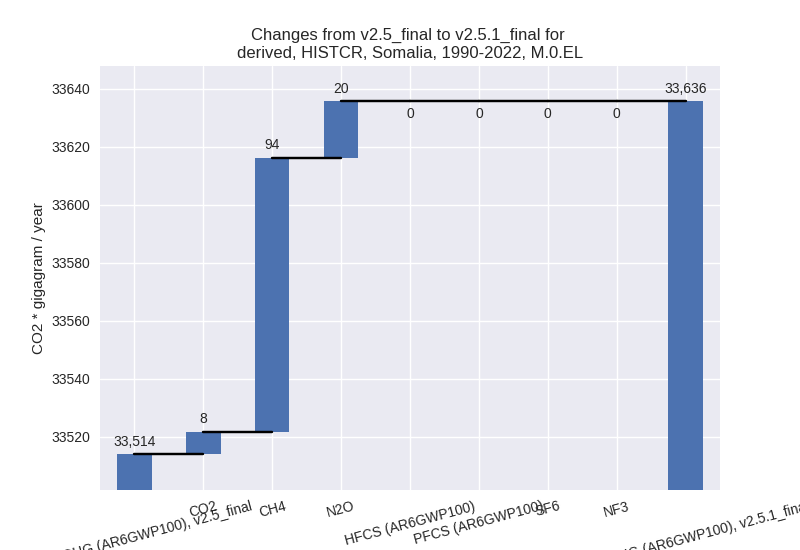
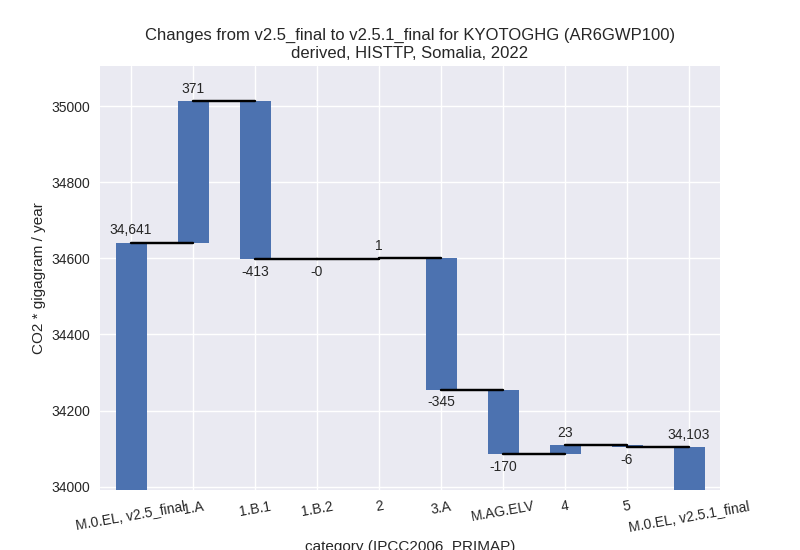
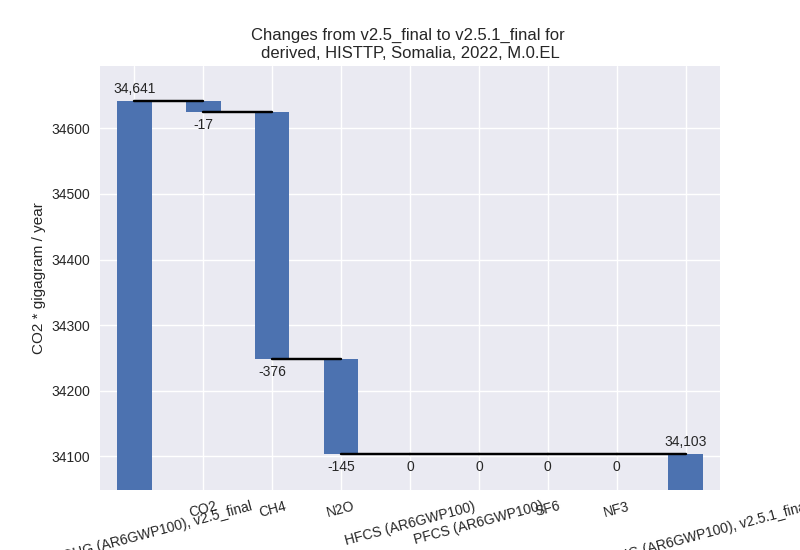
For each scenario and time frame the changes are displayed for all individual sectors and all individual gases. In the sector plot we use aggregate Kyoto GHGs in AR6GWP100. In the gas plot we usenational total emissions without LULUCF. ## country reported scenario
2022

1990-2022

third party scenario
2022
1990-2022
Detailed changes for the scenarios:
country reported scenario (HISTCR):
Most important changes per time frame
For 2022 the following sector-gas combinations have the highest absolute impact on national total KyotoGHG (AR6GWP100) emissions in 2022 (top 5):
- 1: 3.A, CH4 with -451.72 Gg CO2 / year (-1.9%)
- 2: 1.B.1, CH4 with -407.84 Gg CO2 / year (-20.9%)
- 3: 1.A, CH4 with 353.74 Gg CO2 / year (17.2%)
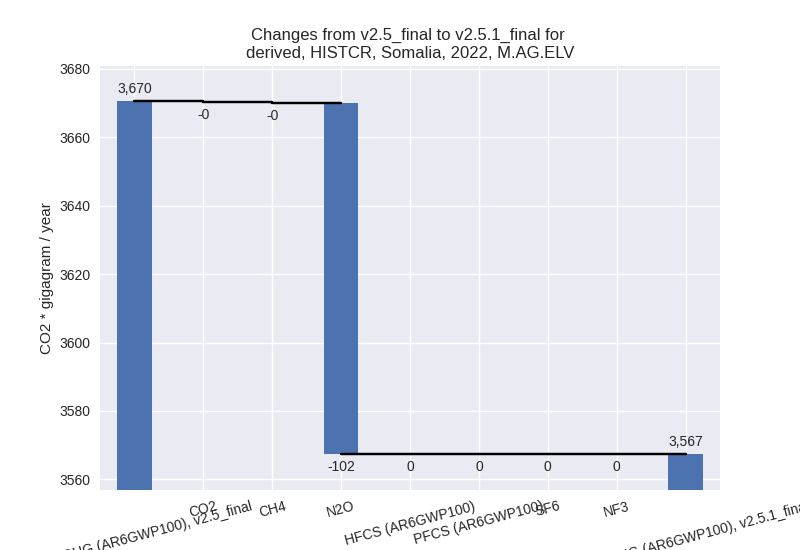
- 4: M.AG.ELV, N2O with -102.45 Gg CO2 / year (-2.8%)
- 5: 1.A, N2O with 35.22 Gg CO2 / year (12.6%)
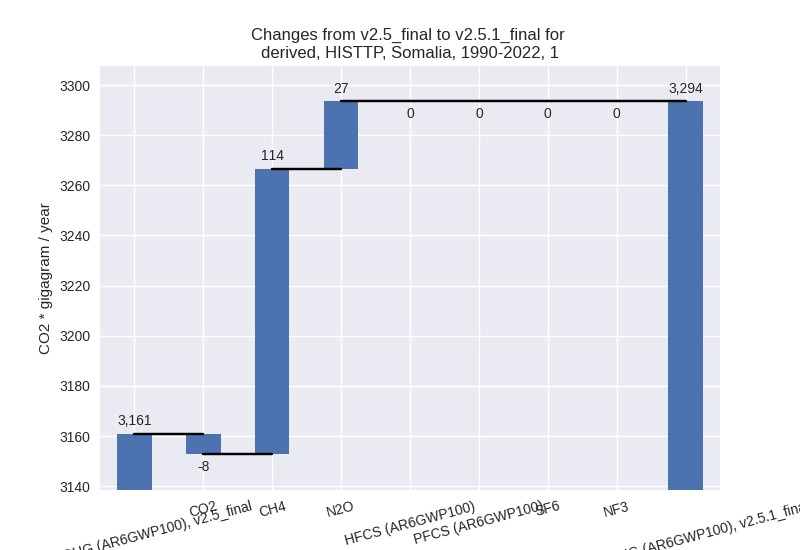
For 1990-2022 the following sector-gas combinations have the highest absolute impact on national total KyotoGHG (AR6GWP100) emissions in 1990-2022 (top 5):
- 1: 1.A, CH4 with 258.51 Gg CO2 / year (20.6%)
- 2: 1.B.1, CH4 with -144.49 Gg CO2 / year (-13.0%)
- 3: 1.A, N2O with 28.88 Gg CO2 / year (16.9%)
- 4: 3.A, CH4 with -19.07 Gg CO2 / year (-0.1%)
- 5: 1.A, CO2 with 12.46 Gg CO2 / year (0.8%)
Changes in the main sectors for aggregate KyotoGHG (AR6GWP100) are
- 1: Total sectoral emissions in 2022 are 6657.87 Gg
CO2 / year which is 17.5% of M.0.EL emissions. 2022 Emissions have
changed by -0.4% (-24.71 Gg CO2 /
year). 1990-2022 Emissions have changed by 3.7% (153.23 Gg CO2 / year). For 1990-2022
the changes per gas
are:

The changes come from the following subsectors:- 1.A: Total sectoral emissions in 2022 are 5089.70
Gg CO2 / year which is 76.4% of category 1 emissions. 2022 Emissions
have changed by 8.3% (388.96 Gg CO2
/ year). 1990-2022 Emissions have changed by 10.0% (299.84 Gg CO2 / year). For 2022 the
changes per gas
are:
For 1990-2022 the changes per gas are:
There is no subsector information available in PRIMAP-hist. - 1.B.1: Total sectoral emissions in 2022 are 1568.17
Gg CO2 / year which is 23.6% of category 1 emissions. 2022 Emissions
have changed by -20.9% (-413.24 Gg
CO2 / year). 1990-2022 Emissions have changed by -13.0% (-146.41 Gg CO2 / year). For 2022
the changes per gas
are:

For 1990-2022 the changes per gas are:
There is no subsector information available in PRIMAP-hist. - 1.B.2: Total sectoral emissions in 2022 are 0.00 Gg
CO2 / year which is 0.0% of category 1 emissions. 2022 Emissions have
changed by -99.6% (-0.42 Gg CO2 /
year). 1990-2022 Emissions have changed by -41.4% (-0.21 Gg CO2 / year). For 2022 the
changes per gas
are:

For 1990-2022 the changes per gas are:
There is no subsector information available in PRIMAP-hist.
- 1.A: Total sectoral emissions in 2022 are 5089.70
Gg CO2 / year which is 76.4% of category 1 emissions. 2022 Emissions
have changed by 8.3% (388.96 Gg CO2
/ year). 1990-2022 Emissions have changed by 10.0% (299.84 Gg CO2 / year). For 2022 the
changes per gas
are:
- 2: Total sectoral emissions in 2022 are 1874.93 Gg CO2 / year which is 4.9% of M.0.EL emissions. 2022 Emissions have changed by 0.1% (0.94 Gg CO2 / year). 1990-2022 Emissions have changed by -0.7% (-4.36 Gg CO2 / year).
- M.AG: Total sectoral emissions in 2022 are 27632.07
Gg CO2 / year which is 72.8% of M.0.EL emissions. 2022 Emissions have
changed by -2.0% (-568.39 Gg CO2 /
year). 1990-2022 Emissions have changed by -0.1% (-27.16 Gg CO2 / year). For 2022 the
changes per gas
are:
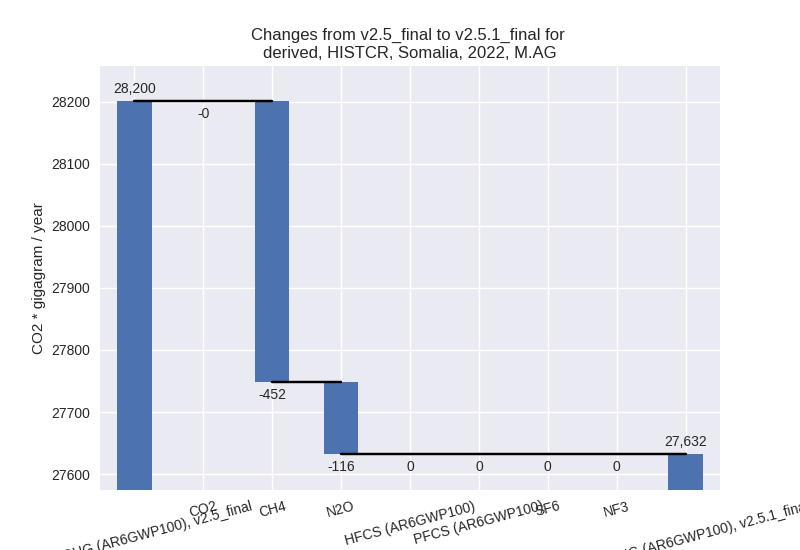
The changes come from the following subsectors:- 3.A: Total sectoral emissions in 2022 are 24064.69 Gg CO2 / year which is 87.1% of category M.AG emissions. 2022 Emissions have changed by -1.9% (-465.34 Gg CO2 / year). 1990-2022 Emissions have changed by -0.1% (-19.94 Gg CO2 / year).
- M.AG.ELV: Total sectoral emissions in 2022 are
3567.38 Gg CO2 / year which is 12.9% of category M.AG emissions. 2022
Emissions have changed by -2.8%
(-103.05 Gg CO2 / year). 1990-2022 Emissions have changed by -0.2% (-7.22 Gg CO2 / year). For 2022 the
changes per gas
are:
There is no subsector information available in PRIMAP-hist.
- 4: Total sectoral emissions in 2022 are 1612.64 Gg CO2 / year which is 4.2% of M.0.EL emissions. 2022 Emissions have changed by 0.2% (2.62 Gg CO2 / year). 1990-2022 Emissions have changed by 0.0% (0.08 Gg CO2 / year).
- 5: Total sectoral emissions in 2022 are 172.70 Gg
CO2 / year which is 0.5% of M.0.EL emissions. 2022 Emissions have
changed by -3.2% (-5.68 Gg CO2 /
year). 1990-2022 Emissions have changed by -0.2% (-0.17 Gg CO2 / year). For 2022 the
changes per gas
are:

third party scenario (HISTTP):
Most important changes per time frame
For 2022 the following sector-gas combinations have the highest absolute impact on national total KyotoGHG (AR6GWP100) emissions in 2022 (top 5):
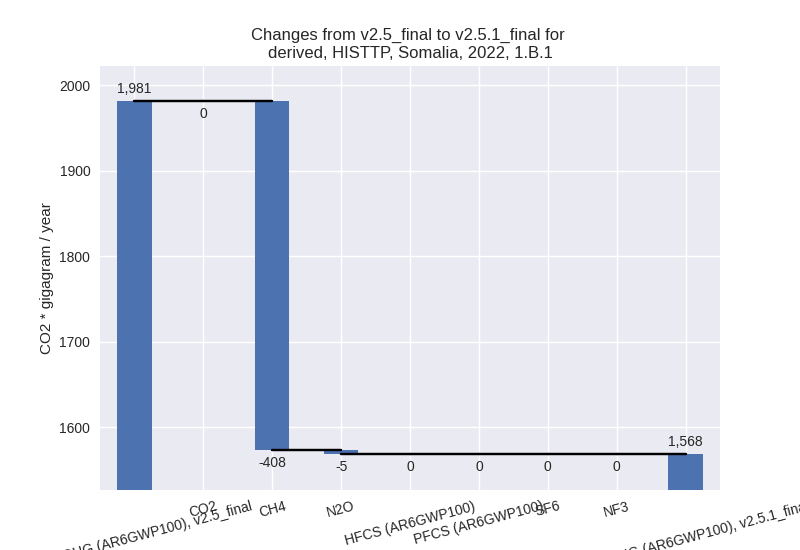
- 1: 1.B.1, CH4 with -407.84 Gg CO2 / year (-20.9%)
- 2: 1.A, CH4 with 353.74 Gg CO2 / year (17.2%)
- 3: 3.A, CH4 with -342.65 Gg CO2 / year (-1.9%)
- 4: M.AG.ELV, N2O with -166.69 Gg CO2 / year (-2.9%)
- 5: 1.A, N2O with 35.22 Gg CO2 / year (12.6%)
For 1990-2022 the following sector-gas combinations have the highest absolute impact on national total KyotoGHG (AR6GWP100) emissions in 1990-2022 (top 5):
- 1: 1.A, CH4 with 258.51 Gg CO2 / year (20.6%)
- 2: 1.B.1, CH4 with -144.49 Gg CO2 / year (-13.0%)
- 3: 1.A, N2O with 28.88 Gg CO2 / year (16.9%)
- 4: 3.A, CH4 with -14.42 Gg CO2 / year (-0.1%)
- 5: M.AG.ELV, N2O with -9.13 Gg CO2 / year (-0.2%)
Changes in the main sectors for aggregate KyotoGHG (AR6GWP100) are
- 1: Total sectoral emissions in 2022 are 4966.37 Gg
CO2 / year which is 14.6% of M.0.EL emissions. 2022 Emissions have
changed by -0.8% (-42.48 Gg CO2 /
year). 1990-2022 Emissions have changed by 4.2% (132.70 Gg CO2 / year). For 1990-2022
the changes per gas
are:
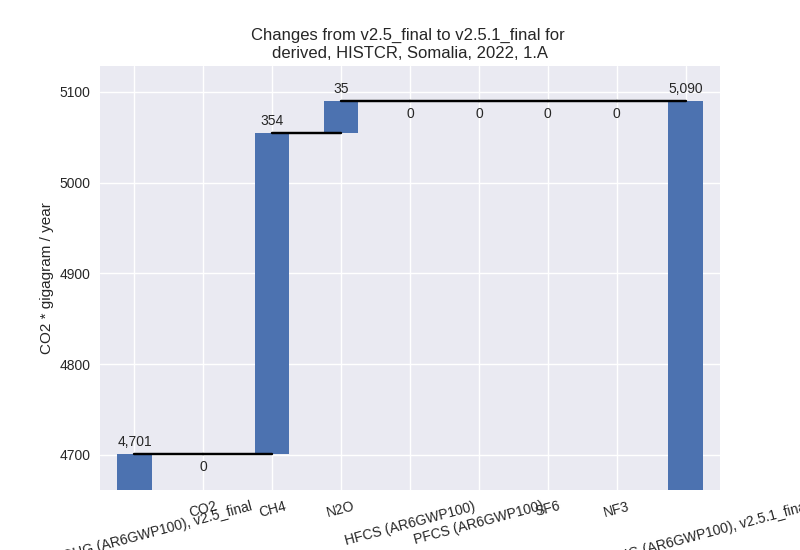
The changes come from the following subsectors:- 1.A: Total sectoral emissions in 2022 are 3398.20
Gg CO2 / year which is 68.4% of category 1 emissions. 2022 Emissions
have changed by 12.3% (371.19 Gg CO2
/ year). 1990-2022 Emissions have changed by 13.7% (279.31 Gg CO2 / year). For 2022 the
changes per gas
are:

For 1990-2022 the changes per gas are: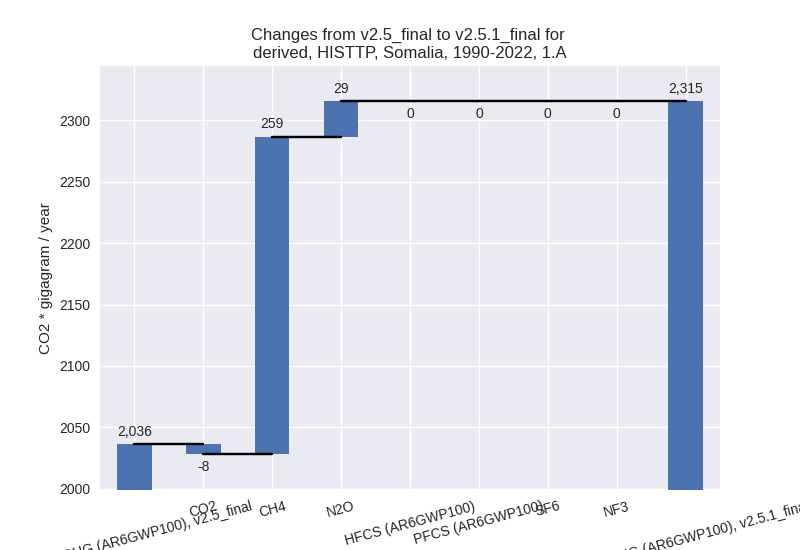
There is no subsector information available in PRIMAP-hist. - 1.B.1: Total sectoral emissions in 2022 are 1568.17
Gg CO2 / year which is 31.6% of category 1 emissions. 2022 Emissions
have changed by -20.9% (-413.24 Gg
CO2 / year). 1990-2022 Emissions have changed by -13.0% (-146.41 Gg CO2 / year). For 2022
the changes per gas
are:
For 1990-2022 the changes per gas are:
There is no subsector information available in PRIMAP-hist. - 1.B.2: Total sectoral emissions in 2022 are 0.00 Gg
CO2 / year which is 0.0% of category 1 emissions. 2022 Emissions have
changed by -99.6% (-0.42 Gg CO2 /
year). 1990-2022 Emissions have changed by -41.4% (-0.21 Gg CO2 / year). For 2022 the
changes per gas
are:

For 1990-2022 the changes per gas are:
There is no subsector information available in PRIMAP-hist.
- 1.A: Total sectoral emissions in 2022 are 3398.20
Gg CO2 / year which is 68.4% of category 1 emissions. 2022 Emissions
have changed by 12.3% (371.19 Gg CO2
/ year). 1990-2022 Emissions have changed by 13.7% (279.31 Gg CO2 / year). For 2022 the
changes per gas
are:
- 2: Total sectoral emissions in 2022 are 1874.93 Gg CO2 / year which is 5.5% of M.0.EL emissions. 2022 Emissions have changed by 0.1% (0.94 Gg CO2 / year). 1990-2022 Emissions have changed by -0.7% (-4.36 Gg CO2 / year).
- M.AG: Total sectoral emissions in 2022 are 23547.88
Gg CO2 / year which is 69.0% of M.0.EL emissions. 2022 Emissions have
changed by -2.1% (-514.32 Gg CO2 /
year). 1990-2022 Emissions have changed by -0.1% (-24.77 Gg CO2 / year). For 2022 the
changes per gas
are:

The changes come from the following subsectors:- 3.A: Total sectoral emissions in 2022 are 17915.22 Gg CO2 / year which is 76.1% of category M.AG emissions. 2022 Emissions have changed by -1.9% (-344.50 Gg CO2 / year). 1990-2022 Emissions have changed by -0.1% (-14.56 Gg CO2 / year).
- M.AG.ELV: Total sectoral emissions in 2022 are
5632.66 Gg CO2 / year which is 23.9% of category M.AG emissions. 2022
Emissions have changed by -2.9%
(-169.82 Gg CO2 / year). 1990-2022 Emissions have changed by -0.2% (-10.22 Gg CO2 / year). For 2022 the
changes per gas
are:

There is no subsector information available in PRIMAP-hist.
- 4: Total sectoral emissions in 2022 are 3541.36 Gg CO2 / year which is 10.4% of M.0.EL emissions. 2022 Emissions have changed by 0.7% (23.49 Gg CO2 / year). 1990-2022 Emissions have changed by 0.0% (0.71 Gg CO2 / year).
- 5: Total sectoral emissions in 2022 are 172.70 Gg
CO2 / year which is 0.5% of M.0.EL emissions. 2022 Emissions have
changed by -3.2% (-5.68 Gg CO2 /
year). 1990-2022 Emissions have changed by -0.2% (-0.17 Gg CO2 / year). For 2022 the
changes per gas
are:
