Changes in PRIMAP-hist v2.5.1_final compared to v2.5_final for Serbia
2024-02-29
Johannes Gütschow
Change analysis for Serbia for PRIMAP-hist v2.5.1_final compared to v2.5_final
Overview over emissions by sector and gas
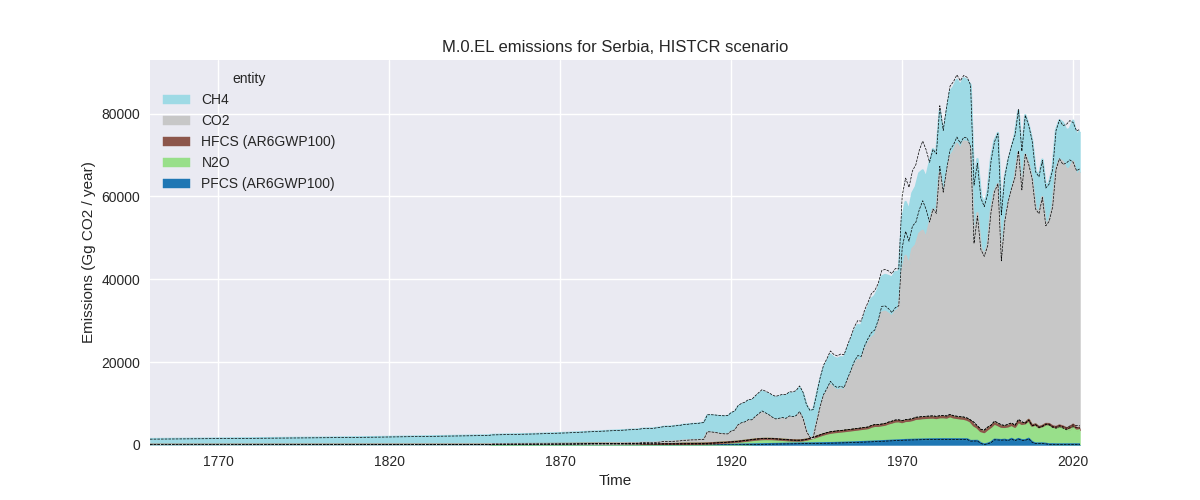
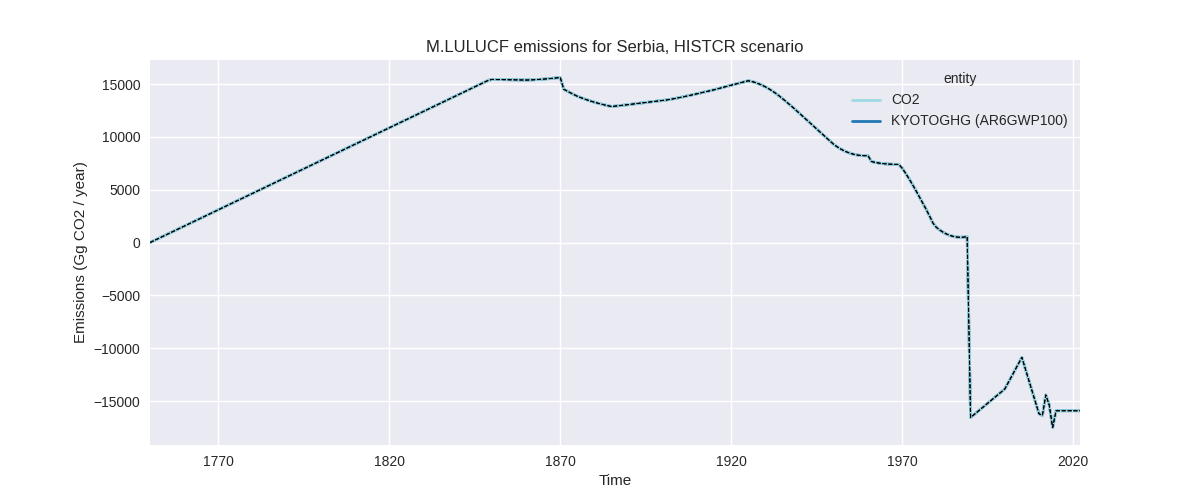
The following figures show the aggregate national total emissions excluding LULUCF AR6GWP100 for the country reported priority scenario. The dotted linesshow the v2.5_final data.

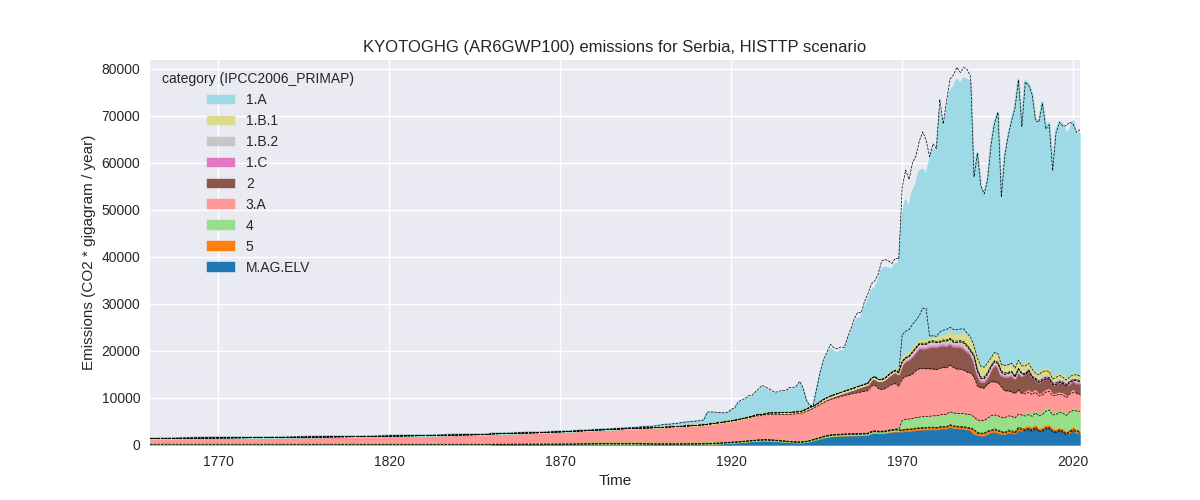
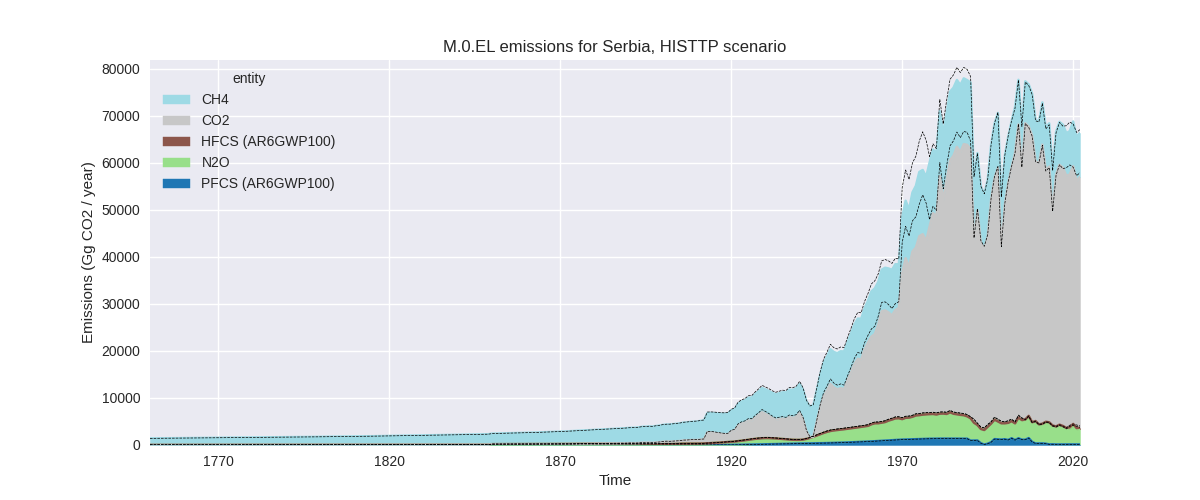
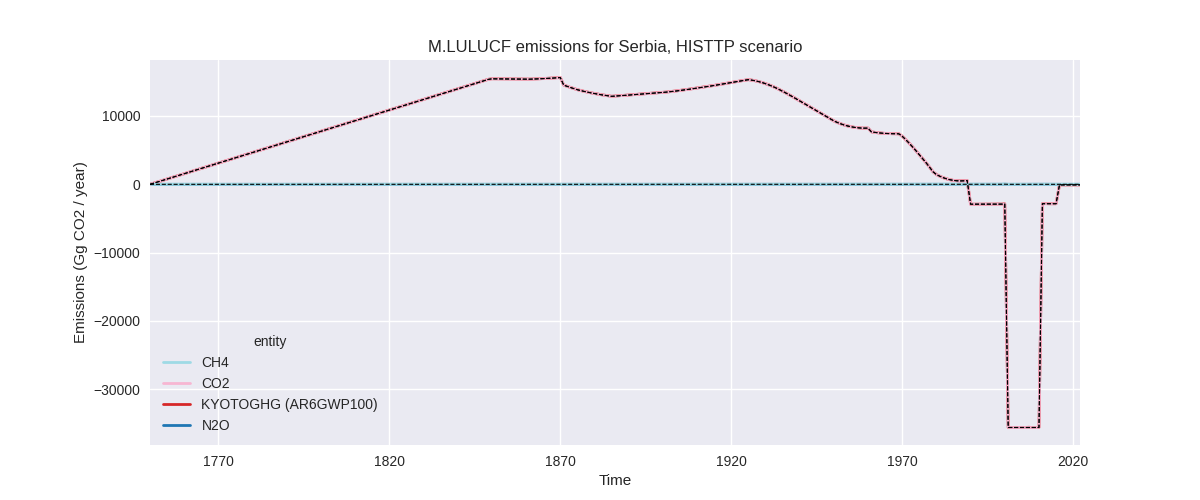
The following figures show the aggregate national total emissions excluding LULUCF AR6GWP100 for the third party priority scenario. The dotted linesshow the v2.5_final data.
Overview over changes
In the country reported priority scenario we have the following changes for aggregate Kyoto GHG and national total emissions excluding LULUCF (M.0.EL):
- Emissions in 2022 have changed by -0.7%% (-513.14 Gg CO2 / year)
- Emissions in 1990-2022 have changed by -0.0%% (-20.25 Gg CO2 / year)
In the third party priority scenario we have the following changes for aggregate Kyoto GHG and national total emissions excluding LULUCF (M.0.EL):
- Emissions in 2022 have changed by -1.1%% (-707.50 Gg CO2 / year)
- Emissions in 1990-2022 have changed by -0.2%% (-145.88 Gg CO2 / year)
Most important changes per scenario and time frame
In the country reported priority scenario the following sector-gas combinations have the highest absolute impact on national total KyotoGHG (AR6GWP100) emissions in 2022 (top 5):
- 1: 1.A, CO2 with -810.01 Gg CO2 / year (-1.4%)
- 2: M.AG.ELV, N2O with -421.72 Gg CO2 / year (-17.5%)
- 3: M.AG.ELV, CO2 with 335.02 Gg CO2 / year (246.8%)
- 4: 2, CO2 with 285.08 Gg CO2 / year (12.5%)
- 5: 1.A, CH4 with 86.60 Gg CO2 / year (18.5%)
In the country reported priority scenario the following sector-gas combinations have the highest absolute impact on national total KyotoGHG (AR6GWP100) emissions in 1990-2022 (top 5):
- 1: M.AG.ELV, N2O with -273.64 Gg CO2 / year (-10.2%)
- 2: M.AG.ELV, CO2 with 91.59 Gg CO2 / year (81.6%)
- 3: 1.B.1, CH4 with 81.14 Gg CO2 / year (7.4%)
- 4: 1.B.2, CH4 with 76.86 Gg CO2 / year (28.8%)
- 5: 1.A, CO2 with -33.24 Gg CO2 / year (-0.1%)
In the third party priority scenario the following sector-gas combinations have the highest absolute impact on national total KyotoGHG (AR6GWP100) emissions in 2022 (top 5):
- 1: 1.A, CO2 with -701.18 Gg CO2 / year (-1.4%)
- 2: M.AG.ELV, N2O with -421.72 Gg CO2 / year (-17.5%)
- 3: M.AG.ELV, CO2 with 335.02 Gg CO2 / year (246.8%)
- 4: 1.A, CH4 with 167.96 Gg CO2 / year (30.9%)
- 5: 4, CH4 with -130.86 Gg CO2 / year (-3.3%)
In the third party priority scenario the following sector-gas combinations have the highest absolute impact on national total KyotoGHG (AR6GWP100) emissions in 1990-2022 (top 5):
- 1: M.AG.ELV, N2O with -273.64 Gg CO2 / year (-10.2%)
- 2: 2, CO2 with -102.12 Gg CO2 / year (-4.8%)
- 3: M.AG.ELV, CO2 with 91.59 Gg CO2 / year (81.6%)
- 4: 1.B.1, CH4 with 81.14 Gg CO2 / year (7.4%)
- 5: 1.B.2, CH4 with 76.86 Gg CO2 / year (28.8%)
Notes on data changes
No country specific notes present for this changelog.
Changes by sector and gas
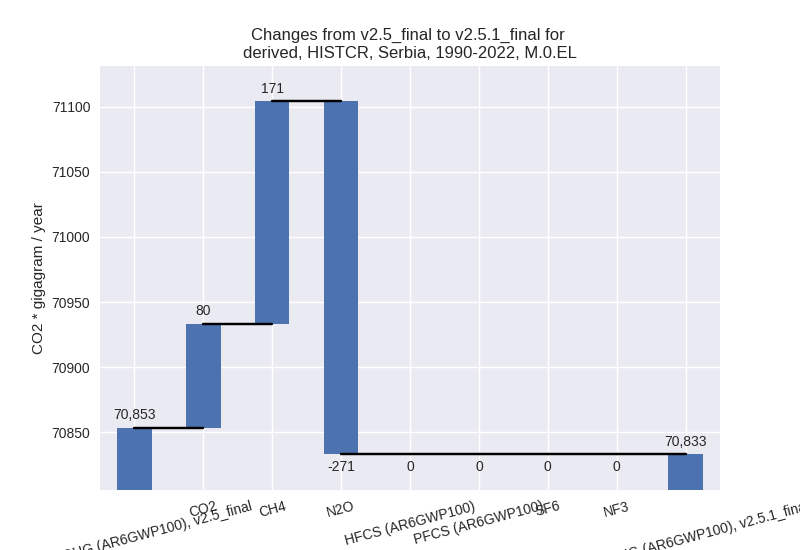
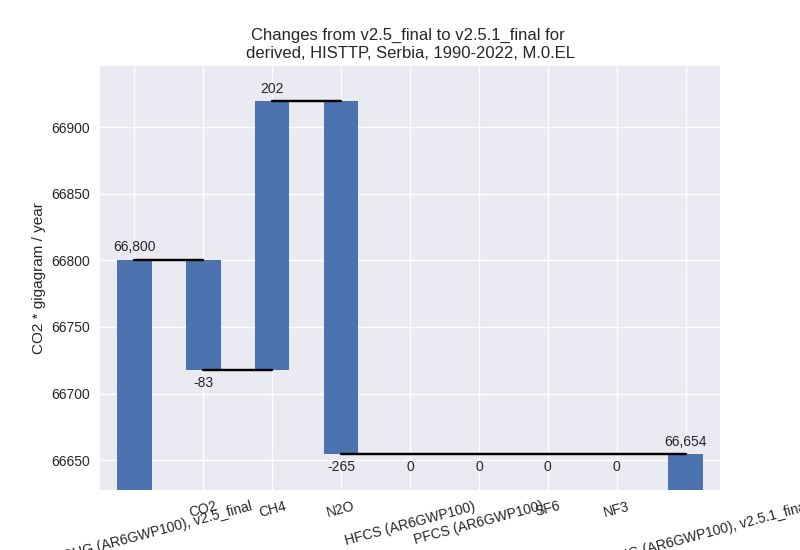
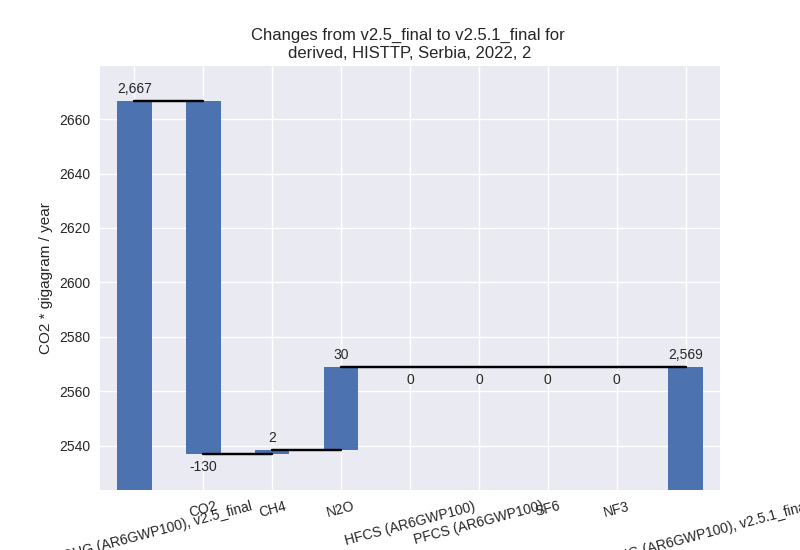
For each scenario and time frame the changes are displayed for all individual sectors and all individual gases. In the sector plot we use aggregate Kyoto GHGs in AR6GWP100. In the gas plot we usenational total emissions without LULUCF. ## country reported scenario
2022

1990-2022
third party scenario
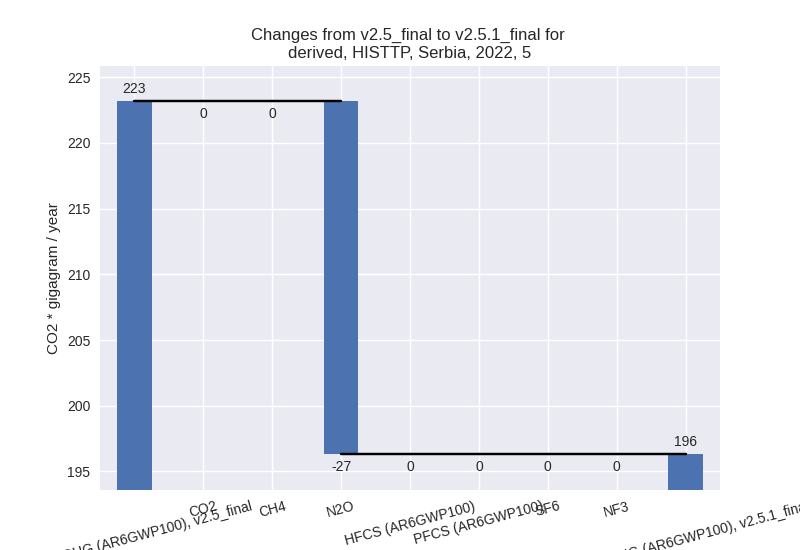
2022


1990-2022

Detailed changes for the scenarios:
country reported scenario (HISTCR):
Most important changes per time frame
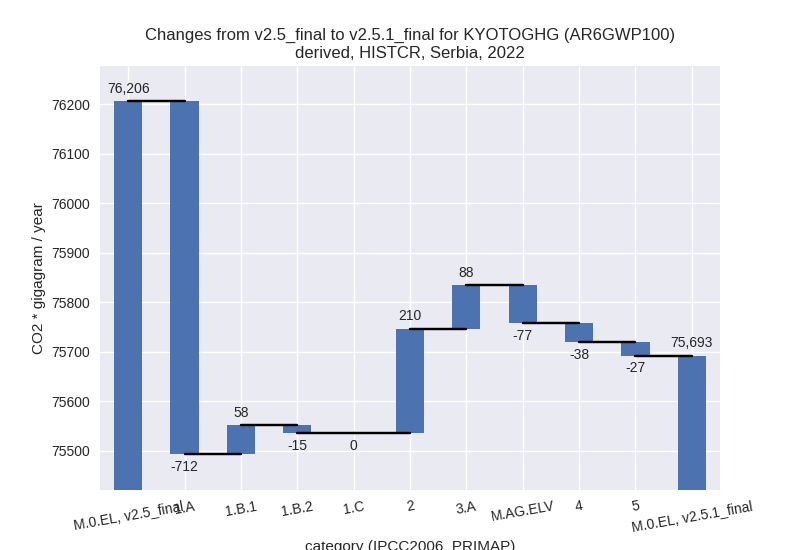
For 2022 the following sector-gas combinations have the highest absolute impact on national total KyotoGHG (AR6GWP100) emissions in 2022 (top 5):
- 1: 1.A, CO2 with -810.01 Gg CO2 / year (-1.4%)
- 2: M.AG.ELV, N2O with -421.72 Gg CO2 / year (-17.5%)
- 3: M.AG.ELV, CO2 with 335.02 Gg CO2 / year (246.8%)
- 4: 2, CO2 with 285.08 Gg CO2 / year (12.5%)
- 5: 1.A, CH4 with 86.60 Gg CO2 / year (18.5%)
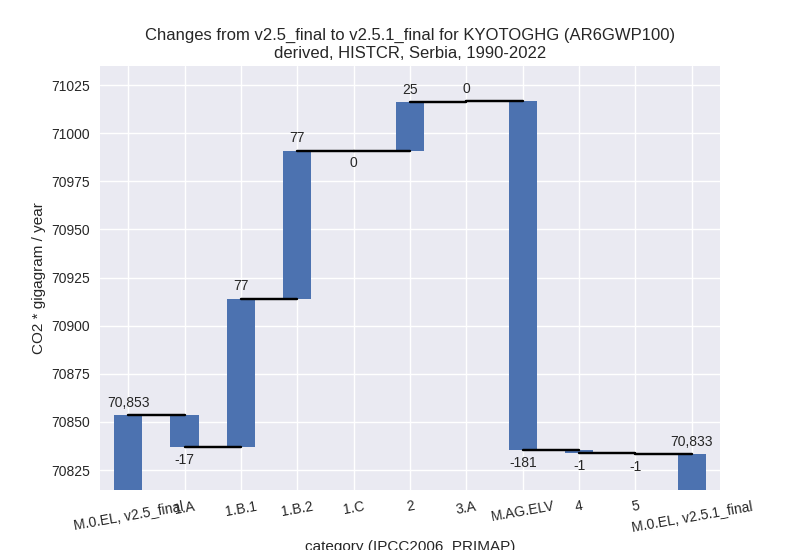
For 1990-2022 the following sector-gas combinations have the highest absolute impact on national total KyotoGHG (AR6GWP100) emissions in 1990-2022 (top 5):
- 1: M.AG.ELV, N2O with -273.64 Gg CO2 / year (-10.2%)
- 2: M.AG.ELV, CO2 with 91.59 Gg CO2 / year (81.6%)
- 3: 1.B.1, CH4 with 81.14 Gg CO2 / year (7.4%)
- 4: 1.B.2, CH4 with 76.86 Gg CO2 / year (28.8%)
- 5: 1.A, CO2 with -33.24 Gg CO2 / year (-0.1%)
Changes in the main sectors for aggregate KyotoGHG (AR6GWP100) are
- 1: Total sectoral emissions in 2022 are 60962.53 Gg CO2 / year which is 80.5% of M.0.EL emissions. 2022 Emissions have changed by -1.1% (-668.92 Gg CO2 / year). 1990-2022 Emissions have changed by 0.3% (137.58 Gg CO2 / year).
- 2: Total sectoral emissions in 2022 are 3798.23 Gg
CO2 / year which is 5.0% of M.0.EL emissions. 2022 Emissions have
changed by 5.8% (209.76 Gg CO2 /
year). 1990-2022 Emissions have changed by 0.6% (25.14 Gg CO2 / year). For 2022 the
changes per gas
are:

- M.AG: Total sectoral emissions in 2022 are 6242.02
Gg CO2 / year which is 8.2% of M.0.EL emissions. 2022 Emissions have
changed by 0.2% (11.00 Gg CO2 /
year). 1990-2022 Emissions have changed by -2.2% (-181.00 Gg CO2 / year). For
1990-2022 the changes per gas
are:

The changes come from the following subsectors:- 3.A: Total sectoral emissions in 2022 are 3685.03
Gg CO2 / year which is 59.0% of category M.AG emissions. 2022 Emissions
have changed by 2.5% (88.38 Gg CO2 /
year). 1990-2022 Emissions have changed by 0.0% (0.44 Gg CO2 / year). For 2022 the
changes per gas
are:

There is no subsector information available in PRIMAP-hist. - M.AG.ELV: Total sectoral emissions in 2022 are
2556.99 Gg CO2 / year which is 41.0% of category M.AG emissions. 2022
Emissions have changed by -2.9%
(-77.39 Gg CO2 / year). 1990-2022 Emissions have changed by -6.2% (-181.44 Gg CO2 / year). For 2022
the changes per gas
are:

For 1990-2022 the changes per gas are: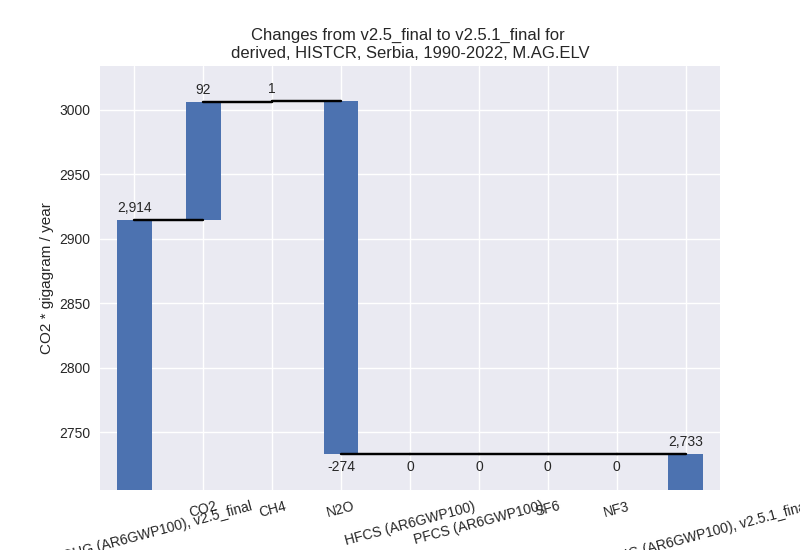
There is no subsector information available in PRIMAP-hist.
- 3.A: Total sectoral emissions in 2022 are 3685.03
Gg CO2 / year which is 59.0% of category M.AG emissions. 2022 Emissions
have changed by 2.5% (88.38 Gg CO2 /
year). 1990-2022 Emissions have changed by 0.0% (0.44 Gg CO2 / year). For 2022 the
changes per gas
are:
- 4: Total sectoral emissions in 2022 are 4493.59 Gg CO2 / year which is 5.9% of M.0.EL emissions. 2022 Emissions have changed by -0.8% (-38.12 Gg CO2 / year). 1990-2022 Emissions have changed by -0.0% (-1.16 Gg CO2 / year).
- 5: Total sectoral emissions in 2022 are 196.31 Gg
CO2 / year which is 0.3% of M.0.EL emissions. 2022 Emissions have
changed by -12.0% (-26.86 Gg CO2 /
year). 1990-2022 Emissions have changed by -0.4% (-0.81 Gg CO2 / year). For 2022 the
changes per gas
are:

third party scenario (HISTTP):
Most important changes per time frame
For 2022 the following sector-gas combinations have the highest absolute impact on national total KyotoGHG (AR6GWP100) emissions in 2022 (top 5):
- 1: 1.A, CO2 with -701.18 Gg CO2 / year (-1.4%)
- 2: M.AG.ELV, N2O with -421.72 Gg CO2 / year (-17.5%)
- 3: M.AG.ELV, CO2 with 335.02 Gg CO2 / year (246.8%)
- 4: 1.A, CH4 with 167.96 Gg CO2 / year (30.9%)
- 5: 4, CH4 with -130.86 Gg CO2 / year (-3.3%)
For 1990-2022 the following sector-gas combinations have the highest absolute impact on national total KyotoGHG (AR6GWP100) emissions in 1990-2022 (top 5):
- 1: M.AG.ELV, N2O with -273.64 Gg CO2 / year (-10.2%)
- 2: 2, CO2 with -102.12 Gg CO2 / year (-4.8%)
- 3: M.AG.ELV, CO2 with 91.59 Gg CO2 / year (81.6%)
- 4: 1.B.1, CH4 with 81.14 Gg CO2 / year (7.4%)
- 5: 1.B.2, CH4 with 76.86 Gg CO2 / year (28.8%)
Changes in the main sectors for aggregate KyotoGHG (AR6GWP100) are
- 1: Total sectoral emissions in 2022 are 53209.70 Gg CO2 / year which is 80.2% of M.0.EL emissions. 2022 Emissions have changed by -0.9% (-468.80 Gg CO2 / year). 1990-2022 Emissions have changed by 0.3% (139.89 Gg CO2 / year).
- 2: Total sectoral emissions in 2022 are 2568.71 Gg
CO2 / year which is 3.9% of M.0.EL emissions. 2022 Emissions have
changed by -3.7% (-97.88 Gg CO2 /
year). 1990-2022 Emissions have changed by -3.1% (-100.16 Gg CO2 / year). For 2022
the changes per gas
are:
For 1990-2022 the changes per gas are:
- M.AG: Total sectoral emissions in 2022 are 6242.02
Gg CO2 / year which is 9.4% of M.0.EL emissions. 2022 Emissions have
changed by 0.2% (11.00 Gg CO2 /
year). 1990-2022 Emissions have changed by -2.2% (-181.00 Gg CO2 / year). For
1990-2022 the changes per gas
are:

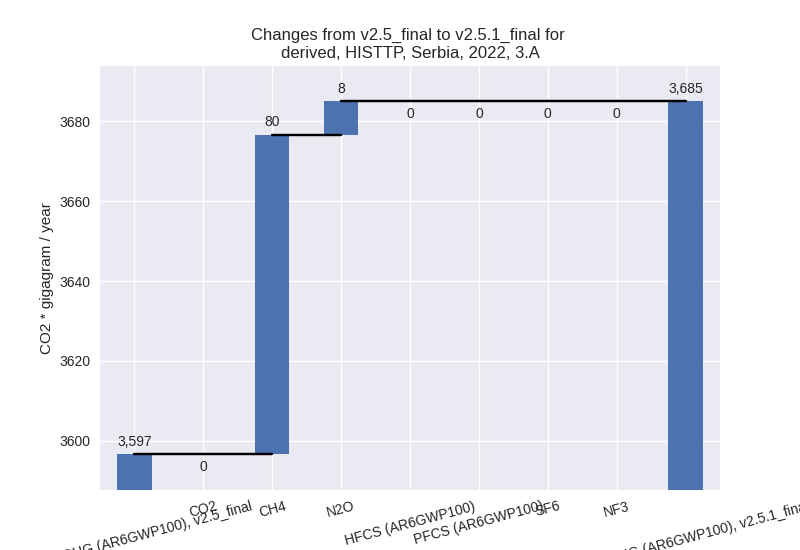
The changes come from the following subsectors:- 3.A: Total sectoral emissions in 2022 are 3685.03
Gg CO2 / year which is 59.0% of category M.AG emissions. 2022 Emissions
have changed by 2.5% (88.38 Gg CO2 /
year). 1990-2022 Emissions have changed by 0.0% (0.44 Gg CO2 / year). For 2022 the
changes per gas
are:
There is no subsector information available in PRIMAP-hist. - M.AG.ELV: Total sectoral emissions in 2022 are
2556.99 Gg CO2 / year which is 41.0% of category M.AG emissions. 2022
Emissions have changed by -2.9%
(-77.39 Gg CO2 / year). 1990-2022 Emissions have changed by -6.2% (-181.44 Gg CO2 / year). For 2022
the changes per gas
are:
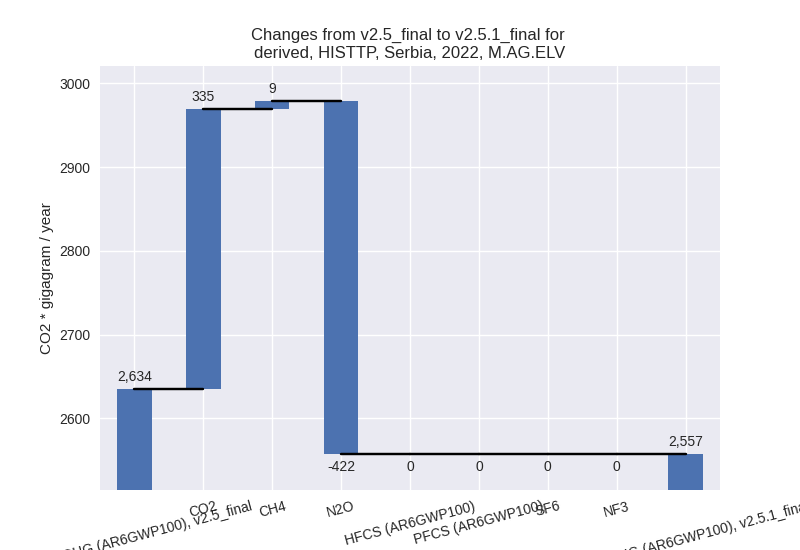
For 1990-2022 the changes per gas are:
There is no subsector information available in PRIMAP-hist.
- 3.A: Total sectoral emissions in 2022 are 3685.03
Gg CO2 / year which is 59.0% of category M.AG emissions. 2022 Emissions
have changed by 2.5% (88.38 Gg CO2 /
year). 1990-2022 Emissions have changed by 0.0% (0.44 Gg CO2 / year). For 2022 the
changes per gas
are:
- 4: Total sectoral emissions in 2022 are 4154.54 Gg
CO2 / year which is 6.3% of M.0.EL emissions. 2022 Emissions have
changed by -2.9% (-124.96 Gg CO2 /
year). 1990-2022 Emissions have changed by -0.1% (-3.79 Gg CO2 / year). For 2022 the
changes per gas
are:

- 5: Total sectoral emissions in 2022 are 196.31 Gg
CO2 / year which is 0.3% of M.0.EL emissions. 2022 Emissions have
changed by -12.0% (-26.86 Gg CO2 /
year). 1990-2022 Emissions have changed by -0.4% (-0.81 Gg CO2 / year). For 2022 the
changes per gas
are: