Changes in PRIMAP-hist v2.5.1_final compared to v2.5_final for South Sudan
2024-02-29
Johannes Gütschow
Change analysis for South Sudan for PRIMAP-hist v2.5.1_final compared to v2.5_final
Overview over emissions by sector and gas
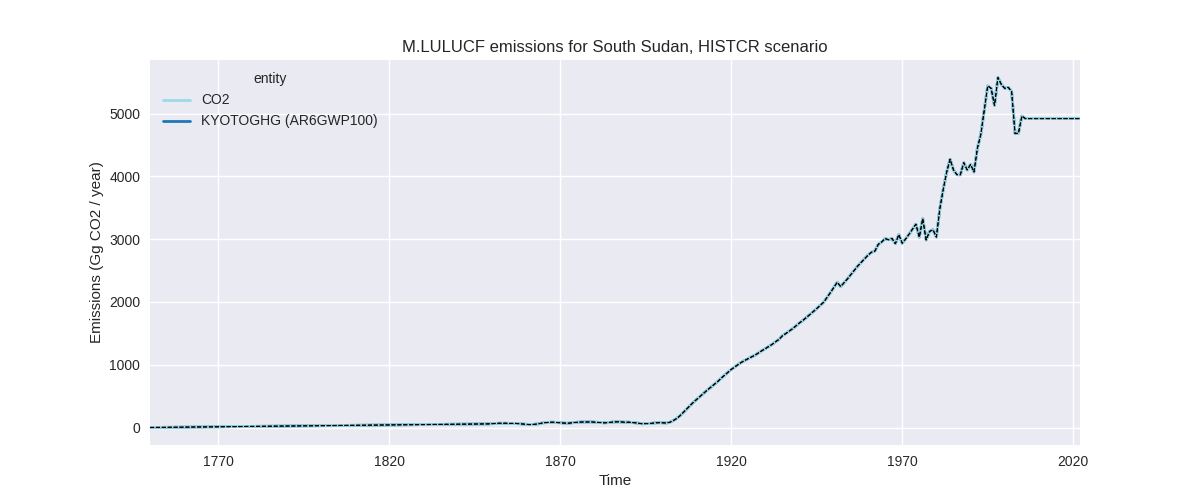
The following figures show the aggregate national total emissions excluding LULUCF AR6GWP100 for the country reported priority scenario. The dotted linesshow the v2.5_final data.


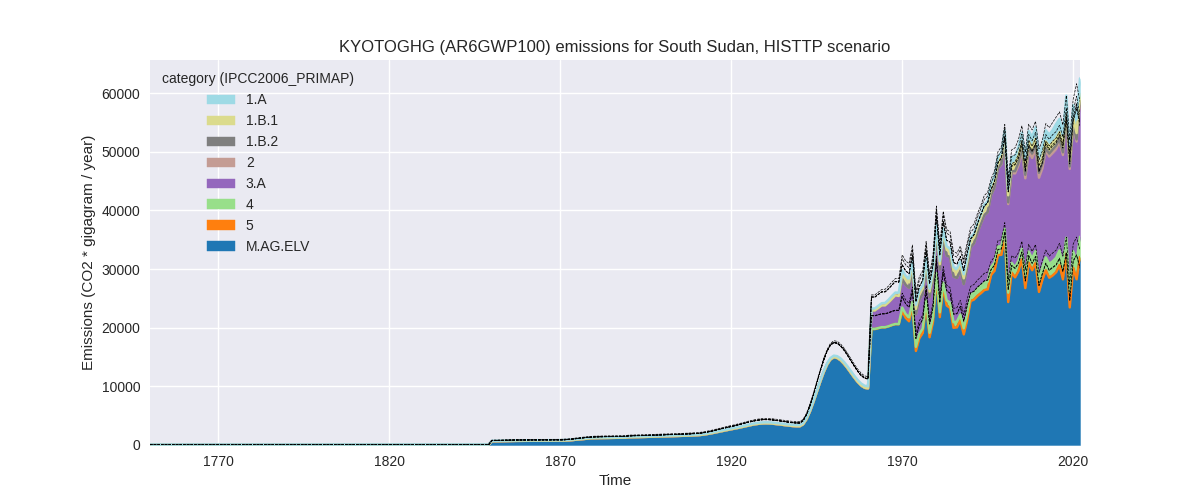
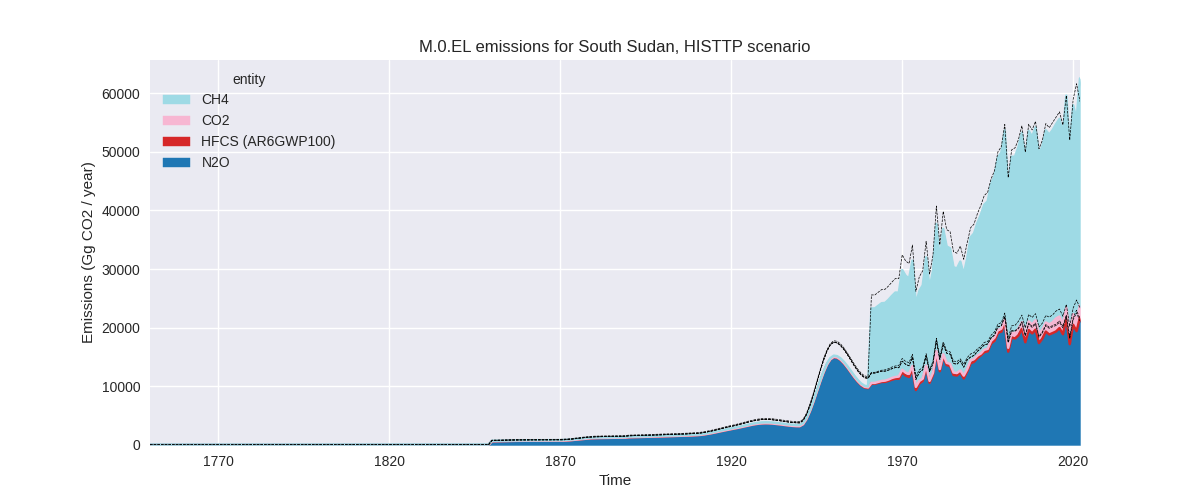
The following figures show the aggregate national total emissions excluding LULUCF AR6GWP100 for the third party priority scenario. The dotted linesshow the v2.5_final data.

Overview over changes
In the country reported priority scenario we have the following changes for aggregate Kyoto GHG and national total emissions excluding LULUCF (M.0.EL):
- Emissions in 2022 have changed by 6.8%% (3971.94 Gg CO2 / year)
- Emissions in 1990-2022 have changed by -2.4%% (-1207.94 Gg CO2 / year)
In the third party priority scenario we have the following changes for aggregate Kyoto GHG and national total emissions excluding LULUCF (M.0.EL):
- Emissions in 2022 have changed by 6.8%% (3971.94 Gg CO2 / year)
- Emissions in 1990-2022 have changed by -2.4%% (-1207.94 Gg CO2 / year)
Most important changes per scenario and time frame
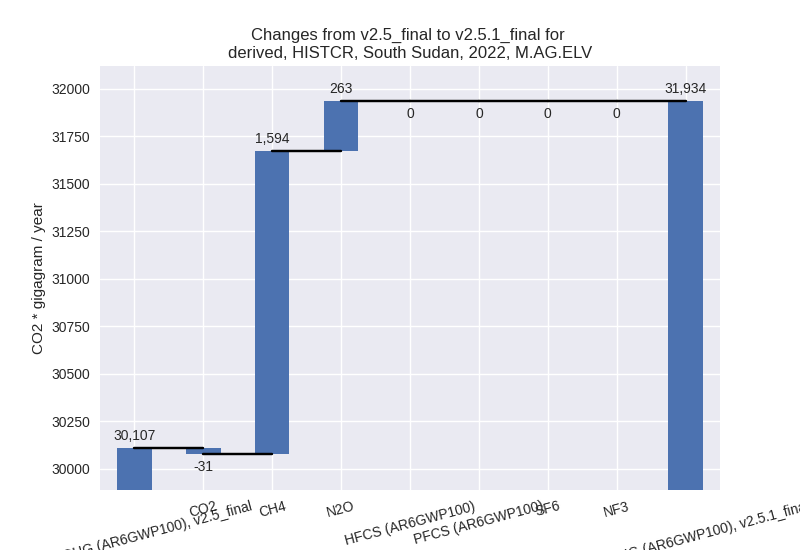
In the country reported priority scenario the following sector-gas combinations have the highest absolute impact on national total KyotoGHG (AR6GWP100) emissions in 2022 (top 5):
- 1: M.AG.ELV, CH4 with 1593.62 Gg CO2 / year (16.7%)
- 2: 3.A, CH4 with 1351.54 Gg CO2 / year (6.4%)
- 3: 4, CH4 with 479.24 Gg CO2 / year (17.1%)
- 4: 1.A, CO2 with 291.01 Gg CO2 / year (18.0%)
- 5: M.AG.ELV, N2O with 263.24 Gg CO2 / year (1.3%)
In the country reported priority scenario the following sector-gas combinations have the highest absolute impact on national total KyotoGHG (AR6GWP100) emissions in 1990-2022 (top 5):
- 1: M.AG.ELV, N2O with -1203.34 Gg CO2 / year (-6.3%)
- 2: M.AG.ELV, CH4 with -56.19 Gg CO2 / year (-0.5%)
- 3: 1.A, CO2 with 37.97 Gg CO2 / year (3.7%)
- 4: 3.A, CH4 with -19.43 Gg CO2 / year (-0.1%)
- 5: 1.B.1, CH4 with 16.12 Gg CO2 / year (1.5%)
In the third party priority scenario the following sector-gas combinations have the highest absolute impact on national total KyotoGHG (AR6GWP100) emissions in 2022 (top 5):
- 1: M.AG.ELV, CH4 with 1593.62 Gg CO2 / year (16.7%)
- 2: 3.A, CH4 with 1351.54 Gg CO2 / year (6.4%)
- 3: 4, CH4 with 479.24 Gg CO2 / year (17.1%)
- 4: 1.A, CO2 with 291.01 Gg CO2 / year (18.0%)
- 5: M.AG.ELV, N2O with 263.24 Gg CO2 / year (1.3%)
In the third party priority scenario the following sector-gas combinations have the highest absolute impact on national total KyotoGHG (AR6GWP100) emissions in 1990-2022 (top 5):
- 1: M.AG.ELV, N2O with -1203.34 Gg CO2 / year (-6.3%)
- 2: M.AG.ELV, CH4 with -56.19 Gg CO2 / year (-0.5%)
- 3: 1.A, CO2 with 37.97 Gg CO2 / year (3.7%)
- 4: 3.A, CH4 with -19.43 Gg CO2 / year (-0.1%)
- 5: 1.B.1, CH4 with 16.12 Gg CO2 / year (1.5%)
Notes on data changes
Here we list notes explaining important emissions changes for the country. ’' means that the following text only applies to the TP time series, while means that it only applies to the CR scenario. Otherwise the note applies to both scenarios.
General note: We have no country reported data for South Sudan, thus CR and TP time-series are identical except for LULUCF.
- M.AG.ELV, CH4: 2021 and 2022 emissions have changed due to new FAO and EDGAR data
- M.AG.ELV, N2O: Updated FAO data are lower for all years. 2022 emissions are very similar due to new EDGAR data which provide the growth rates for 2022.
- 3.A, CH4: 2021 and 2022 emissions have changed due to the new FAO and EDGAR data.
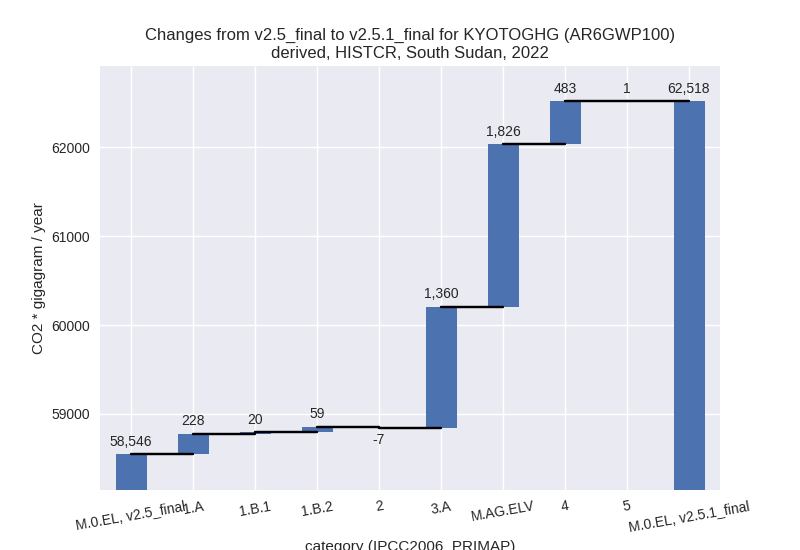
Changes by sector and gas
For each scenario and time frame the changes are displayed for all individual sectors and all individual gases. In the sector plot we use aggregate Kyoto GHGs in AR6GWP100. In the gas plot we usenational total emissions without LULUCF. ## country reported scenario
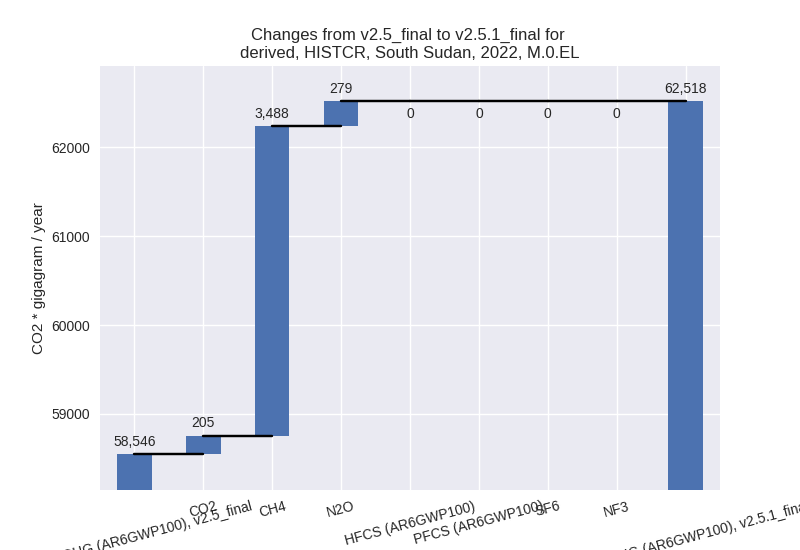
2022
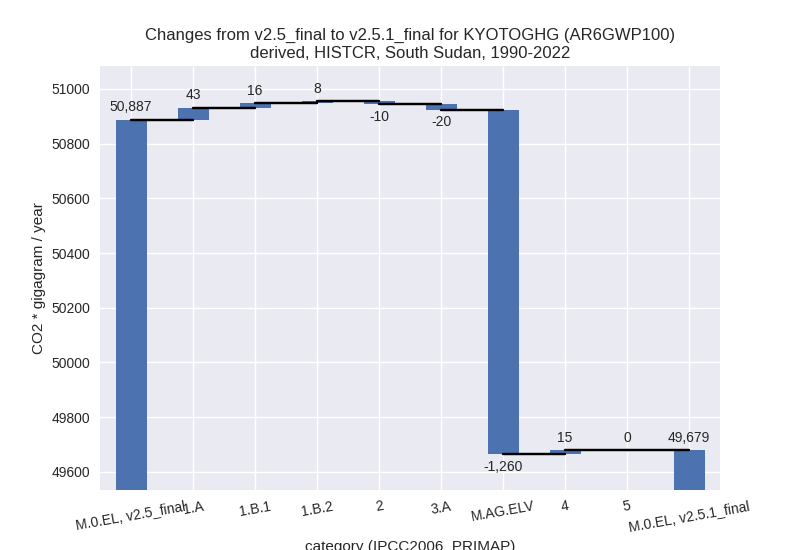
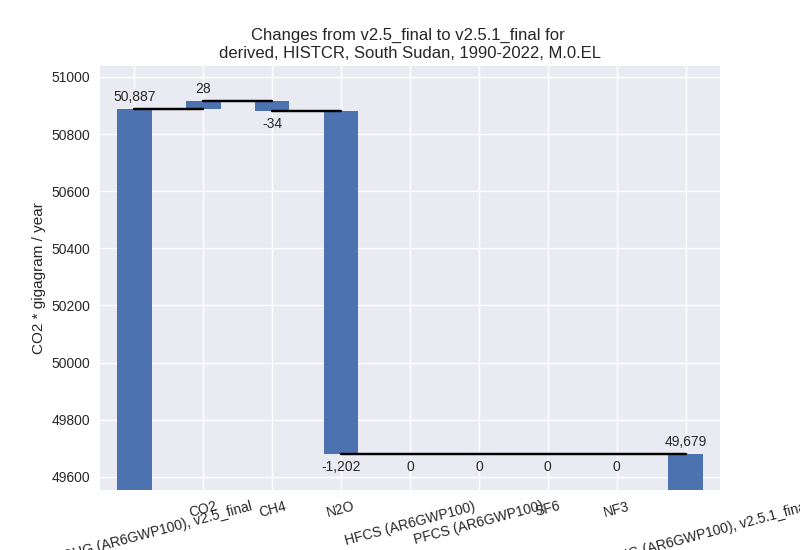
1990-2022
third party scenario
2022


1990-2022


Detailed changes for the scenarios:
country reported scenario (HISTCR):
Most important changes per time frame
For 2022 the following sector-gas combinations have the highest absolute impact on national total KyotoGHG (AR6GWP100) emissions in 2022 (top 5):
- 1: M.AG.ELV, CH4 with 1593.62 Gg CO2 / year (16.7%)
- 2: 3.A, CH4 with 1351.54 Gg CO2 / year (6.4%)
- 3: 4, CH4 with 479.24 Gg CO2 / year (17.1%)
- 4: 1.A, CO2 with 291.01 Gg CO2 / year (18.0%)
- 5: M.AG.ELV, N2O with 263.24 Gg CO2 / year (1.3%)
For 1990-2022 the following sector-gas combinations have the highest absolute impact on national total KyotoGHG (AR6GWP100) emissions in 1990-2022 (top 5):
- 1: M.AG.ELV, N2O with -1203.34 Gg CO2 / year (-6.3%)
- 2: M.AG.ELV, CH4 with -56.19 Gg CO2 / year (-0.5%)
- 3: 1.A, CO2 with 37.97 Gg CO2 / year (3.7%)
- 4: 3.A, CH4 with -19.43 Gg CO2 / year (-0.1%)
- 5: 1.B.1, CH4 with 16.12 Gg CO2 / year (1.5%)
Changes in the main sectors for aggregate KyotoGHG (AR6GWP100) are
- 1: Total sectoral emissions in 2022 are 4011.77 Gg
CO2 / year which is 6.4% of M.0.EL emissions. 2022 Emissions have
changed by 8.3% (307.60 Gg CO2 /
year). 1990-2022 Emissions have changed by 2.3% (67.66 Gg CO2 / year). For 2022 the
changes per gas
are:
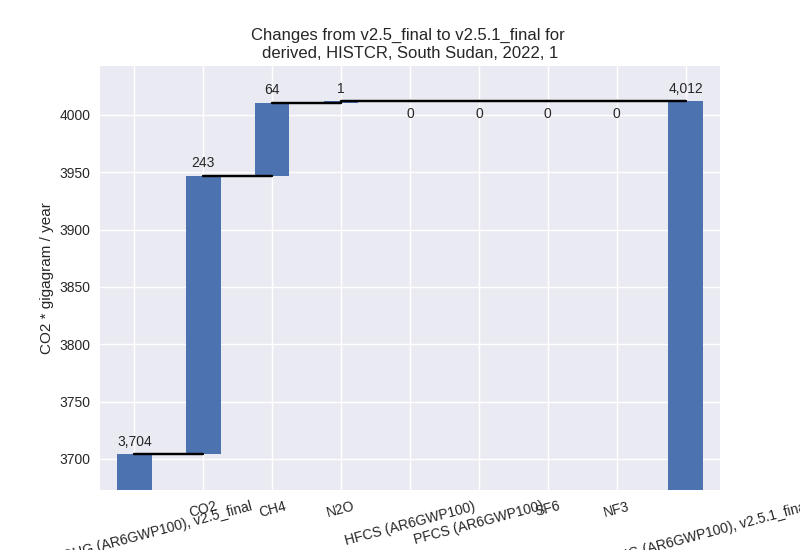
For 1990-2022 the changes per gas are: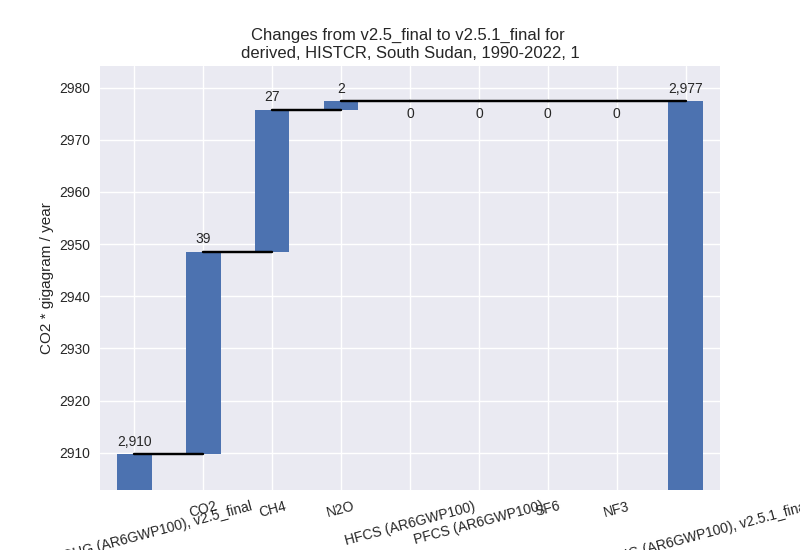
The changes come from the following subsectors:- 1.A: Total sectoral emissions in 2022 are 2421.45
Gg CO2 / year which is 60.4% of category 1 emissions. 2022 Emissions
have changed by 10.4% (228.27 Gg CO2
/ year). 1990-2022 Emissions have changed by 3.0% (43.28 Gg CO2 / year). For 2022 the
changes per gas
are:
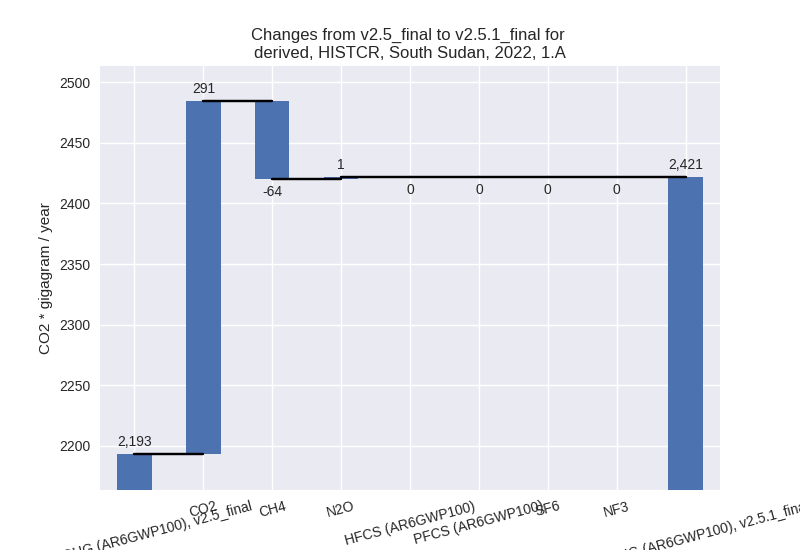
For 1990-2022 the changes per gas are:
There is no subsector information available in PRIMAP-hist. - 1.B.1: Total sectoral emissions in 2022 are 1196.56 Gg CO2 / year which is 29.8% of category 1 emissions. 2022 Emissions have changed by 1.7% (20.04 Gg CO2 / year). 1990-2022 Emissions have changed by 1.5% (16.34 Gg CO2 / year).
- 1.B.2: Total sectoral emissions in 2022 are 393.76
Gg CO2 / year which is 9.8% of category 1 emissions. 2022 Emissions have
changed by 17.7% (59.29 Gg CO2 /
year). 1990-2022 Emissions have changed by 2.2% (8.04 Gg CO2 / year). For 2022 the
changes per gas
are:
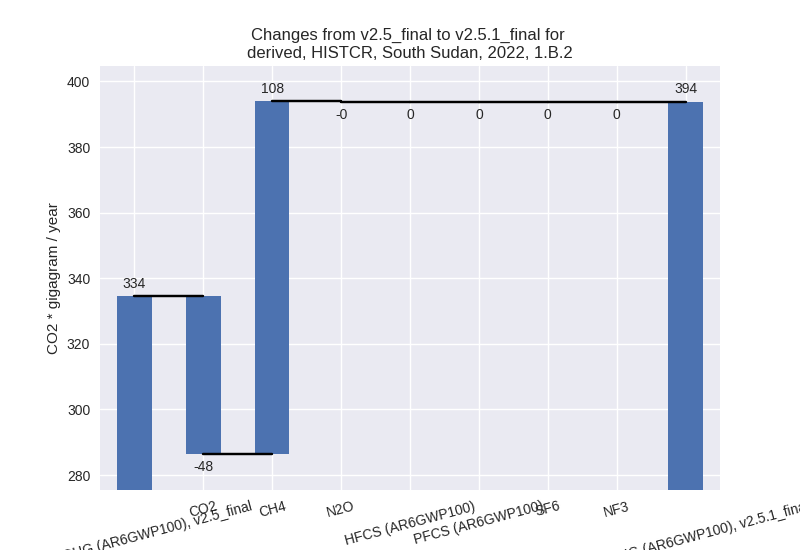
For 1990-2022 the changes per gas are: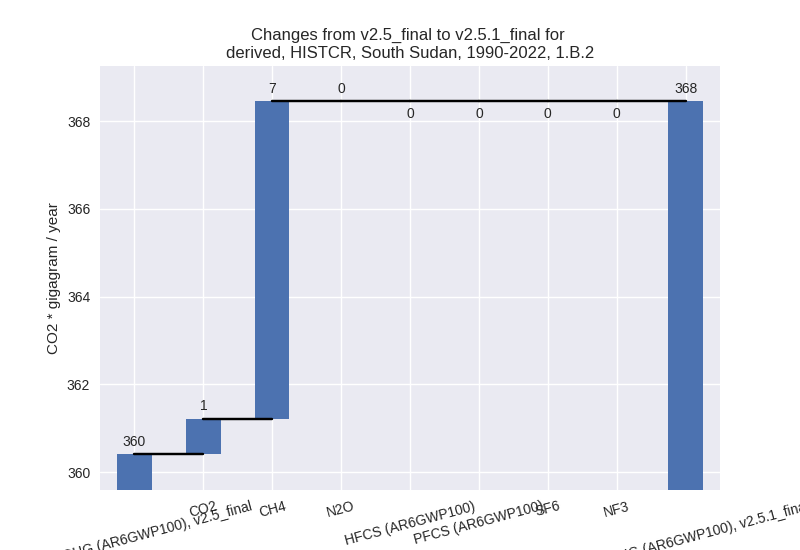
There is no subsector information available in PRIMAP-hist.
- 1.A: Total sectoral emissions in 2022 are 2421.45
Gg CO2 / year which is 60.4% of category 1 emissions. 2022 Emissions
have changed by 10.4% (228.27 Gg CO2
/ year). 1990-2022 Emissions have changed by 3.0% (43.28 Gg CO2 / year). For 2022 the
changes per gas
are:
- 2: Total sectoral emissions in 2022 are 479.10 Gg
CO2 / year which is 0.8% of M.0.EL emissions. 2022 Emissions have
changed by -1.4% (-7.02 Gg CO2 /
year). 1990-2022 Emissions have changed by -5.8% (-10.47 Gg CO2 / year). For
1990-2022 the changes per gas
are:

- M.AG: Total sectoral emissions in 2022 are 54452.66
Gg CO2 / year which is 87.1% of M.0.EL emissions. 2022 Emissions have
changed by 6.2% (3186.47 Gg CO2 /
year). 1990-2022 Emissions have changed by -2.8% (-1279.83 Gg CO2 / year). For 2022
the changes per gas
are:

For 1990-2022 the changes per gas are: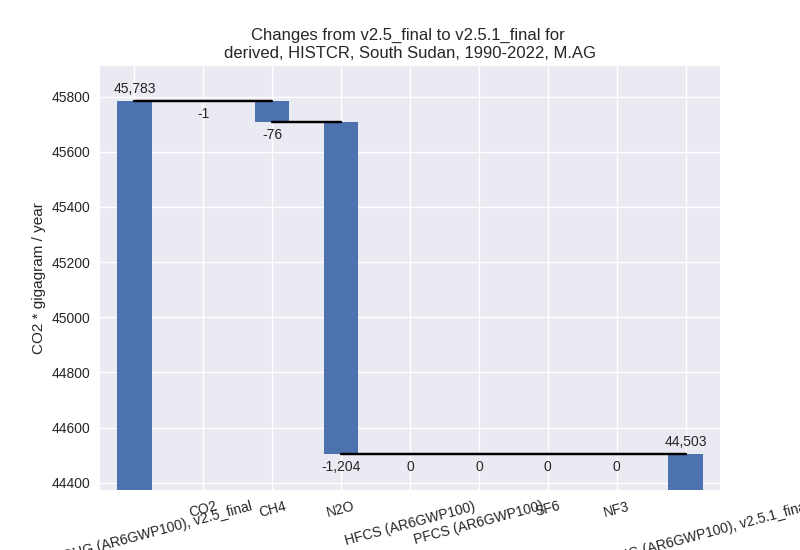
The changes come from the following subsectors:- 3.A: Total sectoral emissions in 2022 are 22518.88
Gg CO2 / year which is 41.4% of category M.AG emissions. 2022 Emissions
have changed by 6.4% (1360.17 Gg CO2
/ year). 1990-2022 Emissions have changed by -0.1% (-19.69 Gg CO2 / year). For 2022 the
changes per gas
are:

There is no subsector information available in PRIMAP-hist. - M.AG.ELV: Total sectoral emissions in 2022 are
31933.78 Gg CO2 / year which is 58.6% of category M.AG emissions. 2022
Emissions have changed by 6.1%
(1826.30 Gg CO2 / year). 1990-2022 Emissions have changed by -4.2% (-1260.13 Gg CO2 / year). For 2022
the changes per gas
are:
For 1990-2022 the changes per gas are:
There is no subsector information available in PRIMAP-hist.
- 3.A: Total sectoral emissions in 2022 are 22518.88
Gg CO2 / year which is 41.4% of category M.AG emissions. 2022 Emissions
have changed by 6.4% (1360.17 Gg CO2
/ year). 1990-2022 Emissions have changed by -0.1% (-19.69 Gg CO2 / year). For 2022 the
changes per gas
are:
- 4: Total sectoral emissions in 2022 are 3448.89 Gg
CO2 / year which is 5.5% of M.0.EL emissions. 2022 Emissions have
changed by 16.3% (483.47 Gg CO2 /
year). 1990-2022 Emissions have changed by 0.8% (14.65 Gg CO2 / year). For 2022 the
changes per gas
are:

- 5: Total sectoral emissions in 2022 are 125.57 Gg CO2 / year which is 0.2% of M.0.EL emissions. 2022 Emissions have changed by 1.2% (1.43 Gg CO2 / year). 1990-2022 Emissions have changed by 0.0% (0.04 Gg CO2 / year).
third party scenario (HISTTP):
Most important changes per time frame
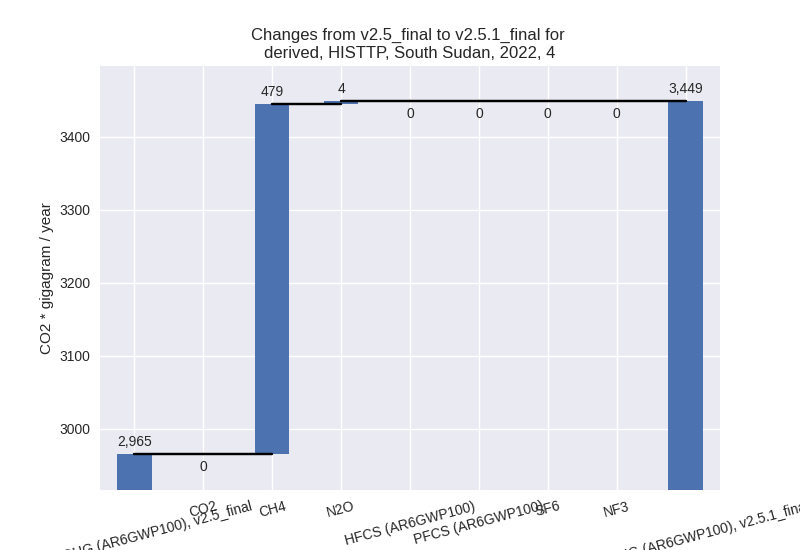
For 2022 the following sector-gas combinations have the highest absolute impact on national total KyotoGHG (AR6GWP100) emissions in 2022 (top 5):
- 1: M.AG.ELV, CH4 with 1593.62 Gg CO2 / year (16.7%)
- 2: 3.A, CH4 with 1351.54 Gg CO2 / year (6.4%)
- 3: 4, CH4 with 479.24 Gg CO2 / year (17.1%)
- 4: 1.A, CO2 with 291.01 Gg CO2 / year (18.0%)
- 5: M.AG.ELV, N2O with 263.24 Gg CO2 / year (1.3%)
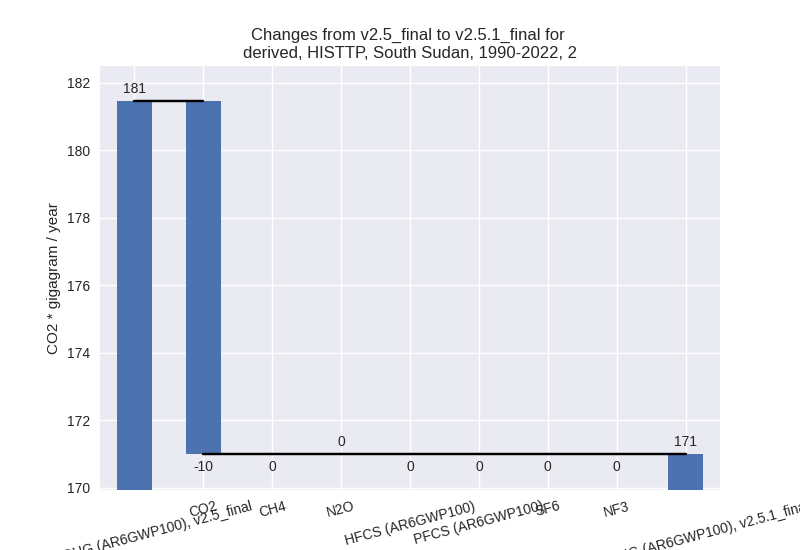
For 1990-2022 the following sector-gas combinations have the highest absolute impact on national total KyotoGHG (AR6GWP100) emissions in 1990-2022 (top 5):
- 1: M.AG.ELV, N2O with -1203.34 Gg CO2 / year (-6.3%)
- 2: M.AG.ELV, CH4 with -56.19 Gg CO2 / year (-0.5%)
- 3: 1.A, CO2 with 37.97 Gg CO2 / year (3.7%)
- 4: 3.A, CH4 with -19.43 Gg CO2 / year (-0.1%)
- 5: 1.B.1, CH4 with 16.12 Gg CO2 / year (1.5%)
Changes in the main sectors for aggregate KyotoGHG (AR6GWP100) are
- 1: Total sectoral emissions in 2022 are 4011.77 Gg
CO2 / year which is 6.4% of M.0.EL emissions. 2022 Emissions have
changed by 8.3% (307.60 Gg CO2 /
year). 1990-2022 Emissions have changed by 2.3% (67.66 Gg CO2 / year). For 2022 the
changes per gas
are:

For 1990-2022 the changes per gas are:
The changes come from the following subsectors:- 1.A: Total sectoral emissions in 2022 are 2421.45
Gg CO2 / year which is 60.4% of category 1 emissions. 2022 Emissions
have changed by 10.4% (228.27 Gg CO2
/ year). 1990-2022 Emissions have changed by 3.0% (43.28 Gg CO2 / year). For 2022 the
changes per gas
are:

For 1990-2022 the changes per gas are:
There is no subsector information available in PRIMAP-hist. - 1.B.1: Total sectoral emissions in 2022 are 1196.56 Gg CO2 / year which is 29.8% of category 1 emissions. 2022 Emissions have changed by 1.7% (20.04 Gg CO2 / year). 1990-2022 Emissions have changed by 1.5% (16.34 Gg CO2 / year).
- 1.B.2: Total sectoral emissions in 2022 are 393.76
Gg CO2 / year which is 9.8% of category 1 emissions. 2022 Emissions have
changed by 17.7% (59.29 Gg CO2 /
year). 1990-2022 Emissions have changed by 2.2% (8.04 Gg CO2 / year). For 2022 the
changes per gas
are:

For 1990-2022 the changes per gas are:
There is no subsector information available in PRIMAP-hist.
- 1.A: Total sectoral emissions in 2022 are 2421.45
Gg CO2 / year which is 60.4% of category 1 emissions. 2022 Emissions
have changed by 10.4% (228.27 Gg CO2
/ year). 1990-2022 Emissions have changed by 3.0% (43.28 Gg CO2 / year). For 2022 the
changes per gas
are:
- 2: Total sectoral emissions in 2022 are 479.10 Gg
CO2 / year which is 0.8% of M.0.EL emissions. 2022 Emissions have
changed by -1.4% (-7.02 Gg CO2 /
year). 1990-2022 Emissions have changed by -5.8% (-10.47 Gg CO2 / year). For
1990-2022 the changes per gas
are:
- M.AG: Total sectoral emissions in 2022 are 54452.66
Gg CO2 / year which is 87.1% of M.0.EL emissions. 2022 Emissions have
changed by 6.2% (3186.47 Gg CO2 /
year). 1990-2022 Emissions have changed by -2.8% (-1279.83 Gg CO2 / year). For 2022
the changes per gas
are:

For 1990-2022 the changes per gas are:
The changes come from the following subsectors:- 3.A: Total sectoral emissions in 2022 are 22518.88
Gg CO2 / year which is 41.4% of category M.AG emissions. 2022 Emissions
have changed by 6.4% (1360.17 Gg CO2
/ year). 1990-2022 Emissions have changed by -0.1% (-19.69 Gg CO2 / year). For 2022 the
changes per gas
are:

There is no subsector information available in PRIMAP-hist. - M.AG.ELV: Total sectoral emissions in 2022 are
31933.78 Gg CO2 / year which is 58.6% of category M.AG emissions. 2022
Emissions have changed by 6.1%
(1826.30 Gg CO2 / year). 1990-2022 Emissions have changed by -4.2% (-1260.13 Gg CO2 / year). For 2022
the changes per gas
are:

For 1990-2022 the changes per gas are:
There is no subsector information available in PRIMAP-hist.
- 3.A: Total sectoral emissions in 2022 are 22518.88
Gg CO2 / year which is 41.4% of category M.AG emissions. 2022 Emissions
have changed by 6.4% (1360.17 Gg CO2
/ year). 1990-2022 Emissions have changed by -0.1% (-19.69 Gg CO2 / year). For 2022 the
changes per gas
are:
- 4: Total sectoral emissions in 2022 are 3448.89 Gg
CO2 / year which is 5.5% of M.0.EL emissions. 2022 Emissions have
changed by 16.3% (483.47 Gg CO2 /
year). 1990-2022 Emissions have changed by 0.8% (14.65 Gg CO2 / year). For 2022 the
changes per gas
are:
- 5: Total sectoral emissions in 2022 are 125.57 Gg CO2 / year which is 0.2% of M.0.EL emissions. 2022 Emissions have changed by 1.2% (1.43 Gg CO2 / year). 1990-2022 Emissions have changed by 0.0% (0.04 Gg CO2 / year).