Changes in PRIMAP-hist v2.5.1_final compared to v2.5_final for Sao Tome and Principe
2024-02-29
Johannes Gütschow
Change analysis for Sao Tome and Principe for PRIMAP-hist v2.5.1_final compared to v2.5_final
Overview over emissions by sector and gas
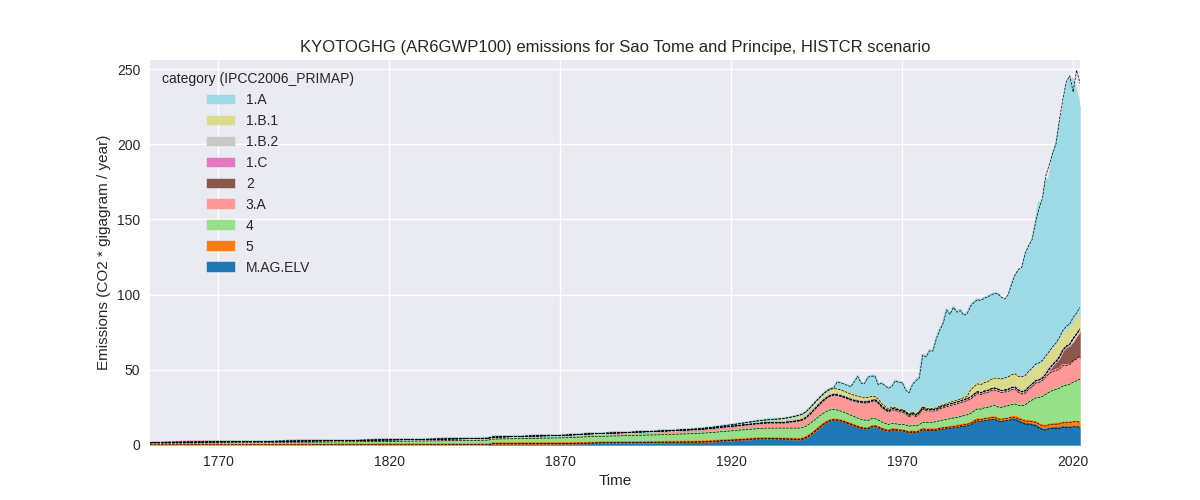
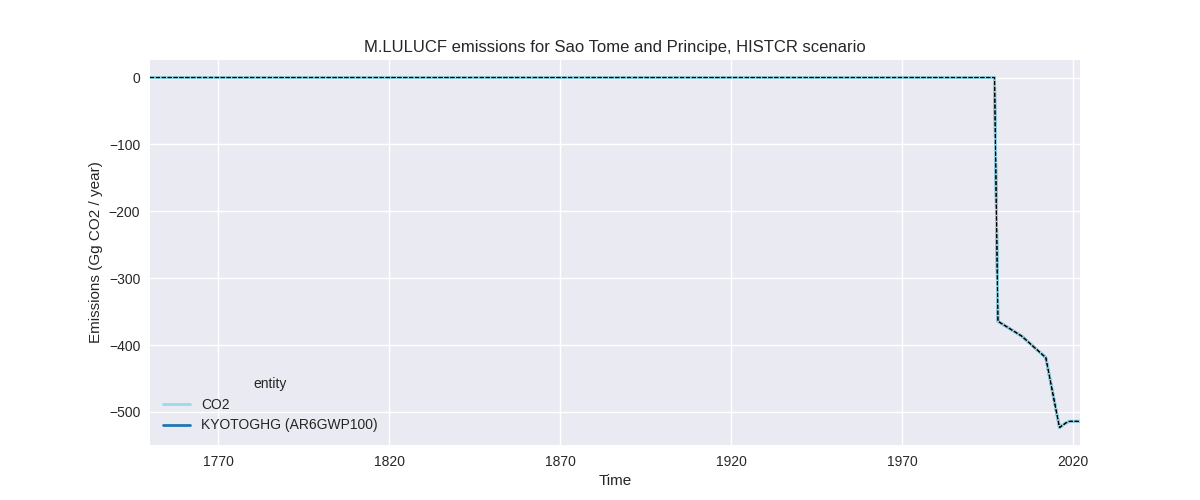
The following figures show the aggregate national total emissions excluding LULUCF AR6GWP100 for the country reported priority scenario. The dotted linesshow the v2.5_final data.

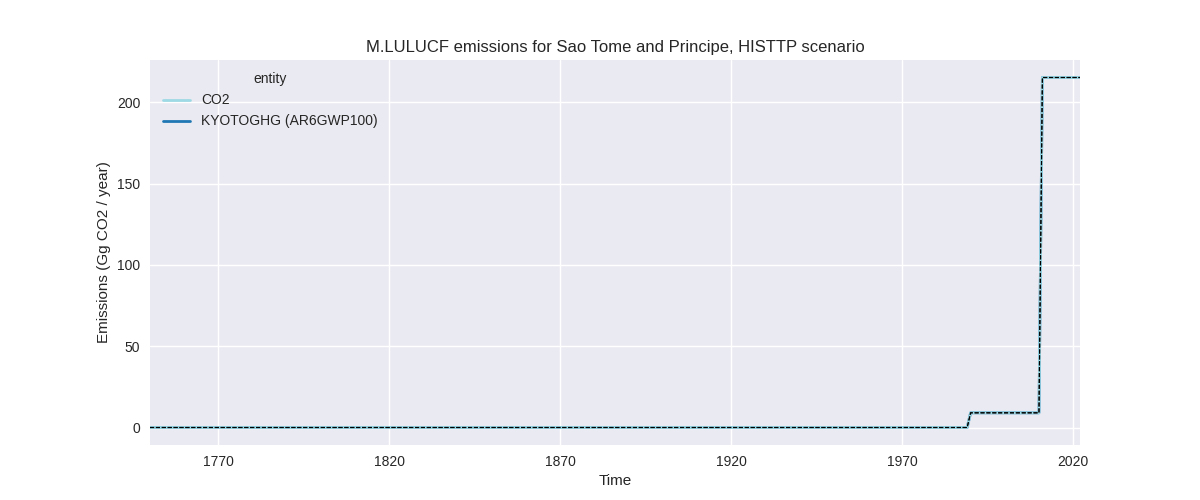
The following figures show the aggregate national total emissions excluding LULUCF AR6GWP100 for the third party priority scenario. The dotted linesshow the v2.5_final data.


Overview over changes
In the country reported priority scenario we have the following changes for aggregate Kyoto GHG and national total emissions excluding LULUCF (M.0.EL):
- Emissions in 2022 have changed by -6.4%% (-15.33 Gg CO2 / year)
- Emissions in 1990-2022 have changed by -1.1%% (-1.71 Gg CO2 / year)
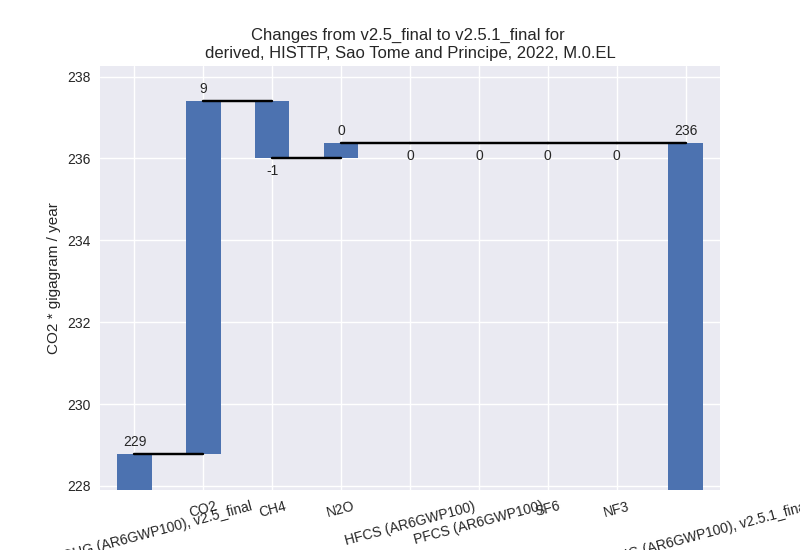
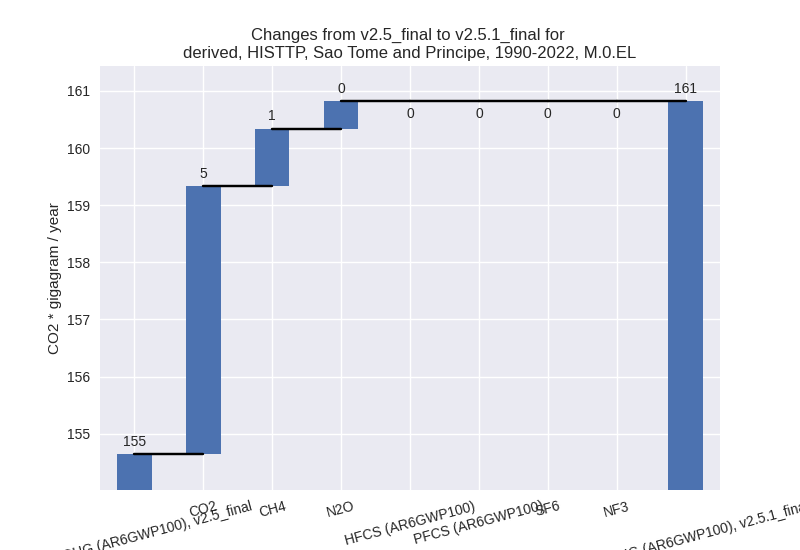
In the third party priority scenario we have the following changes for aggregate Kyoto GHG and national total emissions excluding LULUCF (M.0.EL):
- Emissions in 2022 have changed by 3.3%% (7.59 Gg CO2 / year)
- Emissions in 1990-2022 have changed by 4.0%% (6.18 Gg CO2 / year)
Most important changes per scenario and time frame
In the country reported priority scenario the following sector-gas combinations have the highest absolute impact on national total KyotoGHG (AR6GWP100) emissions in 2022 (top 5):
- 1: 1.A, CO2 with -10.09 Gg CO2 / year (-7.3%)
- 2: 1.B.1, CH4 with -3.35 Gg CO2 / year (-24.0%)
- 3: 4, CH4 with -1.72 Gg CO2 / year (-6.4%)
- 4: M.AG.ELV, N2O with 0.79 Gg CO2 / year (7.4%)
- 5: 1.B.2, CH4 with -0.42 Gg CO2 / year (-99.6%)
In the country reported priority scenario the following sector-gas combinations have the highest absolute impact on national total KyotoGHG (AR6GWP100) emissions in 1990-2022 (top 5):
- 1: 1.B.1, CH4 with -1.08 Gg CO2 / year (-11.3%)
- 2: 2, CO2 with -0.28 Gg CO2 / year (-33.1%)
- 3: 1.A, CO2 with -0.16 Gg CO2 / year (-0.2%)
- 4: 1.B.2, CH4 with -0.09 Gg CO2 / year (-98.6%)
- 5: 4, CH4 with -0.05 Gg CO2 / year (-0.4%)
In the third party priority scenario the following sector-gas combinations have the highest absolute impact on national total KyotoGHG (AR6GWP100) emissions in 2022 (top 5):
- 1: 1.A, CO2 with 8.87 Gg CO2 / year (8.2%)
- 2: 1.B.1, CH4 with -3.35 Gg CO2 / year (-24.0%)
- 3: 1.A, CH4 with 2.23 Gg CO2 / year (15.0%)
- 4: M.AG.ELV, N2O with 0.50 Gg CO2 / year (7.2%)
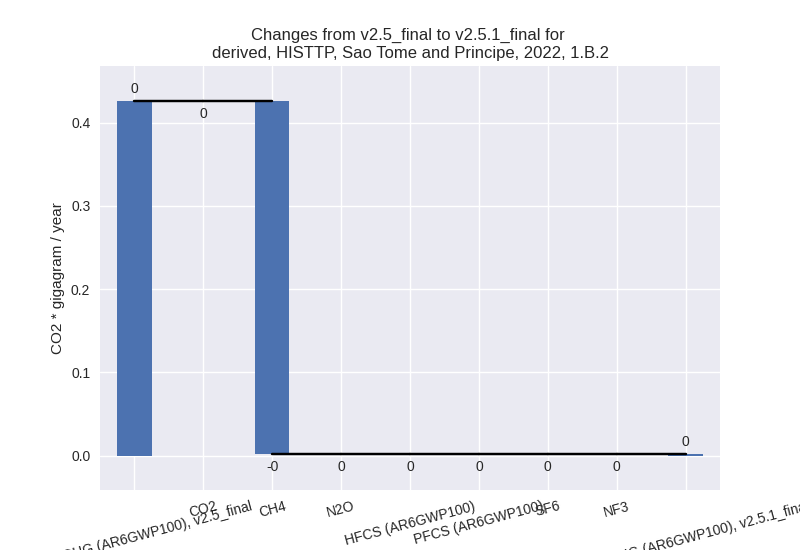
- 5: 1.B.2, CH4 with -0.42 Gg CO2 / year (-99.6%)
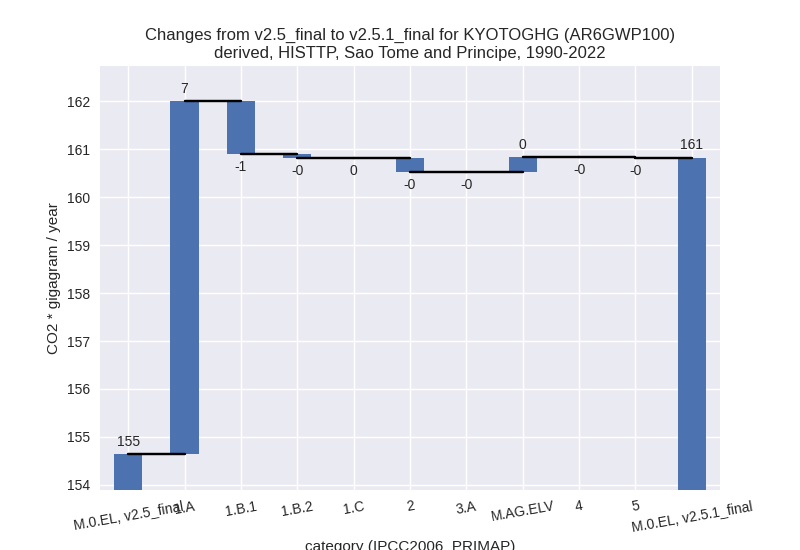
In the third party priority scenario the following sector-gas combinations have the highest absolute impact on national total KyotoGHG (AR6GWP100) emissions in 1990-2022 (top 5):
- 1: 1.A, CO2 with 4.97 Gg CO2 / year (6.1%)
- 2: 1.A, CH4 with 2.18 Gg CO2 / year (19.4%)
- 3: 1.B.1, CH4 with -1.08 Gg CO2 / year (-11.3%)
- 4: M.AG.ELV, N2O with 0.31 Gg CO2 / year (6.2%)
- 5: 2, CO2 with -0.28 Gg CO2 / year (-33.1%)
Notes on data changes
Here we list notes explaining important emissions changes for the country. ’' means that the following text only applies to the TP time series, while means that it only applies to the CR scenario. Otherwise the note applies to both scenarios.
- 1.A, CO2: Updated CDIAC data show higher emissions than the CDIAC data used in PRIMAP-hist v2.5. The steep decline in emissions in the EI dataset (2021 and 2022) leads to lower emissions in 2022.
- 1.B.1, CH4: EDGAR 8.0 data are lower than EDGAR 7.0 after year 2000.
- 1.A, CH4: EDGAR 8.0 data are higher than EDGAR 7.0
Changes by sector and gas
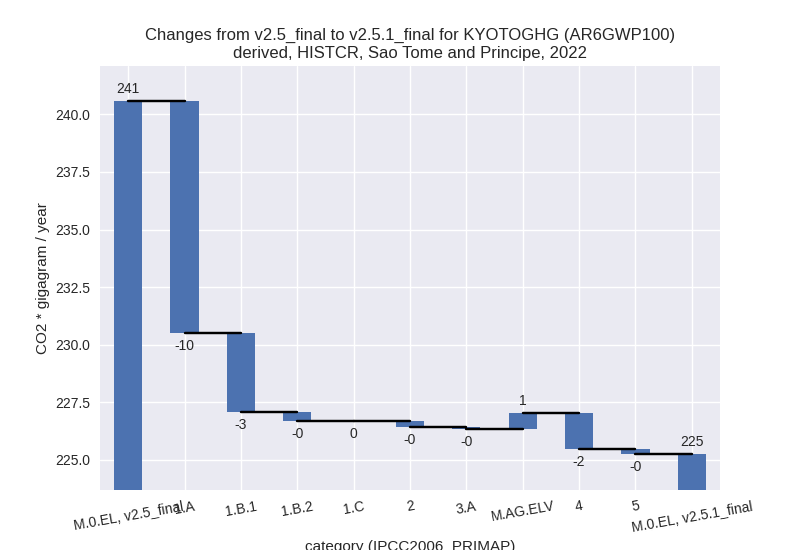
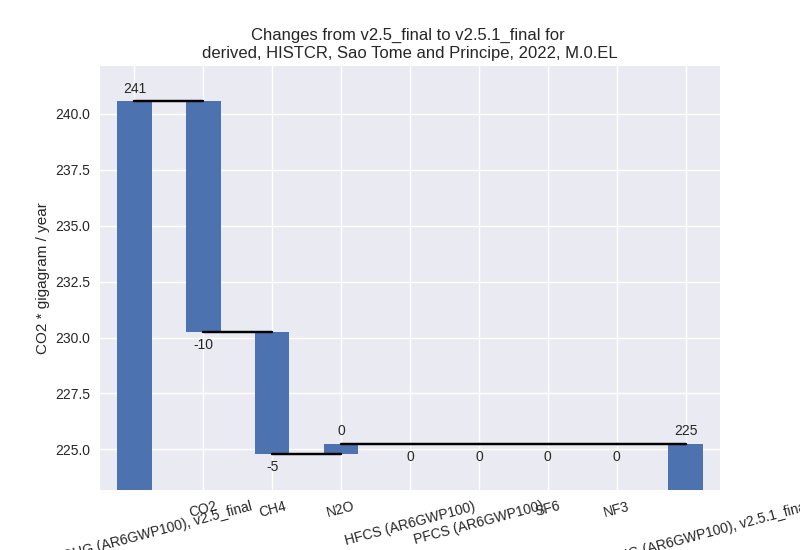
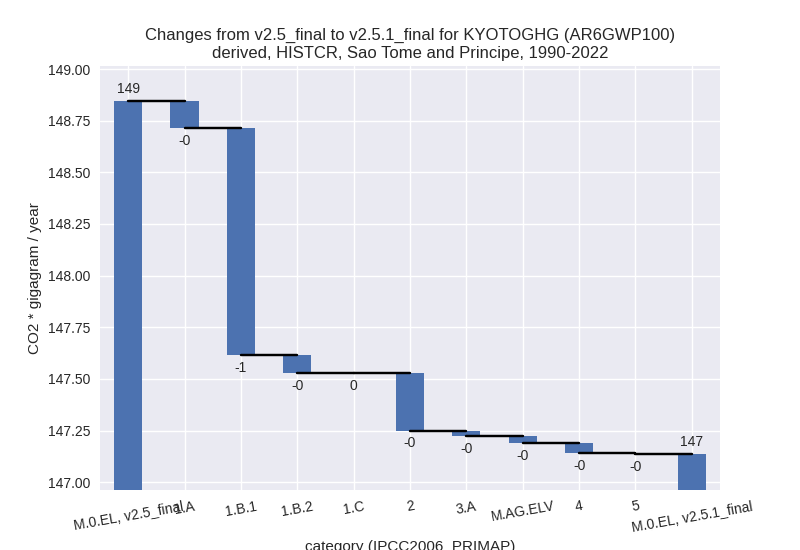
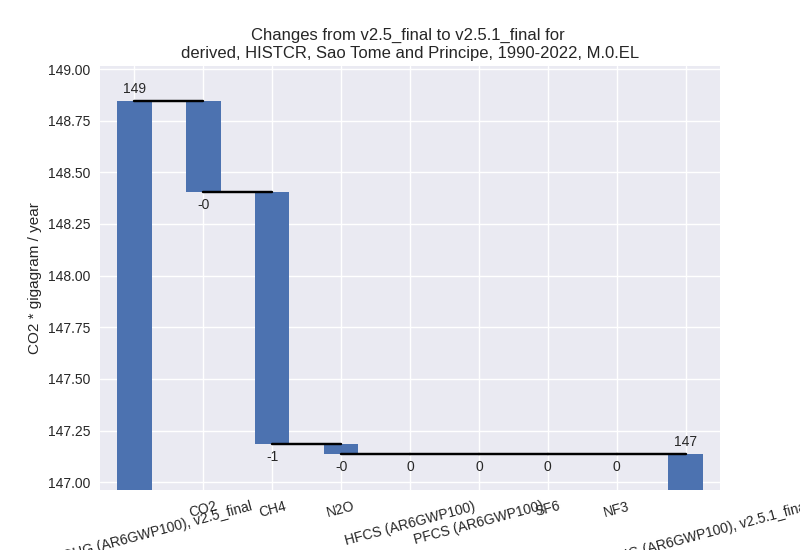
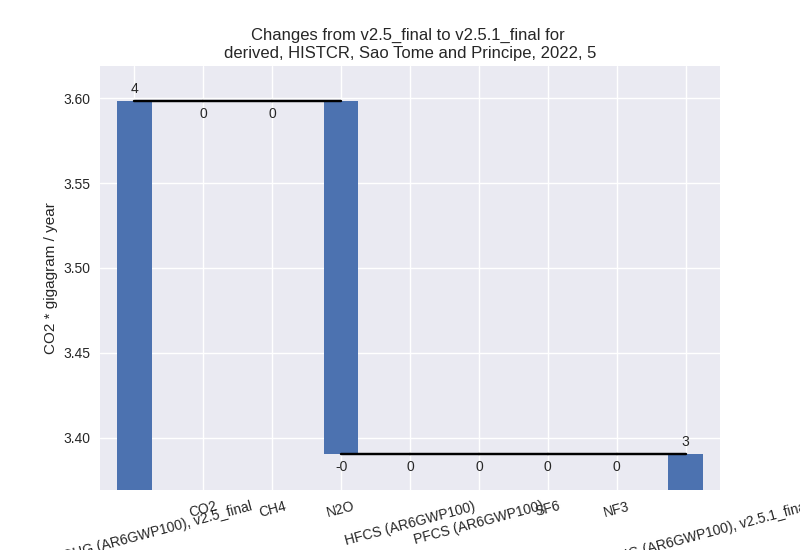
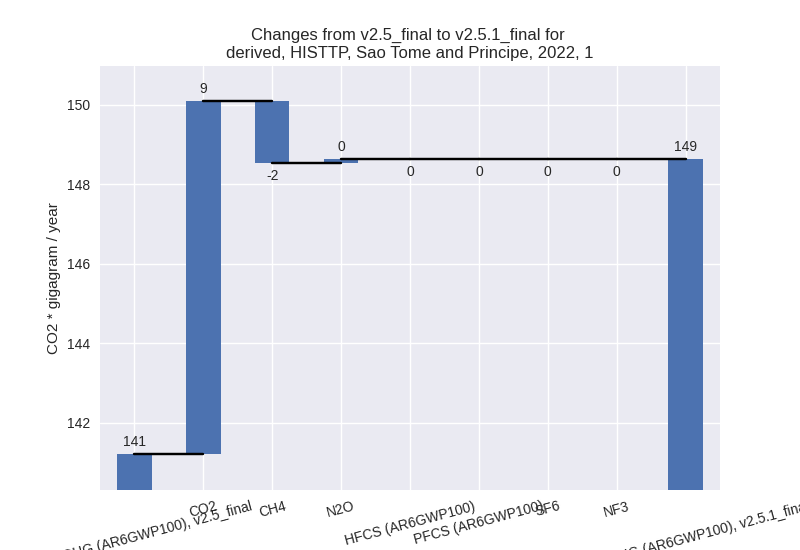
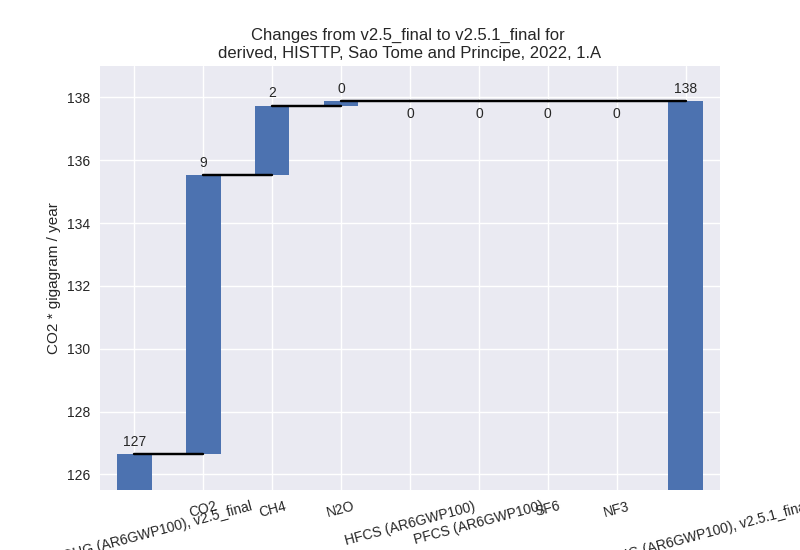
For each scenario and time frame the changes are displayed for all individual sectors and all individual gases. In the sector plot we use aggregate Kyoto GHGs in AR6GWP100. In the gas plot we usenational total emissions without LULUCF. ## country reported scenario
2022
1990-2022
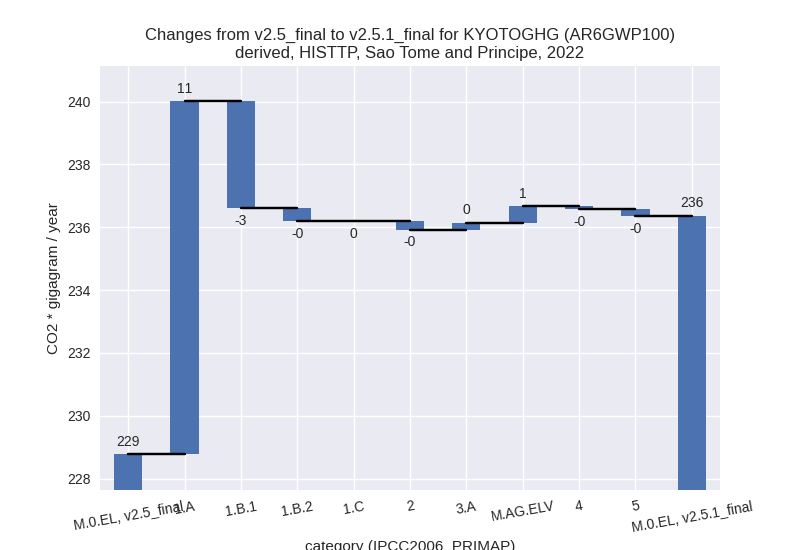
third party scenario
2022
1990-2022
Detailed changes for the scenarios:
country reported scenario (HISTCR):
Most important changes per time frame
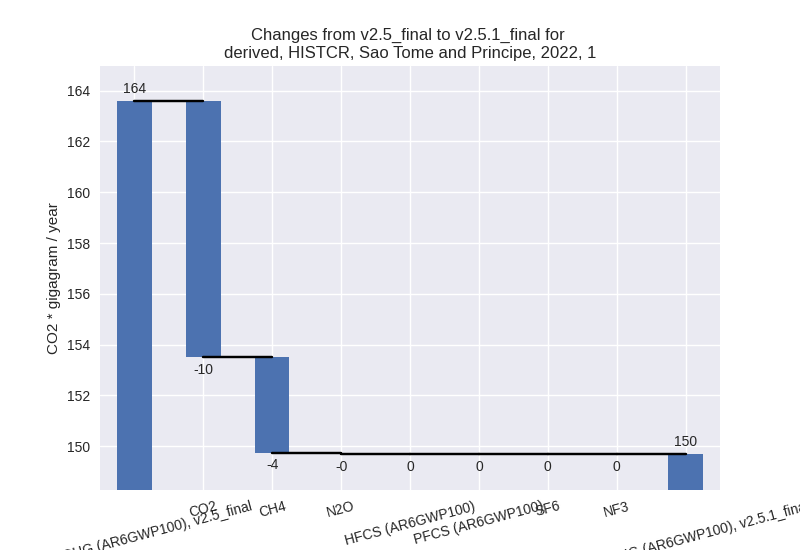
For 2022 the following sector-gas combinations have the highest absolute impact on national total KyotoGHG (AR6GWP100) emissions in 2022 (top 5):
- 1: 1.A, CO2 with -10.09 Gg CO2 / year (-7.3%)
- 2: 1.B.1, CH4 with -3.35 Gg CO2 / year (-24.0%)
- 3: 4, CH4 with -1.72 Gg CO2 / year (-6.4%)
- 4: M.AG.ELV, N2O with 0.79 Gg CO2 / year (7.4%)
- 5: 1.B.2, CH4 with -0.42 Gg CO2 / year (-99.6%)
For 1990-2022 the following sector-gas combinations have the highest absolute impact on national total KyotoGHG (AR6GWP100) emissions in 1990-2022 (top 5):
- 1: 1.B.1, CH4 with -1.08 Gg CO2 / year (-11.3%)
- 2: 2, CO2 with -0.28 Gg CO2 / year (-33.1%)
- 3: 1.A, CO2 with -0.16 Gg CO2 / year (-0.2%)
- 4: 1.B.2, CH4 with -0.09 Gg CO2 / year (-98.6%)
- 5: 4, CH4 with -0.05 Gg CO2 / year (-0.4%)
Changes in the main sectors for aggregate KyotoGHG (AR6GWP100) are
- 1: Total sectoral emissions in 2022 are 149.68 Gg
CO2 / year which is 66.5% of M.0.EL emissions. 2022 Emissions have
changed by -8.5% (-13.90 Gg CO2 /
year). 1990-2022 Emissions have changed by -1.3% (-1.32 Gg CO2 / year). For 2022 the
changes per gas
are:
The changes come from the following subsectors:- 1.A: Total sectoral emissions in 2022 are 138.93 Gg
CO2 / year which is 92.8% of category 1 emissions. 2022 Emissions have
changed by -6.8% (-10.08 Gg CO2 /
year). 1990-2022 Emissions have changed by -0.1% (-0.13 Gg CO2 / year). For 2022 the
changes per gas
are:

There is no subsector information available in PRIMAP-hist. - 1.B.1: Total sectoral emissions in 2022 are 10.75
Gg CO2 / year which is 7.2% of category 1 emissions. 2022 Emissions have
changed by -24.0% (-3.40 Gg CO2 /
year). 1990-2022 Emissions have changed by -11.3% (-1.10 Gg CO2 / year). For 2022 the
changes per gas
are:
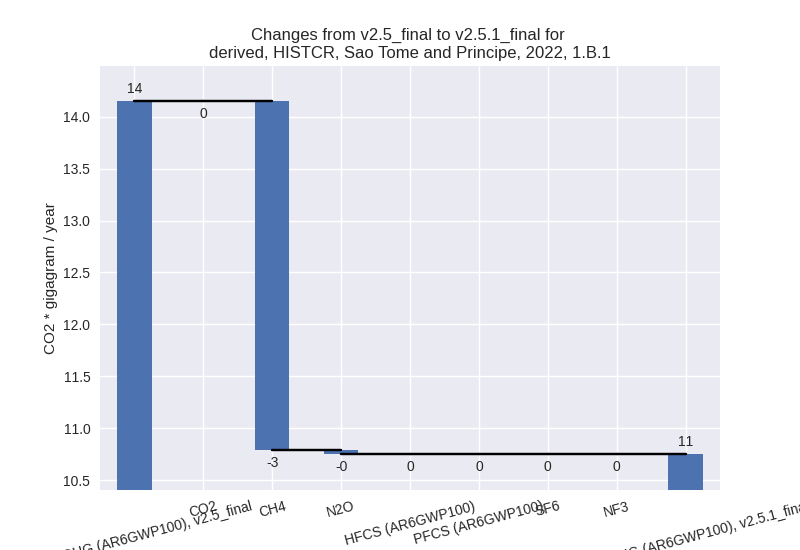
For 1990-2022 the changes per gas are:
There is no subsector information available in PRIMAP-hist. - 1.B.2: Total sectoral emissions in 2022 are 0.00 Gg
CO2 / year which is 0.0% of category 1 emissions. 2022 Emissions have
changed by -99.6% (-0.42 Gg CO2 /
year). 1990-2022 Emissions have changed by -98.6% (-0.09 Gg CO2 / year). For 2022 the
changes per gas
are:

For 1990-2022 the changes per gas are: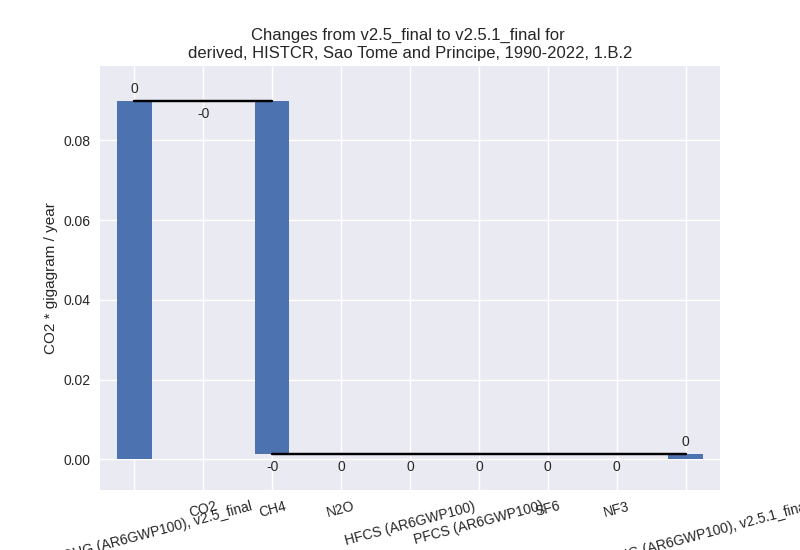
There is no subsector information available in PRIMAP-hist.
- 1.A: Total sectoral emissions in 2022 are 138.93 Gg
CO2 / year which is 92.8% of category 1 emissions. 2022 Emissions have
changed by -6.8% (-10.08 Gg CO2 /
year). 1990-2022 Emissions have changed by -0.1% (-0.13 Gg CO2 / year). For 2022 the
changes per gas
are:
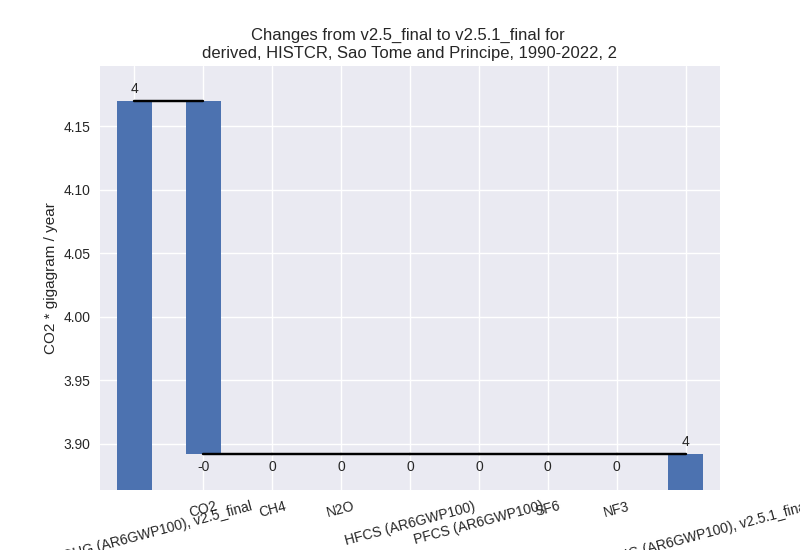
- 2: Total sectoral emissions in 2022 are 17.76 Gg
CO2 / year which is 7.9% of M.0.EL emissions. 2022 Emissions have
changed by -1.4% (-0.26 Gg CO2 /
year). 1990-2022 Emissions have changed by -6.7% (-0.28 Gg CO2 / year). For 1990-2022
the changes per gas
are:
- M.AG: Total sectoral emissions in 2022 are 26.91 Gg
CO2 / year which is 11.9% of M.0.EL emissions. 2022 Emissions have
changed by 2.4% (0.62 Gg CO2 /
year). 1990-2022 Emissions have changed by -0.2% (-0.06 Gg CO2 / year). For 2022 the
changes per gas
are:

The changes come from the following subsectors:- 3.A: Total sectoral emissions in 2022 are 15.08 Gg CO2 / year which is 56.0% of category M.AG emissions. 2022 Emissions have changed by -0.4% (-0.06 Gg CO2 / year). 1990-2022 Emissions have changed by -0.3% (-0.03 Gg CO2 / year).
- M.AG.ELV: Total sectoral emissions in 2022 are
11.83 Gg CO2 / year which is 44.0% of category M.AG emissions. 2022
Emissions have changed by 6.1% (0.68
Gg CO2 / year). 1990-2022 Emissions have changed by -0.2% (-0.03 Gg CO2 / year). For 2022 the
changes per gas
are:

There is no subsector information available in PRIMAP-hist.
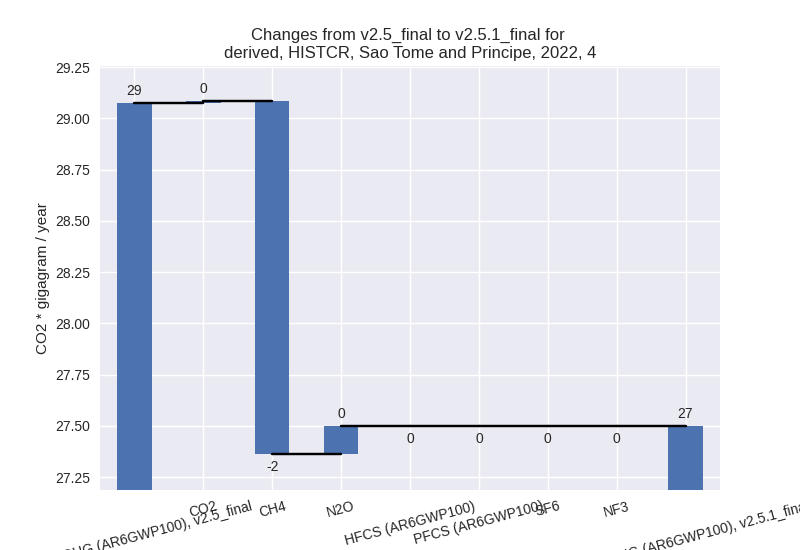
- 4: Total sectoral emissions in 2022 are 27.50 Gg
CO2 / year which is 12.2% of M.0.EL emissions. 2022 Emissions have
changed by -5.4% (-1.58 Gg CO2 /
year). 1990-2022 Emissions have changed by -0.3% (-0.05 Gg CO2 / year). For 2022 the
changes per gas
are:
- 5: Total sectoral emissions in 2022 are 3.39 Gg CO2
/ year which is 1.5% of M.0.EL emissions. 2022 Emissions have changed by
-5.8% (-0.21 Gg CO2 / year).
1990-2022 Emissions have changed by -0.3% (-0.01 Gg CO2 / year). For 2022 the
changes per gas
are:
third party scenario (HISTTP):
Most important changes per time frame
For 2022 the following sector-gas combinations have the highest absolute impact on national total KyotoGHG (AR6GWP100) emissions in 2022 (top 5):
- 1: 1.A, CO2 with 8.87 Gg CO2 / year (8.2%)
- 2: 1.B.1, CH4 with -3.35 Gg CO2 / year (-24.0%)
- 3: 1.A, CH4 with 2.23 Gg CO2 / year (15.0%)
- 4: M.AG.ELV, N2O with 0.50 Gg CO2 / year (7.2%)
- 5: 1.B.2, CH4 with -0.42 Gg CO2 / year (-99.6%)
For 1990-2022 the following sector-gas combinations have the highest absolute impact on national total KyotoGHG (AR6GWP100) emissions in 1990-2022 (top 5):
- 1: 1.A, CO2 with 4.97 Gg CO2 / year (6.1%)
- 2: 1.A, CH4 with 2.18 Gg CO2 / year (19.4%)
- 3: 1.B.1, CH4 with -1.08 Gg CO2 / year (-11.3%)
- 4: M.AG.ELV, N2O with 0.31 Gg CO2 / year (6.2%)
- 5: 2, CO2 with -0.28 Gg CO2 / year (-33.1%)
Changes in the main sectors for aggregate KyotoGHG (AR6GWP100) are
- 1: Total sectoral emissions in 2022 are 148.63 Gg
CO2 / year which is 62.9% of M.0.EL emissions. 2022 Emissions have
changed by 5.2% (7.41 Gg CO2 /
year). 1990-2022 Emissions have changed by 5.9% (6.17 Gg CO2 / year). For 2022 the
changes per gas
are:
For 1990-2022 the changes per gas are: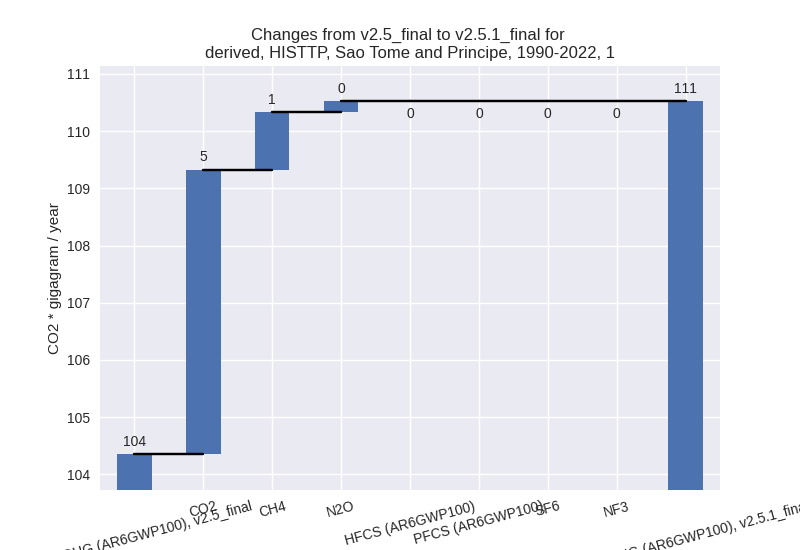
The changes come from the following subsectors:- 1.A: Total sectoral emissions in 2022 are 137.88 Gg
CO2 / year which is 92.8% of category 1 emissions. 2022 Emissions have
changed by 8.9% (11.24 Gg CO2 /
year). 1990-2022 Emissions have changed by 7.8% (7.35 Gg CO2 / year). For 2022 the
changes per gas
are:
For 1990-2022 the changes per gas are: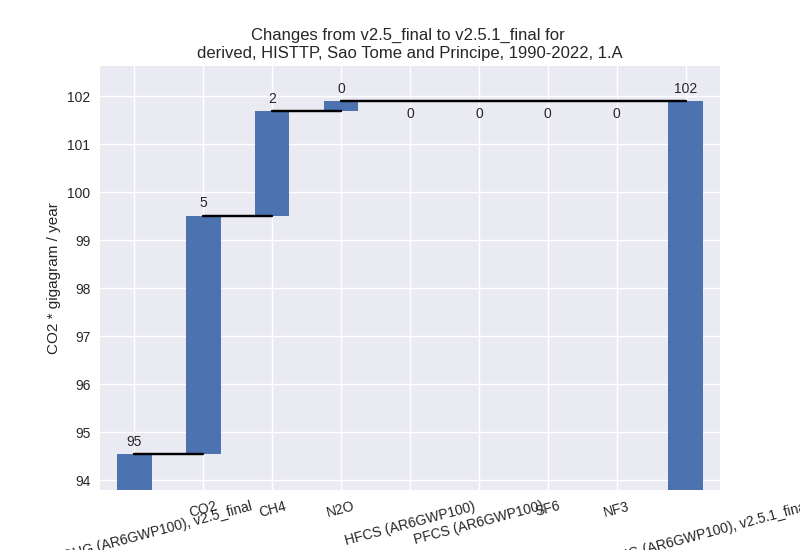
There is no subsector information available in PRIMAP-hist. - 1.B.1: Total sectoral emissions in 2022 are 10.75
Gg CO2 / year which is 7.2% of category 1 emissions. 2022 Emissions have
changed by -24.0% (-3.40 Gg CO2 /
year). 1990-2022 Emissions have changed by -11.3% (-1.10 Gg CO2 / year). For 2022 the
changes per gas
are:

For 1990-2022 the changes per gas are:
There is no subsector information available in PRIMAP-hist. - 1.B.2: Total sectoral emissions in 2022 are 0.00 Gg
CO2 / year which is 0.0% of category 1 emissions. 2022 Emissions have
changed by -99.6% (-0.42 Gg CO2 /
year). 1990-2022 Emissions have changed by -98.6% (-0.09 Gg CO2 / year). For 2022 the
changes per gas
are:
For 1990-2022 the changes per gas are:
There is no subsector information available in PRIMAP-hist.
- 1.A: Total sectoral emissions in 2022 are 137.88 Gg
CO2 / year which is 92.8% of category 1 emissions. 2022 Emissions have
changed by 8.9% (11.24 Gg CO2 /
year). 1990-2022 Emissions have changed by 7.8% (7.35 Gg CO2 / year). For 2022 the
changes per gas
are:
- 2: Total sectoral emissions in 2022 are 17.76 Gg
CO2 / year which is 7.5% of M.0.EL emissions. 2022 Emissions have
changed by -1.4% (-0.26 Gg CO2 /
year). 1990-2022 Emissions have changed by -6.7% (-0.28 Gg CO2 / year). For 1990-2022
the changes per gas
are:

- M.AG: Total sectoral emissions in 2022 are 18.78 Gg
CO2 / year which is 7.9% of M.0.EL emissions. 2022 Emissions have
changed by 4.1% (0.73 Gg CO2 /
year). 1990-2022 Emissions have changed by 2.4% (0.30 Gg CO2 / year). For 2022 the
changes per gas
are:
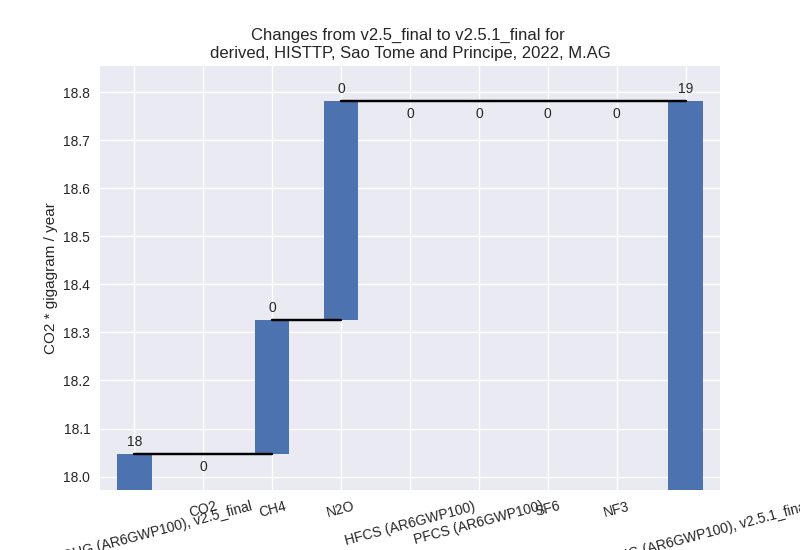
For 1990-2022 the changes per gas are:
The changes come from the following subsectors:- 3.A: Total sectoral emissions in 2022 are 11.39 Gg CO2 / year which is 60.6% of category M.AG emissions. 2022 Emissions have changed by 2.0% (0.22 Gg CO2 / year). 1990-2022 Emissions have changed by -0.2% (-0.02 Gg CO2 / year).
- M.AG.ELV: Total sectoral emissions in 2022 are 7.39
Gg CO2 / year which is 39.4% of category M.AG emissions. 2022 Emissions
have changed by 7.4% (0.51 Gg CO2 /
year). 1990-2022 Emissions have changed by 6.1% (0.31 Gg CO2 / year). For 2022 the
changes per gas
are:
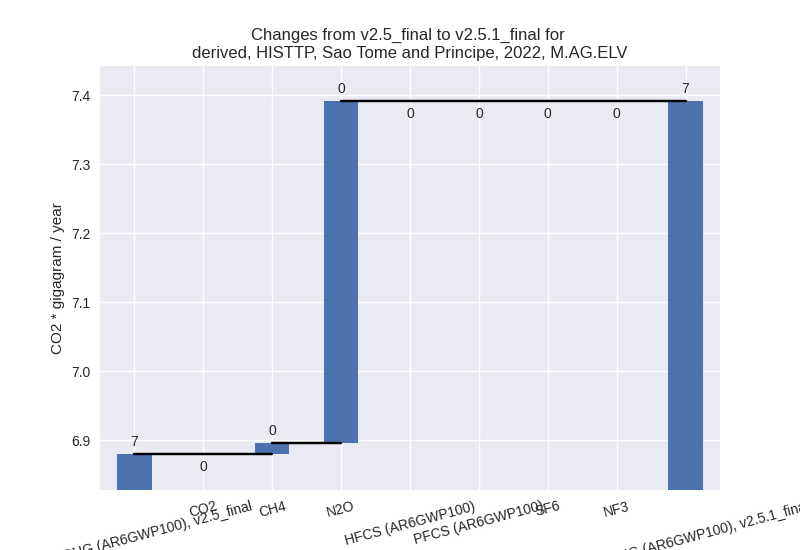
For 1990-2022 the changes per gas are: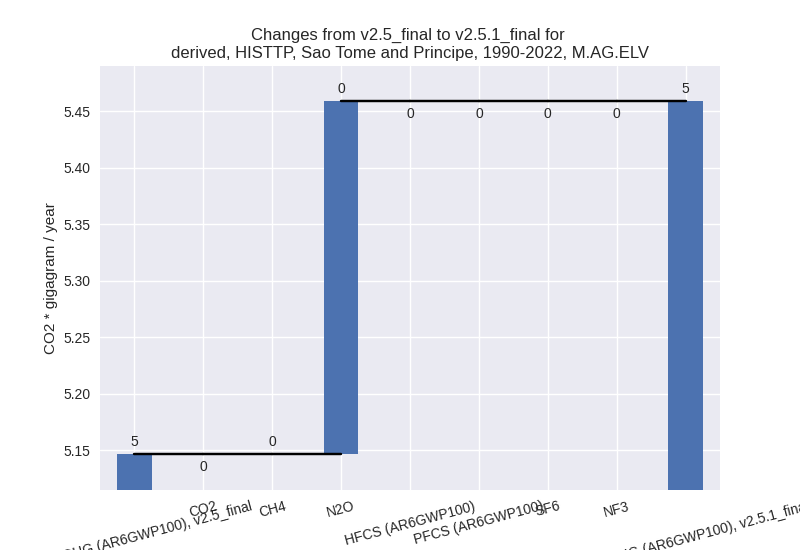
There is no subsector information available in PRIMAP-hist.
- 4: Total sectoral emissions in 2022 are 47.80 Gg CO2 / year which is 20.2% of M.0.EL emissions. 2022 Emissions have changed by -0.2% (-0.09 Gg CO2 / year). 1990-2022 Emissions have changed by -0.0% (-0.00 Gg CO2 / year).
- 5: Total sectoral emissions in 2022 are 3.39 Gg CO2
/ year which is 1.4% of M.0.EL emissions. 2022 Emissions have changed by
-5.8% (-0.21 Gg CO2 / year).
1990-2022 Emissions have changed by -0.3% (-0.01 Gg CO2 / year). For 2022 the
changes per gas
are:
