Changes in PRIMAP-hist v2.5.1_final compared to v2.5_final for Suriname
2024-02-29
Johannes Gütschow
Change analysis for Suriname for PRIMAP-hist v2.5.1_final compared to v2.5_final
Overview over emissions by sector and gas
The following figures show the aggregate national total emissions excluding LULUCF AR6GWP100 for the country reported priority scenario. The dotted linesshow the v2.5_final data.


The following figures show the aggregate national total emissions excluding LULUCF AR6GWP100 for the third party priority scenario. The dotted linesshow the v2.5_final data.

Overview over changes
In the country reported priority scenario we have the following changes for aggregate Kyoto GHG and national total emissions excluding LULUCF (M.0.EL):
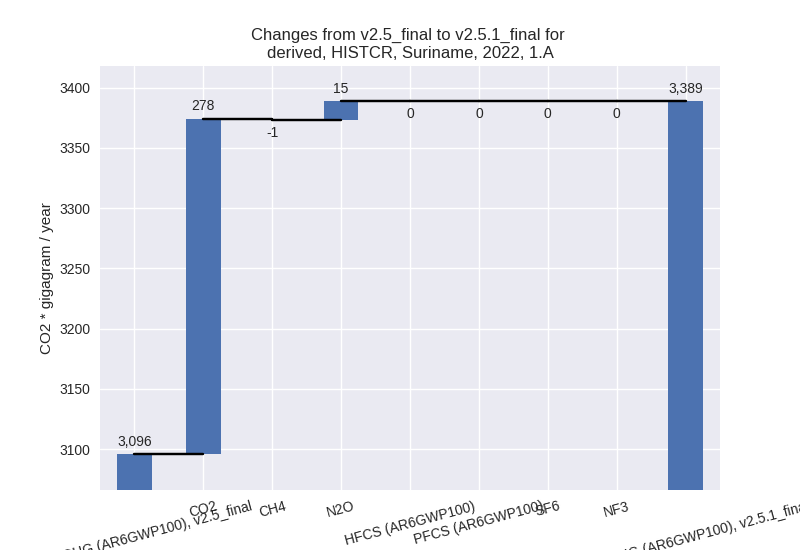
- Emissions in 2022 have changed by 4.5%% (199.22 Gg CO2 / year)
- Emissions in 1990-2022 have changed by 0.2%% (6.39 Gg CO2 / year)
In the third party priority scenario we have the following changes for aggregate Kyoto GHG and national total emissions excluding LULUCF (M.0.EL):
- Emissions in 2022 have changed by 4.5%% (199.22 Gg CO2 / year)
- Emissions in 1990-2022 have changed by 0.2%% (6.39 Gg CO2 / year)
Most important changes per scenario and time frame
In the country reported priority scenario the following sector-gas combinations have the highest absolute impact on national total KyotoGHG (AR6GWP100) emissions in 2022 (top 5):
- 1: 1.A, CO2 with 278.30 Gg CO2 / year (9.2%)
- 2: M.AG.ELV, N2O with -63.43 Gg CO2 / year (-31.6%)
- 3: M.AG.ELV, CH4 with -60.92 Gg CO2 / year (-11.8%)
- 4: 1.B.1, CH4 with 34.14 Gg CO2 / year (157.3%)
- 5: 1.A, N2O with 15.39 Gg CO2 / year (30.3%)
In the country reported priority scenario the following sector-gas combinations have the highest absolute impact on national total KyotoGHG (AR6GWP100) emissions in 1990-2022 (top 5):
- 1: 1.A, CO2 with 54.86 Gg CO2 / year (2.5%)
- 2: M.AG.ELV, N2O with -50.76 Gg CO2 / year (-28.1%)
- 3: 1.B.1, CH4 with 20.21 Gg CO2 / year (132.1%)
- 4: 1.B.2, CH4 with -8.88 Gg CO2 / year (-7.7%)
- 5: M.AG.ELV, CH4 with -3.59 Gg CO2 / year (-0.8%)
In the third party priority scenario the following sector-gas combinations have the highest absolute impact on national total KyotoGHG (AR6GWP100) emissions in 2022 (top 5):
- 1: 1.A, CO2 with 278.30 Gg CO2 / year (9.2%)
- 2: M.AG.ELV, N2O with -63.43 Gg CO2 / year (-31.6%)
- 3: M.AG.ELV, CH4 with -60.92 Gg CO2 / year (-11.8%)
- 4: 1.B.1, CH4 with 34.14 Gg CO2 / year (157.3%)
- 5: 1.A, N2O with 15.39 Gg CO2 / year (30.3%)
In the third party priority scenario the following sector-gas combinations have the highest absolute impact on national total KyotoGHG (AR6GWP100) emissions in 1990-2022 (top 5):
- 1: 1.A, CO2 with 54.86 Gg CO2 / year (2.5%)
- 2: M.AG.ELV, N2O with -50.76 Gg CO2 / year (-28.1%)
- 3: 1.B.1, CH4 with 20.21 Gg CO2 / year (132.1%)
- 4: 1.B.2, CH4 with -8.88 Gg CO2 / year (-7.7%)
- 5: M.AG.ELV, CH4 with -3.59 Gg CO2 / year (-0.8%)
Notes on data changes
No country specific notes present for this changelog.
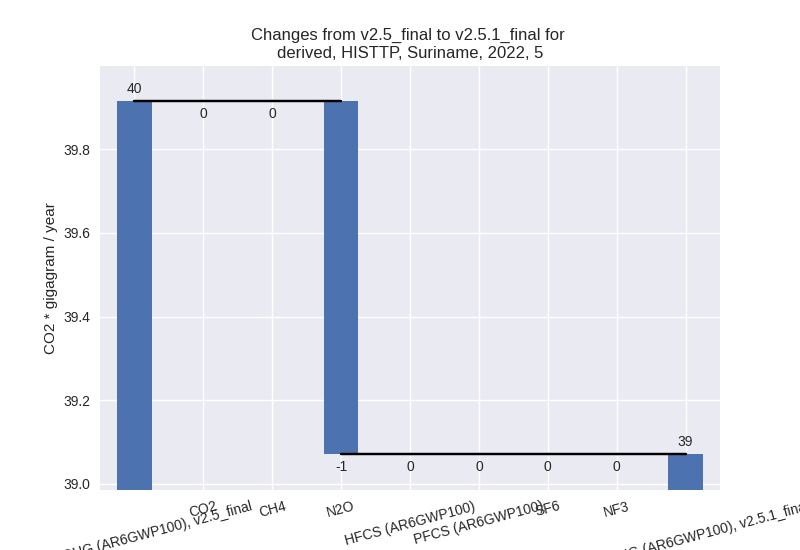
Changes by sector and gas
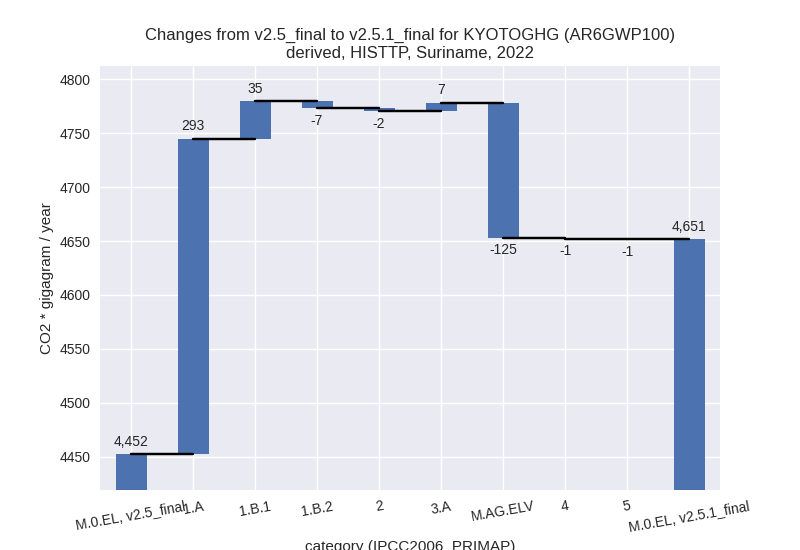
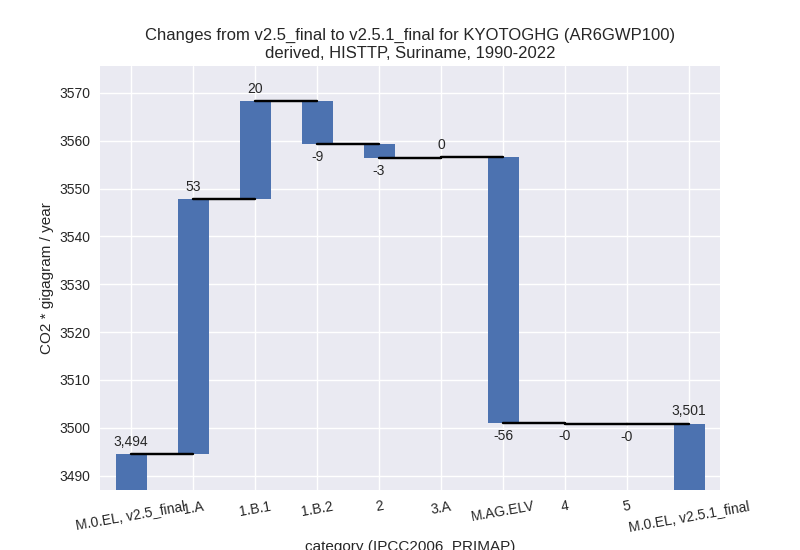
For each scenario and time frame the changes are displayed for all individual sectors and all individual gases. In the sector plot we use aggregate Kyoto GHGs in AR6GWP100. In the gas plot we usenational total emissions without LULUCF. ## country reported scenario
2022


1990-2022

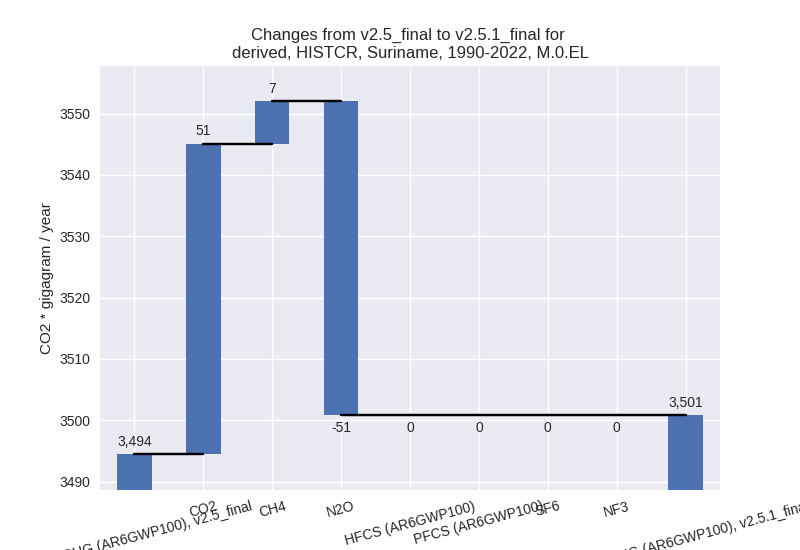
third party scenario
2022
1990-2022

Detailed changes for the scenarios:
country reported scenario (HISTCR):
Most important changes per time frame
For 2022 the following sector-gas combinations have the highest absolute impact on national total KyotoGHG (AR6GWP100) emissions in 2022 (top 5):
- 1: 1.A, CO2 with 278.30 Gg CO2 / year (9.2%)
- 2: M.AG.ELV, N2O with -63.43 Gg CO2 / year (-31.6%)
- 3: M.AG.ELV, CH4 with -60.92 Gg CO2 / year (-11.8%)
- 4: 1.B.1, CH4 with 34.14 Gg CO2 / year (157.3%)
- 5: 1.A, N2O with 15.39 Gg CO2 / year (30.3%)
For 1990-2022 the following sector-gas combinations have the highest absolute impact on national total KyotoGHG (AR6GWP100) emissions in 1990-2022 (top 5):
- 1: 1.A, CO2 with 54.86 Gg CO2 / year (2.5%)
- 2: M.AG.ELV, N2O with -50.76 Gg CO2 / year (-28.1%)
- 3: 1.B.1, CH4 with 20.21 Gg CO2 / year (132.1%)
- 4: 1.B.2, CH4 with -8.88 Gg CO2 / year (-7.7%)
- 5: M.AG.ELV, CH4 with -3.59 Gg CO2 / year (-0.8%)
Changes in the main sectors for aggregate KyotoGHG (AR6GWP100) are
- 1: Total sectoral emissions in 2022 are 3581.95 Gg
CO2 / year which is 77.0% of M.0.EL emissions. 2022 Emissions have
changed by 9.8% (320.87 Gg CO2 /
year). 1990-2022 Emissions have changed by 2.7% (64.92 Gg CO2 / year). For 2022 the
changes per gas
are:

For 1990-2022 the changes per gas are: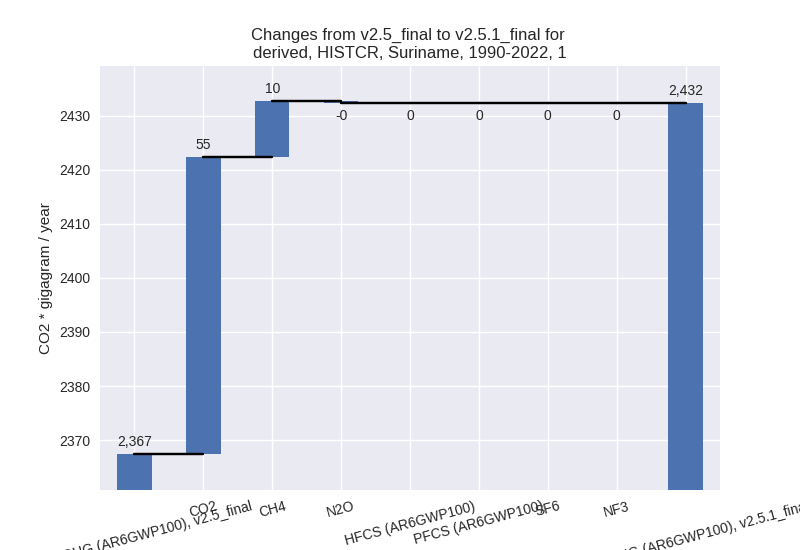
The changes come from the following subsectors:- 1.A: Total sectoral emissions in 2022 are 3388.64
Gg CO2 / year which is 94.6% of category 1 emissions. 2022 Emissions
have changed by 9.5% (292.79 Gg CO2
/ year). 1990-2022 Emissions have changed by 2.4% (53.28 Gg CO2 / year). For 2022 the
changes per gas
are:
For 1990-2022 the changes per gas are:
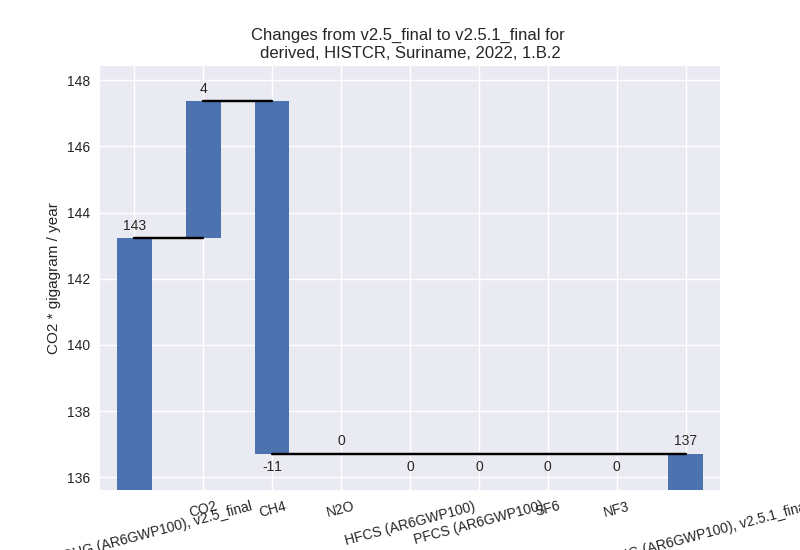
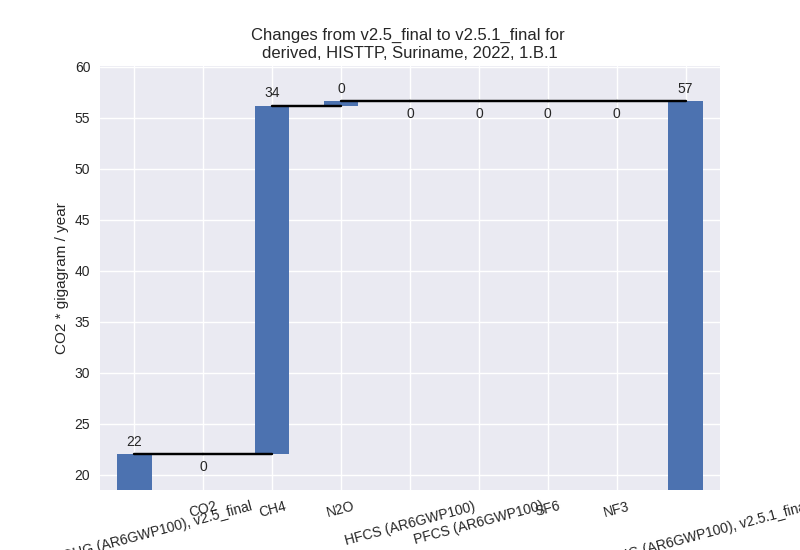
There is no subsector information available in PRIMAP-hist. - 1.B.1: Total sectoral emissions in 2022 are 56.59
Gg CO2 / year which is 1.6% of category 1 emissions. 2022 Emissions have
changed by 157.3% (34.60 Gg CO2 /
year). 1990-2022 Emissions have changed by 132.1% (20.48 Gg CO2 / year). For 2022 the
changes per gas
are:

For 1990-2022 the changes per gas are:
There is no subsector information available in PRIMAP-hist. - 1.B.2: Total sectoral emissions in 2022 are 136.71
Gg CO2 / year which is 3.8% of category 1 emissions. 2022 Emissions have
changed by -4.5% (-6.52 Gg CO2 /
year). 1990-2022 Emissions have changed by -7.6% (-8.85 Gg CO2 / year). For 2022 the
changes per gas
are:
For 1990-2022 the changes per gas are: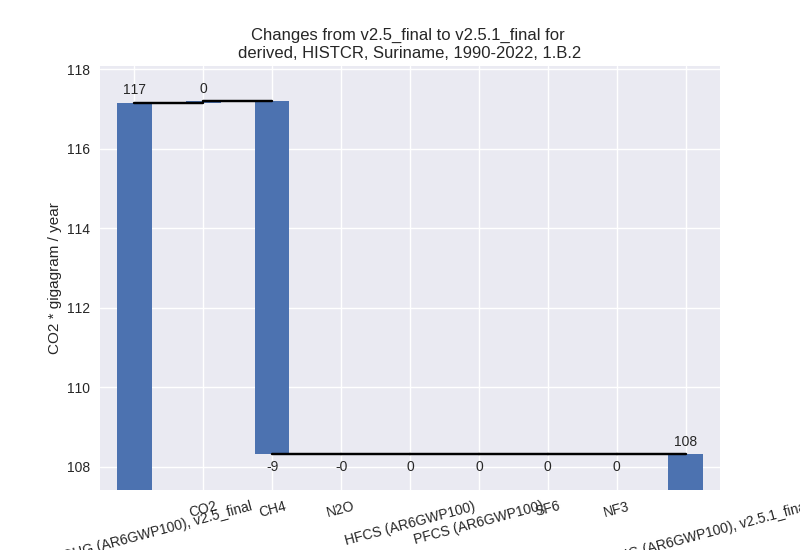
There is no subsector information available in PRIMAP-hist.
- 1.A: Total sectoral emissions in 2022 are 3388.64
Gg CO2 / year which is 94.6% of category 1 emissions. 2022 Emissions
have changed by 9.5% (292.79 Gg CO2
/ year). 1990-2022 Emissions have changed by 2.4% (53.28 Gg CO2 / year). For 2022 the
changes per gas
are:
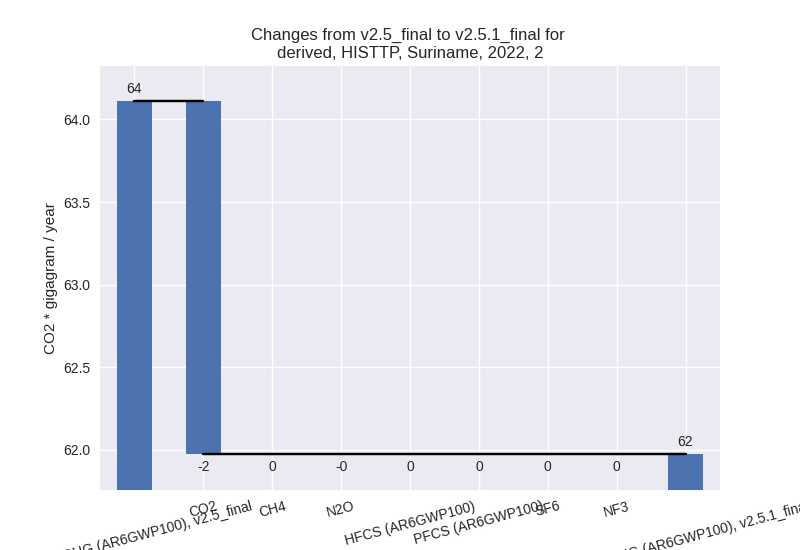
- 2: Total sectoral emissions in 2022 are 61.97 Gg
CO2 / year which is 1.3% of M.0.EL emissions. 2022 Emissions have
changed by -3.3% (-2.14 Gg CO2 /
year). 1990-2022 Emissions have changed by -2.7% (-3.07 Gg CO2 / year). For 2022 the
changes per gas
are:

For 1990-2022 the changes per gas are:
- M.AG: Total sectoral emissions in 2022 are 665.04
Gg CO2 / year which is 14.3% of M.0.EL emissions. 2022 Emissions have
changed by -15.0% (-117.75 Gg CO2 /
year). 1990-2022 Emissions have changed by -7.5% (-55.40 Gg CO2 / year). For 2022 the
changes per gas
are:

For 1990-2022 the changes per gas are: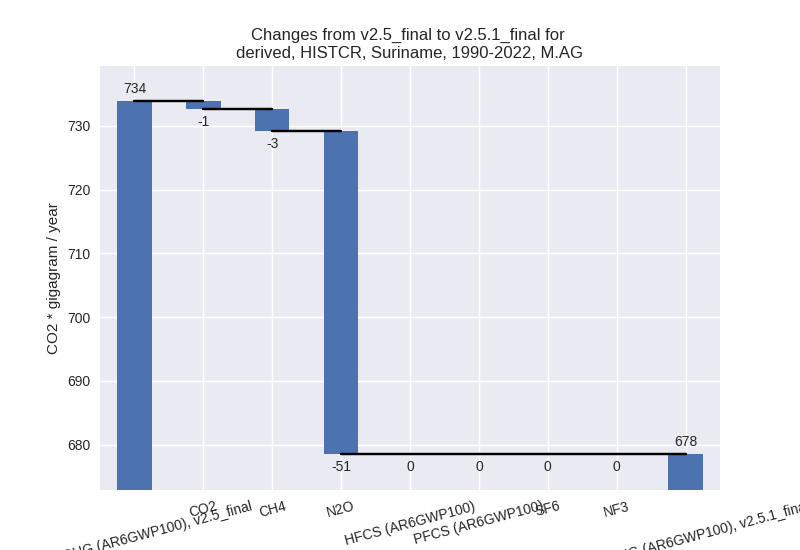
The changes come from the following subsectors:- 3.A: Total sectoral emissions in 2022 are 73.44 Gg
CO2 / year which is 11.0% of category M.AG emissions. 2022 Emissions
have changed by 10.9% (7.23 Gg CO2 /
year). 1990-2022 Emissions have changed by 0.2% (0.18 Gg CO2 / year). For 2022 the
changes per gas
are:
There is no subsector information available in PRIMAP-hist. - M.AG.ELV: Total sectoral emissions in 2022 are
591.60 Gg CO2 / year which is 89.0% of category M.AG emissions. 2022
Emissions have changed by -17.4%
(-124.98 Gg CO2 / year). 1990-2022 Emissions have changed by -9.0% (-55.58 Gg CO2 / year). For 2022 the
changes per gas
are:
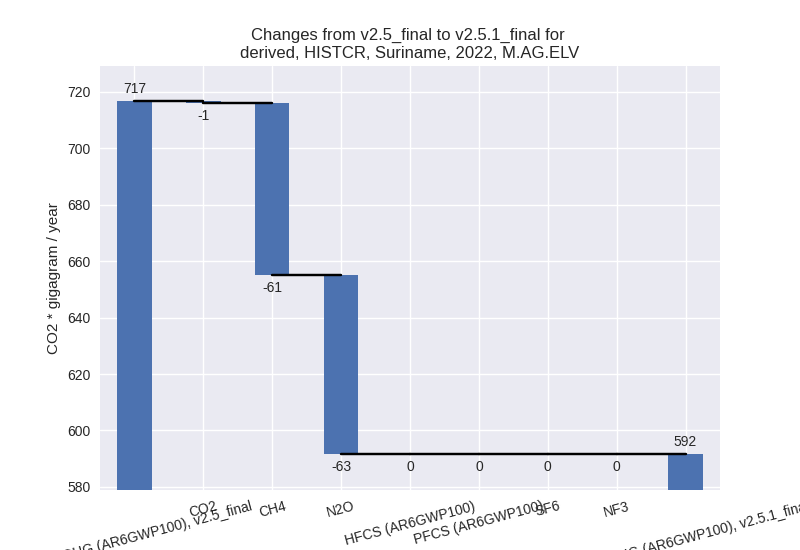
For 1990-2022 the changes per gas are: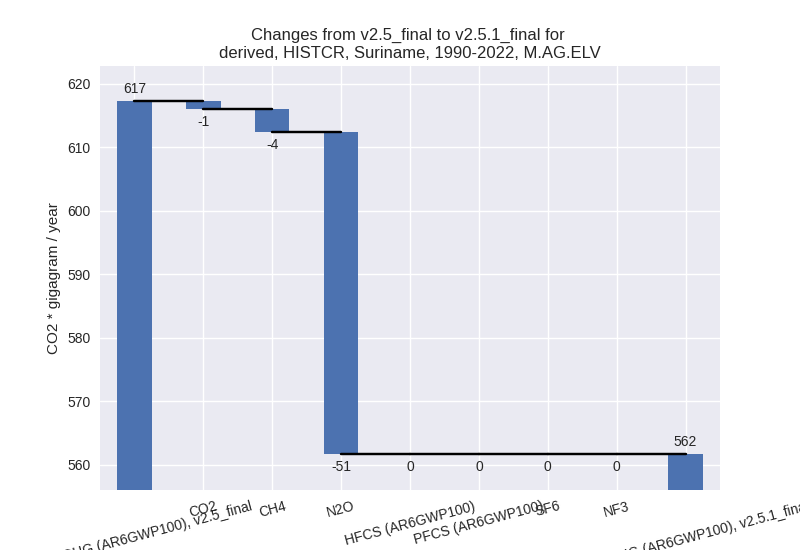
There is no subsector information available in PRIMAP-hist.
- 3.A: Total sectoral emissions in 2022 are 73.44 Gg
CO2 / year which is 11.0% of category M.AG emissions. 2022 Emissions
have changed by 10.9% (7.23 Gg CO2 /
year). 1990-2022 Emissions have changed by 0.2% (0.18 Gg CO2 / year). For 2022 the
changes per gas
are:
- 4: Total sectoral emissions in 2022 are 303.41 Gg CO2 / year which is 6.5% of M.0.EL emissions. 2022 Emissions have changed by -0.3% (-0.92 Gg CO2 / year). 1990-2022 Emissions have changed by -0.0% (-0.03 Gg CO2 / year).
- 5: Total sectoral emissions in 2022 are 39.07 Gg
CO2 / year which is 0.8% of M.0.EL emissions. 2022 Emissions have
changed by -2.1% (-0.84 Gg CO2 /
year). 1990-2022 Emissions have changed by -0.1% (-0.03 Gg CO2 / year). For 2022 the
changes per gas
are:

third party scenario (HISTTP):
Most important changes per time frame
For 2022 the following sector-gas combinations have the highest absolute impact on national total KyotoGHG (AR6GWP100) emissions in 2022 (top 5):
- 1: 1.A, CO2 with 278.30 Gg CO2 / year (9.2%)
- 2: M.AG.ELV, N2O with -63.43 Gg CO2 / year (-31.6%)
- 3: M.AG.ELV, CH4 with -60.92 Gg CO2 / year (-11.8%)
- 4: 1.B.1, CH4 with 34.14 Gg CO2 / year (157.3%)
- 5: 1.A, N2O with 15.39 Gg CO2 / year (30.3%)
For 1990-2022 the following sector-gas combinations have the highest absolute impact on national total KyotoGHG (AR6GWP100) emissions in 1990-2022 (top 5):
- 1: 1.A, CO2 with 54.86 Gg CO2 / year (2.5%)
- 2: M.AG.ELV, N2O with -50.76 Gg CO2 / year (-28.1%)
- 3: 1.B.1, CH4 with 20.21 Gg CO2 / year (132.1%)
- 4: 1.B.2, CH4 with -8.88 Gg CO2 / year (-7.7%)
- 5: M.AG.ELV, CH4 with -3.59 Gg CO2 / year (-0.8%)
Changes in the main sectors for aggregate KyotoGHG (AR6GWP100) are
- 1: Total sectoral emissions in 2022 are 3581.95 Gg
CO2 / year which is 77.0% of M.0.EL emissions. 2022 Emissions have
changed by 9.8% (320.87 Gg CO2 /
year). 1990-2022 Emissions have changed by 2.7% (64.92 Gg CO2 / year). For 2022 the
changes per gas
are:

For 1990-2022 the changes per gas are: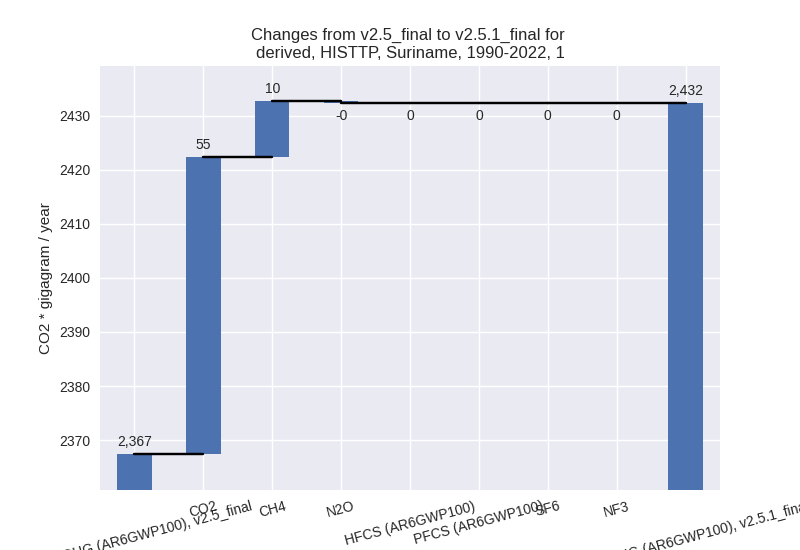
The changes come from the following subsectors:- 1.A: Total sectoral emissions in 2022 are 3388.64
Gg CO2 / year which is 94.6% of category 1 emissions. 2022 Emissions
have changed by 9.5% (292.79 Gg CO2
/ year). 1990-2022 Emissions have changed by 2.4% (53.28 Gg CO2 / year). For 2022 the
changes per gas
are:

For 1990-2022 the changes per gas are: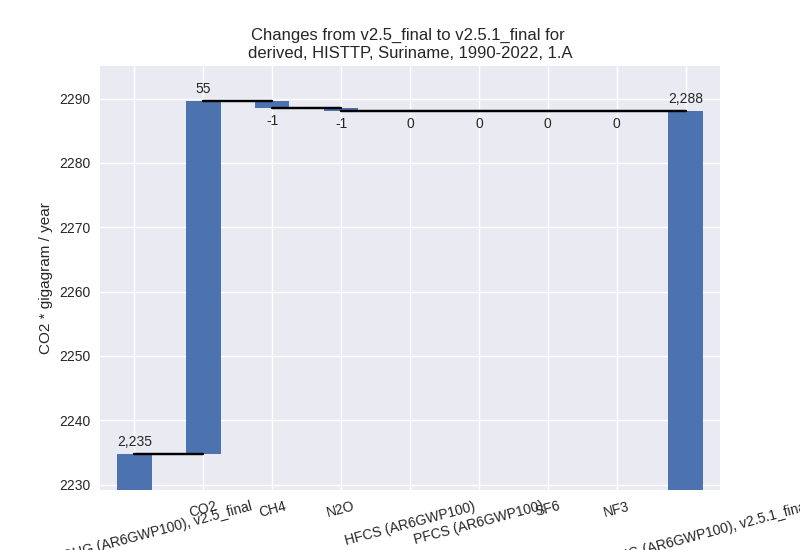
There is no subsector information available in PRIMAP-hist. - 1.B.1: Total sectoral emissions in 2022 are 56.59
Gg CO2 / year which is 1.6% of category 1 emissions. 2022 Emissions have
changed by 157.3% (34.60 Gg CO2 /
year). 1990-2022 Emissions have changed by 132.1% (20.48 Gg CO2 / year). For 2022 the
changes per gas
are:
For 1990-2022 the changes per gas are:
There is no subsector information available in PRIMAP-hist. - 1.B.2: Total sectoral emissions in 2022 are 136.71
Gg CO2 / year which is 3.8% of category 1 emissions. 2022 Emissions have
changed by -4.5% (-6.52 Gg CO2 /
year). 1990-2022 Emissions have changed by -7.6% (-8.85 Gg CO2 / year). For 2022 the
changes per gas
are:

For 1990-2022 the changes per gas are:
There is no subsector information available in PRIMAP-hist.
- 1.A: Total sectoral emissions in 2022 are 3388.64
Gg CO2 / year which is 94.6% of category 1 emissions. 2022 Emissions
have changed by 9.5% (292.79 Gg CO2
/ year). 1990-2022 Emissions have changed by 2.4% (53.28 Gg CO2 / year). For 2022 the
changes per gas
are:
- 2: Total sectoral emissions in 2022 are 61.97 Gg
CO2 / year which is 1.3% of M.0.EL emissions. 2022 Emissions have
changed by -3.3% (-2.14 Gg CO2 /
year). 1990-2022 Emissions have changed by -2.7% (-3.07 Gg CO2 / year). For 2022 the
changes per gas
are:
For 1990-2022 the changes per gas are: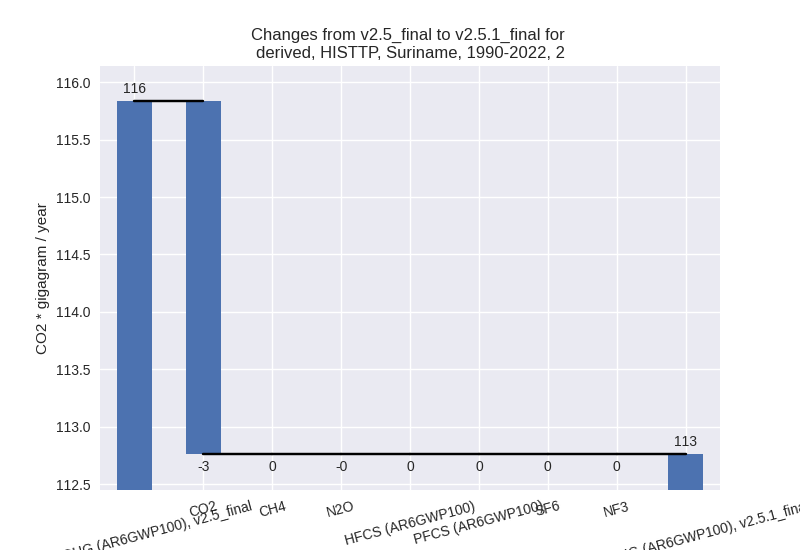
- M.AG: Total sectoral emissions in 2022 are 665.04
Gg CO2 / year which is 14.3% of M.0.EL emissions. 2022 Emissions have
changed by -15.0% (-117.75 Gg CO2 /
year). 1990-2022 Emissions have changed by -7.5% (-55.40 Gg CO2 / year). For 2022 the
changes per gas
are:

For 1990-2022 the changes per gas are:
The changes come from the following subsectors:- 3.A: Total sectoral emissions in 2022 are 73.44 Gg
CO2 / year which is 11.0% of category M.AG emissions. 2022 Emissions
have changed by 10.9% (7.23 Gg CO2 /
year). 1990-2022 Emissions have changed by 0.2% (0.18 Gg CO2 / year). For 2022 the
changes per gas
are:

There is no subsector information available in PRIMAP-hist. - M.AG.ELV: Total sectoral emissions in 2022 are
591.60 Gg CO2 / year which is 89.0% of category M.AG emissions. 2022
Emissions have changed by -17.4%
(-124.98 Gg CO2 / year). 1990-2022 Emissions have changed by -9.0% (-55.58 Gg CO2 / year). For 2022 the
changes per gas
are:

For 1990-2022 the changes per gas are:
There is no subsector information available in PRIMAP-hist.
- 3.A: Total sectoral emissions in 2022 are 73.44 Gg
CO2 / year which is 11.0% of category M.AG emissions. 2022 Emissions
have changed by 10.9% (7.23 Gg CO2 /
year). 1990-2022 Emissions have changed by 0.2% (0.18 Gg CO2 / year). For 2022 the
changes per gas
are:
- 4: Total sectoral emissions in 2022 are 303.41 Gg CO2 / year which is 6.5% of M.0.EL emissions. 2022 Emissions have changed by -0.3% (-0.92 Gg CO2 / year). 1990-2022 Emissions have changed by -0.0% (-0.03 Gg CO2 / year).
- 5: Total sectoral emissions in 2022 are 39.07 Gg
CO2 / year which is 0.8% of M.0.EL emissions. 2022 Emissions have
changed by -2.1% (-0.84 Gg CO2 /
year). 1990-2022 Emissions have changed by -0.1% (-0.03 Gg CO2 / year). For 2022 the
changes per gas
are: