Changes in PRIMAP-hist v2.5.1_final compared to v2.5_final for Slovakia
2024-02-29
Johannes Gütschow
Change analysis for Slovakia for PRIMAP-hist v2.5.1_final compared to v2.5_final
Overview over emissions by sector and gas
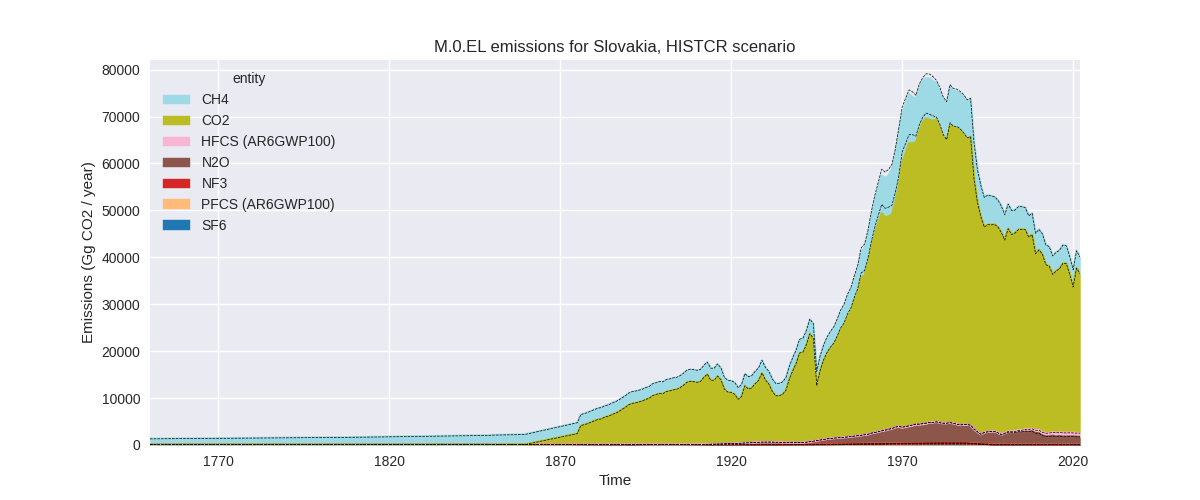
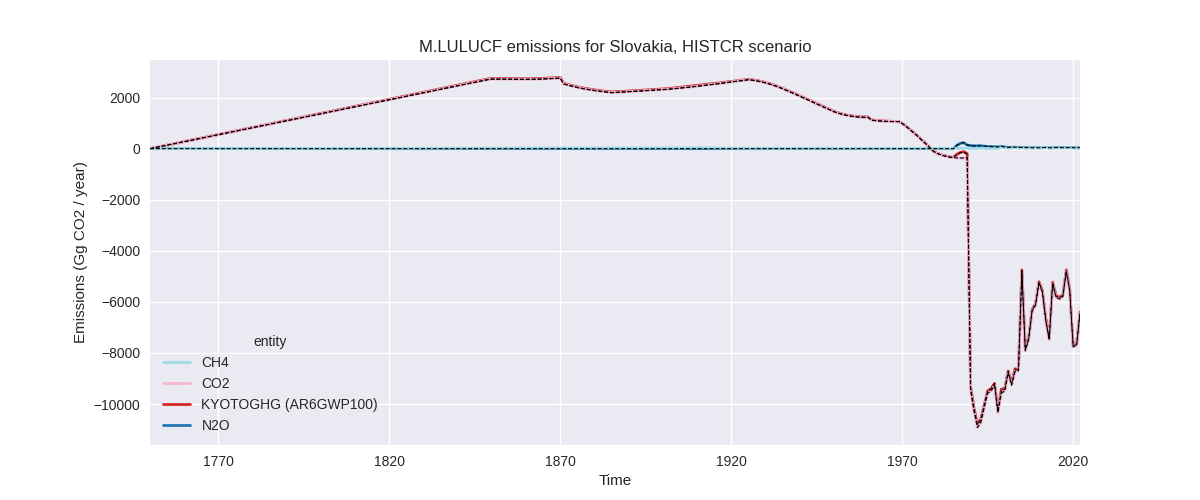
The following figures show the aggregate national total emissions excluding LULUCF AR6GWP100 for the country reported priority scenario. The dotted linesshow the v2.5_final data.

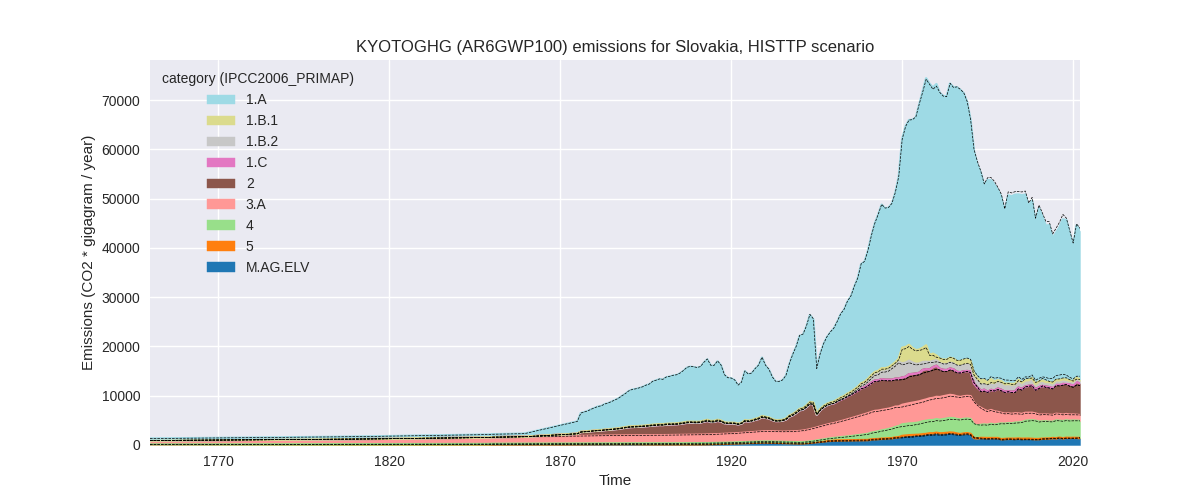
The following figures show the aggregate national total emissions excluding LULUCF AR6GWP100 for the third party priority scenario. The dotted linesshow the v2.5_final data.


Overview over changes
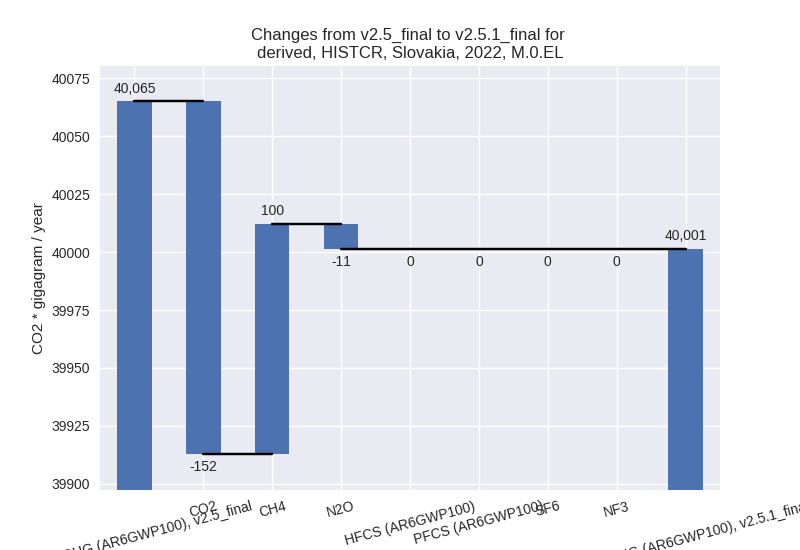
In the country reported priority scenario we have the following changes for aggregate Kyoto GHG and national total emissions excluding LULUCF (M.0.EL):
- Emissions in 2022 have changed by -0.2%% (-63.67 Gg CO2 / year)
- Emissions in 1990-2022 have changed by -0.0%% (-1.93 Gg CO2 / year)
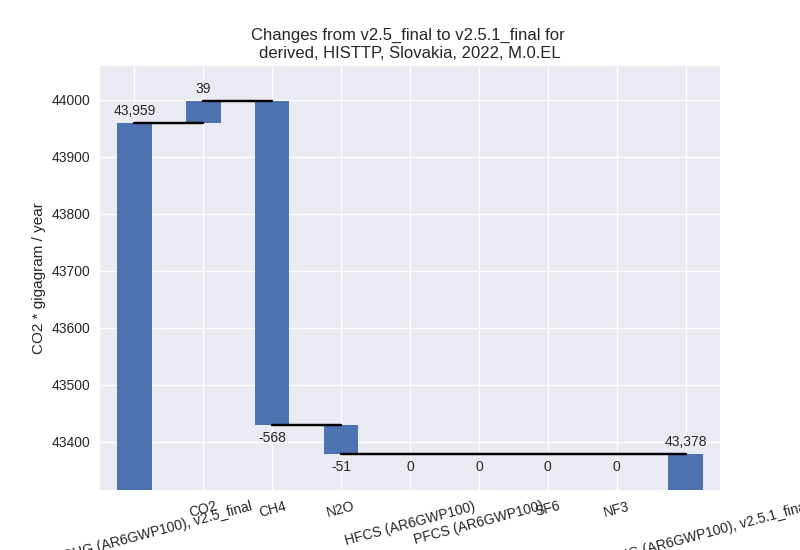
In the third party priority scenario we have the following changes for aggregate Kyoto GHG and national total emissions excluding LULUCF (M.0.EL):
- Emissions in 2022 have changed by -1.3%% (-580.69 Gg CO2 / year)
- Emissions in 1990-2022 have changed by -1.3%% (-637.97 Gg CO2 / year)
Most important changes per scenario and time frame
In the country reported priority scenario the following sector-gas combinations have the highest absolute impact on national total KyotoGHG (AR6GWP100) emissions in 2022 (top 5):
- 1: 1.B.2, CH4 with 181.60 Gg CO2 / year (237.8%)
- 2: 2, CO2 with -137.81 Gg CO2 / year (-1.7%)
- 3: 4, CH4 with -82.43 Gg CO2 / year (-4.5%)
- 4: M.AG.ELV, N2O with -59.09 Gg CO2 / year (-4.8%)
- 5: 2, N2O with 57.04 Gg CO2 / year (93.3%)
In the country reported priority scenario the following sector-gas combinations have the highest absolute impact on national total KyotoGHG (AR6GWP100) emissions in 1990-2022 (top 5):
- 1: 1.B.2, CH4 with 5.50 Gg CO2 / year (0.6%)
- 2: 2, CO2 with -4.18 Gg CO2 / year (-0.1%)
- 3: 4, CH4 with -2.50 Gg CO2 / year (-0.2%)
- 4: M.AG.ELV, N2O with -1.79 Gg CO2 / year (-0.1%)
- 5: 2, N2O with 1.73 Gg CO2 / year (0.2%)
In the third party priority scenario the following sector-gas combinations have the highest absolute impact on national total KyotoGHG (AR6GWP100) emissions in 2022 (top 5):
- 1: 1.B.2, CH4 with -665.09 Gg CO2 / year (-54.3%)
- 2: 2, CO2 with 373.89 Gg CO2 / year (10.3%)
- 3: 1.B.1, CO2 with -343.80 Gg CO2 / year (-63.0%)
- 4: M.AG.ELV, N2O with -118.14 Gg CO2 / year (-9.0%)
- 5: 1.A, CH4 with 103.64 Gg CO2 / year (48.9%)
In the third party priority scenario the following sector-gas combinations have the highest absolute impact on national total KyotoGHG (AR6GWP100) emissions in 1990-2022 (top 5):
- 1: 1.B.2, CH4 with -662.50 Gg CO2 / year (-43.8%)
- 2: 1.B.1, CO2 with -147.49 Gg CO2 / year (-31.9%)
- 3: 2, CO2 with 132.07 Gg CO2 / year (3.9%)
- 4: M.AG.ELV, CO2 with 45.68 Gg CO2 / year (104.7%)
- 5: 1.B.1, CH4 with -36.30 Gg CO2 / year (-15.1%)
Notes on data changes
No country specific notes present for this changelog.
Changes by sector and gas
For each scenario and time frame the changes are displayed for all individual sectors and all individual gases. In the sector plot we use aggregate Kyoto GHGs in AR6GWP100. In the gas plot we usenational total emissions without LULUCF. ## country reported scenario
2022

1990-2022


third party scenario
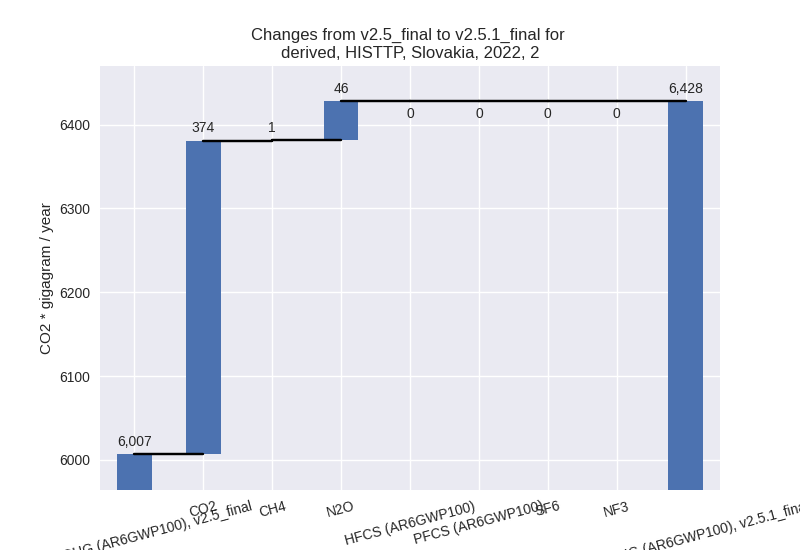
2022

1990-2022


Detailed changes for the scenarios:
country reported scenario (HISTCR):
Most important changes per time frame
For 2022 the following sector-gas combinations have the highest absolute impact on national total KyotoGHG (AR6GWP100) emissions in 2022 (top 5):
- 1: 1.B.2, CH4 with 181.60 Gg CO2 / year (237.8%)
- 2: 2, CO2 with -137.81 Gg CO2 / year (-1.7%)
- 3: 4, CH4 with -82.43 Gg CO2 / year (-4.5%)
- 4: M.AG.ELV, N2O with -59.09 Gg CO2 / year (-4.8%)
- 5: 2, N2O with 57.04 Gg CO2 / year (93.3%)
For 1990-2022 the following sector-gas combinations have the highest absolute impact on national total KyotoGHG (AR6GWP100) emissions in 1990-2022 (top 5):
- 1: 1.B.2, CH4 with 5.50 Gg CO2 / year (0.6%)
- 2: 2, CO2 with -4.18 Gg CO2 / year (-0.1%)
- 3: 4, CH4 with -2.50 Gg CO2 / year (-0.2%)
- 4: M.AG.ELV, N2O with -1.79 Gg CO2 / year (-0.1%)
- 5: 2, N2O with 1.73 Gg CO2 / year (0.2%)
Changes in the main sectors for aggregate KyotoGHG (AR6GWP100) are
- 1: Total sectoral emissions in 2022 are 26628.97 Gg CO2 / year which is 66.6% of M.0.EL emissions. 2022 Emissions have changed by 0.8% (198.75 Gg CO2 / year). 1990-2022 Emissions have changed by 0.0% (6.02 Gg CO2 / year).
- 2: Total sectoral emissions in 2022 are 9070.07 Gg CO2 / year which is 22.7% of M.0.EL emissions. 2022 Emissions have changed by -0.9% (-81.27 Gg CO2 / year). 1990-2022 Emissions have changed by -0.0% (-2.46 Gg CO2 / year).
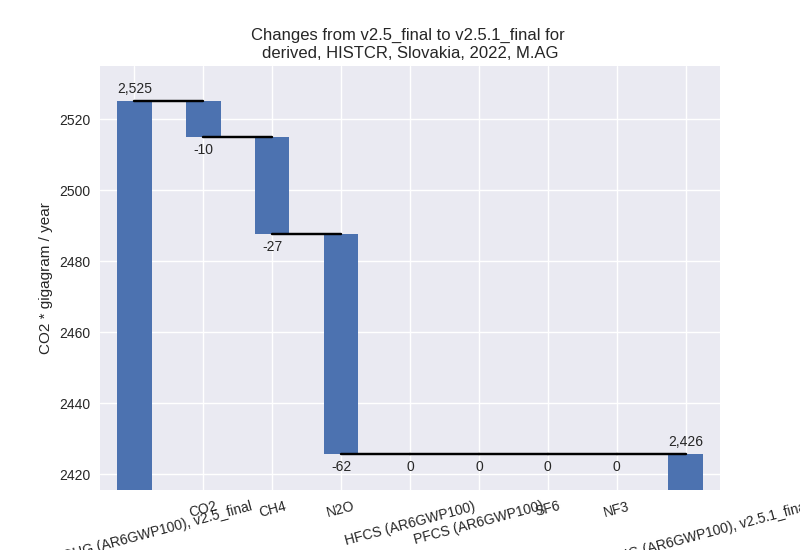
- M.AG: Total sectoral emissions in 2022 are 2425.58
Gg CO2 / year which is 6.1% of M.0.EL emissions. 2022 Emissions have
changed by -3.9% (-99.54 Gg CO2 /
year). 1990-2022 Emissions have changed by -0.1% (-3.02 Gg CO2 / year). For 2022 the
changes per gas
are:
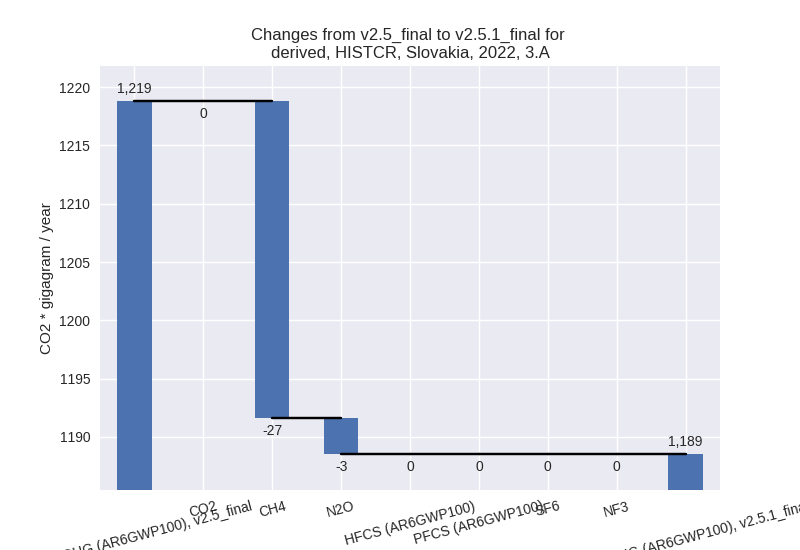
The changes come from the following subsectors:- 3.A: Total sectoral emissions in 2022 are 1188.51
Gg CO2 / year which is 49.0% of category M.AG emissions. 2022 Emissions
have changed by -2.5% (-30.28 Gg CO2
/ year). 1990-2022 Emissions have changed by -0.1% (-0.92 Gg CO2 / year). For 2022 the
changes per gas
are:
There is no subsector information available in PRIMAP-hist. - M.AG.ELV: Total sectoral emissions in 2022 are
1237.07 Gg CO2 / year which is 51.0% of category M.AG emissions. 2022
Emissions have changed by -5.3%
(-69.27 Gg CO2 / year). 1990-2022 Emissions have changed by -0.2% (-2.10 Gg CO2 / year). For 2022 the
changes per gas
are:
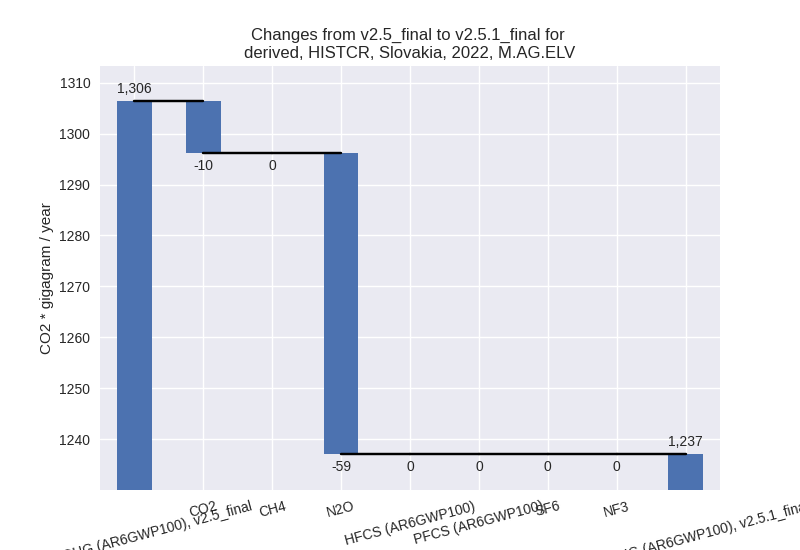
There is no subsector information available in PRIMAP-hist.
- 3.A: Total sectoral emissions in 2022 are 1188.51
Gg CO2 / year which is 49.0% of category M.AG emissions. 2022 Emissions
have changed by -2.5% (-30.28 Gg CO2
/ year). 1990-2022 Emissions have changed by -0.1% (-0.92 Gg CO2 / year). For 2022 the
changes per gas
are:
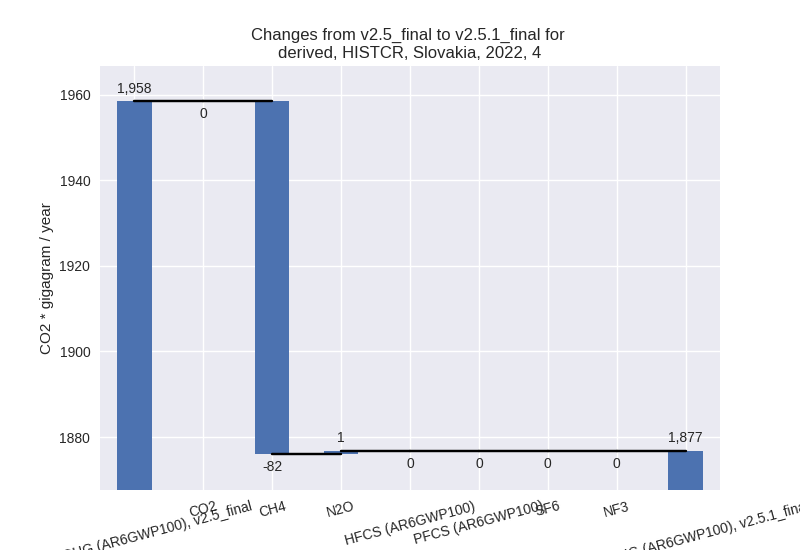
- 4: Total sectoral emissions in 2022 are 1876.82 Gg
CO2 / year which is 4.7% of M.0.EL emissions. 2022 Emissions have
changed by -4.2% (-81.60 Gg CO2 /
year). 1990-2022 Emissions have changed by -0.1% (-2.47 Gg CO2 / year). For 2022 the
changes per gas
are:
- 5: No data
third party scenario (HISTTP):
Most important changes per time frame
For 2022 the following sector-gas combinations have the highest absolute impact on national total KyotoGHG (AR6GWP100) emissions in 2022 (top 5):
- 1: 1.B.2, CH4 with -665.09 Gg CO2 / year (-54.3%)
- 2: 2, CO2 with 373.89 Gg CO2 / year (10.3%)
- 3: 1.B.1, CO2 with -343.80 Gg CO2 / year (-63.0%)
- 4: M.AG.ELV, N2O with -118.14 Gg CO2 / year (-9.0%)
- 5: 1.A, CH4 with 103.64 Gg CO2 / year (48.9%)
For 1990-2022 the following sector-gas combinations have the highest absolute impact on national total KyotoGHG (AR6GWP100) emissions in 1990-2022 (top 5):
- 1: 1.B.2, CH4 with -662.50 Gg CO2 / year (-43.8%)
- 2: 1.B.1, CO2 with -147.49 Gg CO2 / year (-31.9%)
- 3: 2, CO2 with 132.07 Gg CO2 / year (3.9%)
- 4: M.AG.ELV, CO2 with 45.68 Gg CO2 / year (104.7%)
- 5: 1.B.1, CH4 with -36.30 Gg CO2 / year (-15.1%)
Changes in the main sectors for aggregate KyotoGHG (AR6GWP100) are
- 1: Total sectoral emissions in 2022 are 30891.97 Gg
CO2 / year which is 71.2% of M.0.EL emissions. 2022 Emissions have
changed by -3.1% (-978.48 Gg CO2 /
year). 1990-2022 Emissions have changed by -2.1% (-812.98 Gg CO2 / year). For 2022
the changes per gas
are:
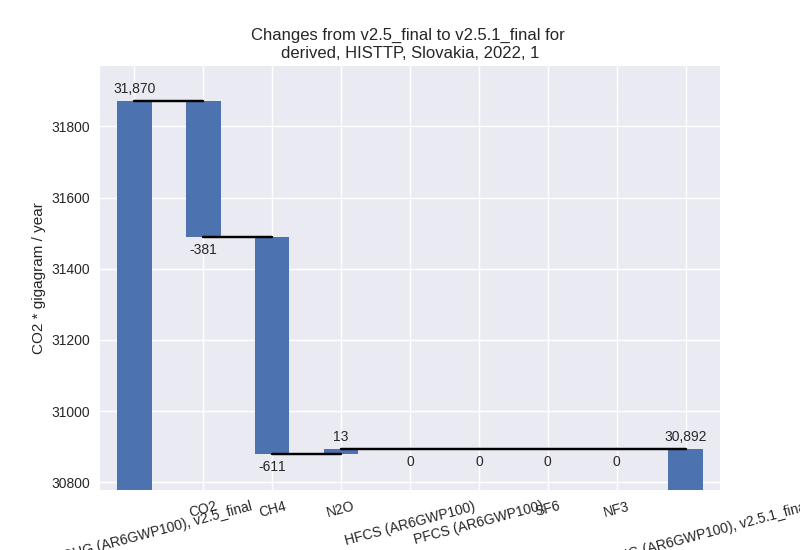
For 1990-2022 the changes per gas are:
The changes come from the following subsectors:- 1.A: Total sectoral emissions in 2022 are 30073.41 Gg CO2 / year which is 97.4% of category 1 emissions. 2022 Emissions have changed by 0.3% (80.00 Gg CO2 / year). 1990-2022 Emissions have changed by 0.1% (33.31 Gg CO2 / year).
- 1.B.1: Total sectoral emissions in 2022 are 259.12
Gg CO2 / year which is 0.8% of category 1 emissions. 2022 Emissions have
changed by -60.3% (-393.40 Gg CO2 /
year). 1990-2022 Emissions have changed by -26.2% (-183.79 Gg CO2 / year). For 2022
the changes per gas
are:
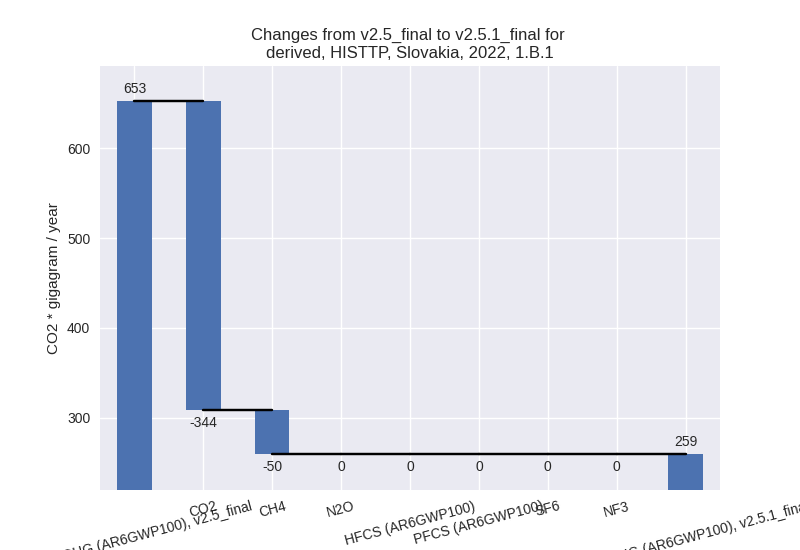
For 1990-2022 the changes per gas are:
There is no subsector information available in PRIMAP-hist. - 1.B.2: Total sectoral emissions in 2022 are 559.44
Gg CO2 / year which is 1.8% of category 1 emissions. 2022 Emissions have
changed by -54.3% (-665.08 Gg CO2 /
year). 1990-2022 Emissions have changed by -43.4% (-662.50 Gg CO2 / year). For 2022
the changes per gas
are:

For 1990-2022 the changes per gas are:
There is no subsector information available in PRIMAP-hist.
- 2: Total sectoral emissions in 2022 are 6427.70 Gg
CO2 / year which is 14.8% of M.0.EL emissions. 2022 Emissions have
changed by 7.0% (420.87 Gg CO2 /
year). 1990-2022 Emissions have changed by 2.8% (141.54 Gg CO2 / year). For 2022 the
changes per gas
are:
For 1990-2022 the changes per gas are: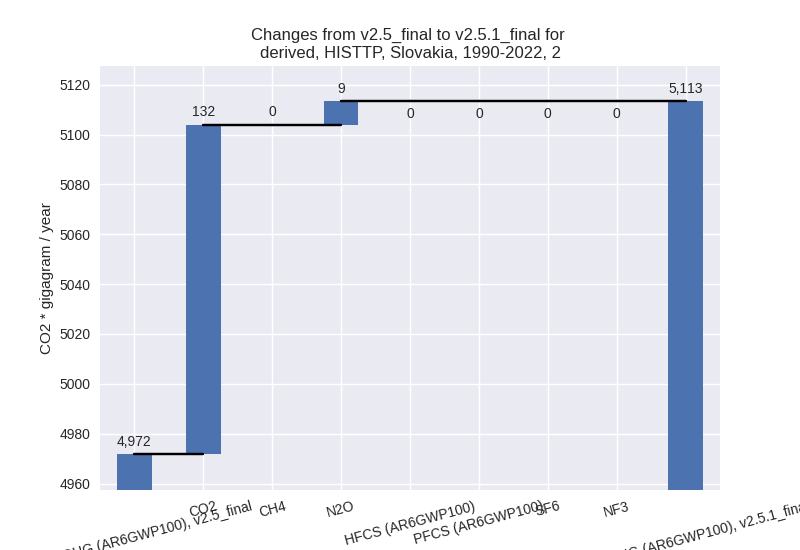
- M.AG: Total sectoral emissions in 2022 are 2505.53
Gg CO2 / year which is 5.8% of M.0.EL emissions. 2022 Emissions have
changed by -3.7% (-95.00 Gg CO2 /
year). 1990-2022 Emissions have changed by 1.0% (31.29 Gg CO2 / year). For 2022 the
changes per gas
are:

The changes come from the following subsectors:- 3.A: Total sectoral emissions in 2022 are 1168.65 Gg CO2 / year which is 46.6% of category M.AG emissions. 2022 Emissions have changed by -1.4% (-17.12 Gg CO2 / year). 1990-2022 Emissions have changed by -0.0% (-1.00 Gg CO2 / year).
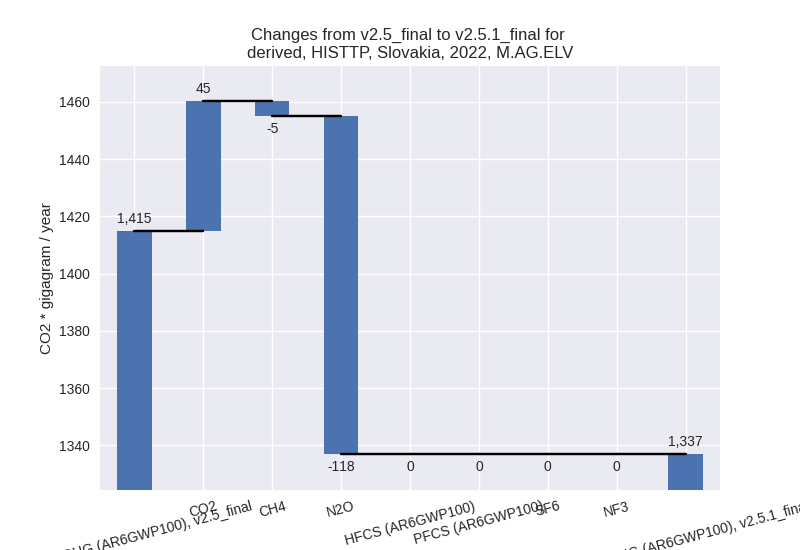
- M.AG.ELV: Total sectoral emissions in 2022 are
1336.87 Gg CO2 / year which is 53.4% of category M.AG emissions. 2022
Emissions have changed by -5.5%
(-77.88 Gg CO2 / year). 1990-2022 Emissions have changed by 2.7% (32.30 Gg CO2 / year). For 2022 the
changes per gas
are:
For 1990-2022 the changes per gas are:
There is no subsector information available in PRIMAP-hist.
- 4: Total sectoral emissions in 2022 are 3470.66 Gg CO2 / year which is 8.0% of M.0.EL emissions. 2022 Emissions have changed by 2.0% (66.43 Gg CO2 / year). 1990-2022 Emissions have changed by 0.1% (2.01 Gg CO2 / year).
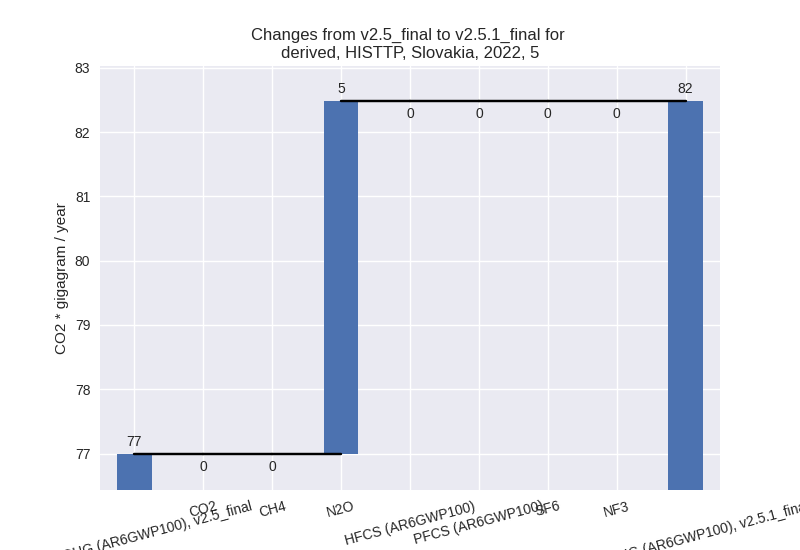
- 5: Total sectoral emissions in 2022 are 82.48 Gg
CO2 / year which is 0.2% of M.0.EL emissions. 2022 Emissions have
changed by 7.1% (5.49 Gg CO2 /
year). 1990-2022 Emissions have changed by 0.1% (0.17 Gg CO2 / year). For 2022 the
changes per gas
are: