Changes in PRIMAP-hist v2.5.1_final compared to v2.5_final for Slovenia
2024-02-29
Johannes Gütschow
Change analysis for Slovenia for PRIMAP-hist v2.5.1_final compared to v2.5_final
Overview over emissions by sector and gas
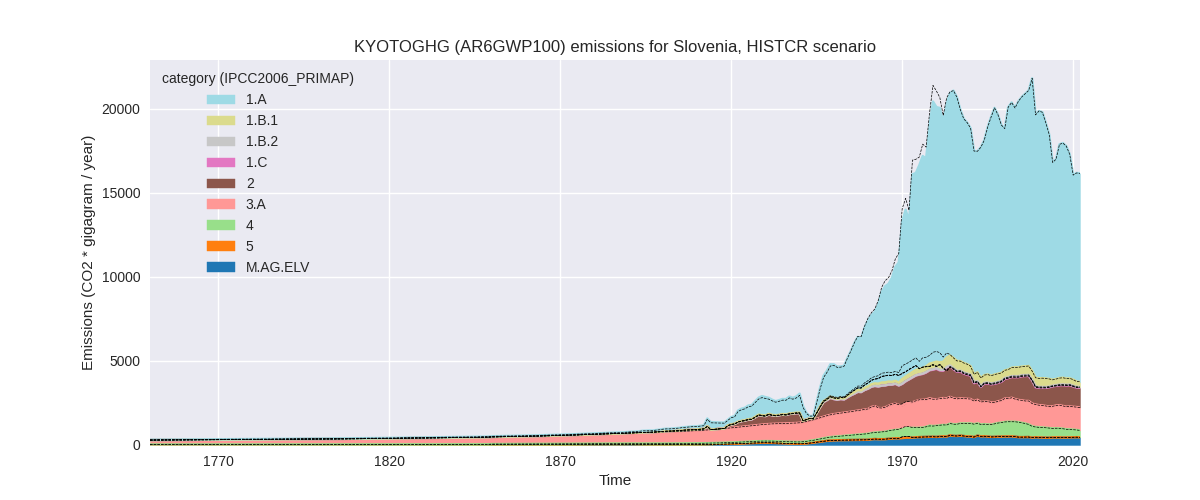
The following figures show the aggregate national total emissions excluding LULUCF AR6GWP100 for the country reported priority scenario. The dotted linesshow the v2.5_final data.

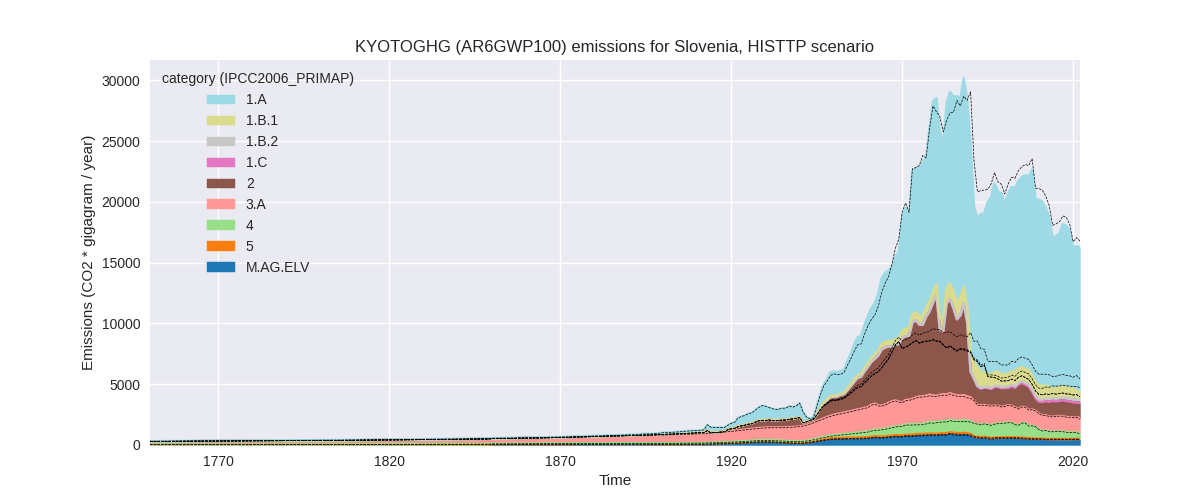
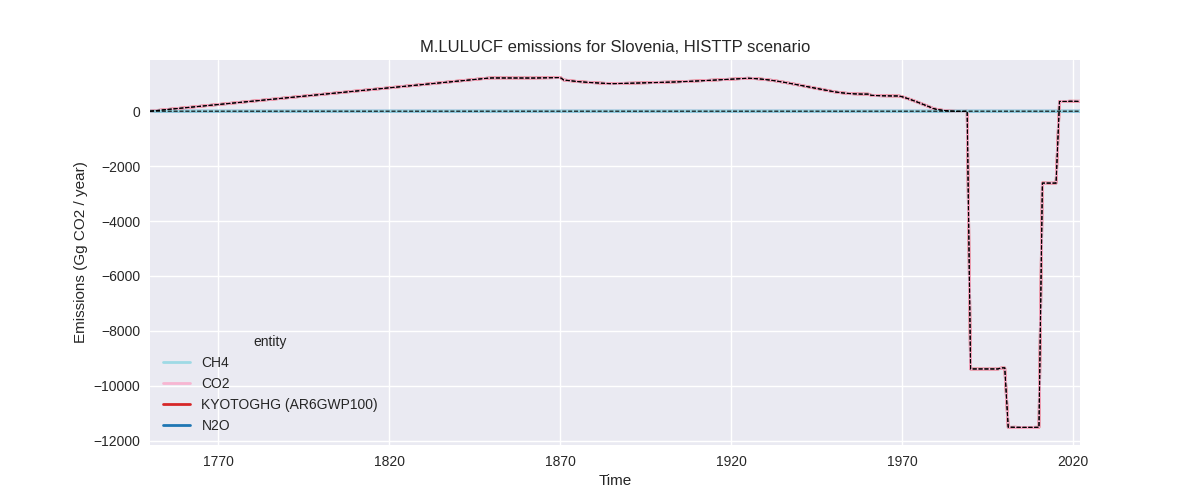
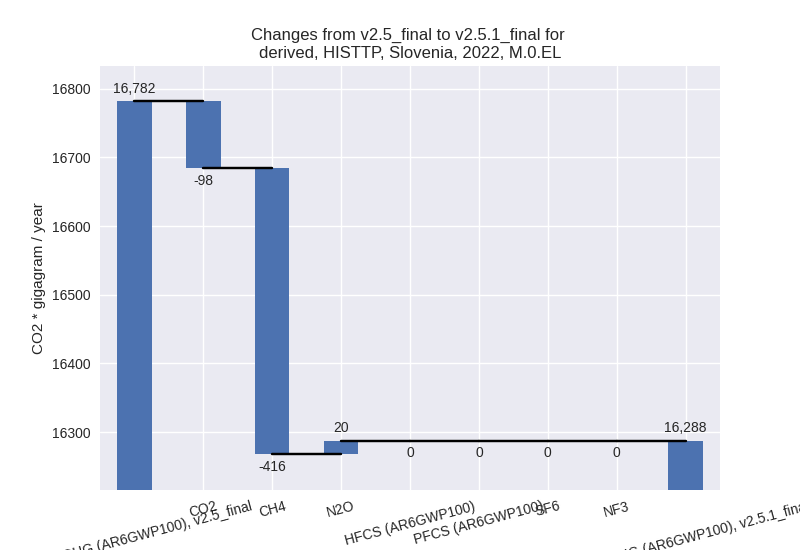
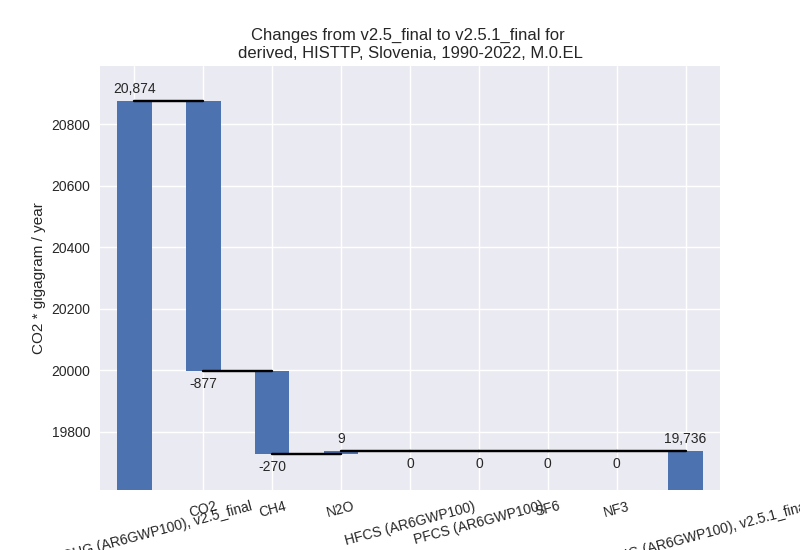
The following figures show the aggregate national total emissions excluding LULUCF AR6GWP100 for the third party priority scenario. The dotted linesshow the v2.5_final data.

Overview over changes
In the country reported priority scenario we have the following changes for aggregate Kyoto GHG and national total emissions excluding LULUCF (M.0.EL):
- Emissions in 2022 have changed by -0.0%% (-2.16 Gg CO2 / year)
- Emissions in 1990-2022 have changed by -0.0%% (-0.07 Gg CO2 / year)
In the third party priority scenario we have the following changes for aggregate Kyoto GHG and national total emissions excluding LULUCF (M.0.EL):
- Emissions in 2022 have changed by -2.9%% (-493.68 Gg CO2 / year)
- Emissions in 1990-2022 have changed by -5.5%% (-1137.95 Gg CO2 / year)
Most important changes per scenario and time frame
In the country reported priority scenario the following sector-gas combinations have the highest absolute impact on national total KyotoGHG (AR6GWP100) emissions in 2022 (top 5):
- 1: 2, CO2 with -21.63 Gg CO2 / year (-2.7%)
- 2: 1.B.1, CH4 with -13.94 Gg CO2 / year (-7.0%)
- 3: 4, CO2 with -13.06 Gg CO2 / year (-50.0%)
- 4: 3.A, CH4 with 13.05 Gg CO2 / year (1.0%)
- 5: 1.A, CH4 with 12.41 Gg CO2 / year (9.0%)
In the country reported priority scenario the following sector-gas combinations have the highest absolute impact on national total KyotoGHG (AR6GWP100) emissions in 1990-2022 (top 5):
- 1: 2, CO2 with -0.66 Gg CO2 / year (-0.1%)
- 2: 1.B.1, CH4 with -0.42 Gg CO2 / year (-0.1%)
- 3: 4, CO2 with -0.40 Gg CO2 / year (-4.4%)
- 4: 3.A, CH4 with 0.40 Gg CO2 / year (0.0%)
- 5: 1.A, CH4 with 0.38 Gg CO2 / year (0.2%)
In the third party priority scenario the following sector-gas combinations have the highest absolute impact on national total KyotoGHG (AR6GWP100) emissions in 2022 (top 5):
- 1: 2, CO2 with -625.15 Gg CO2 / year (-46.9%)
- 2: 1.A, CO2 with 529.93 Gg CO2 / year (4.8%)
- 3: 1.B.2, CH4 with -431.18 Gg CO2 / year (-58.9%)
- 4: 1.B.1, CH4 with -98.45 Gg CO2 / year (-13.7%)
- 5: 4, CH4 with 92.74 Gg CO2 / year (25.7%)
In the third party priority scenario the following sector-gas combinations have the highest absolute impact on national total KyotoGHG (AR6GWP100) emissions in 1990-2022 (top 5):
- 1: 2, CO2 with -812.70 Gg CO2 / year (-52.1%)
- 2: 1.B.2, CH4 with -252.11 Gg CO2 / year (-61.0%)
- 3: 1.A, CO2 with -65.40 Gg CO2 / year (-0.5%)
- 4: 1.B.1, CH4 with -20.75 Gg CO2 / year (-1.9%)
- 5: M.AG.ELV, N2O with 8.35 Gg CO2 / year (1.8%)
Notes on data changes
Here we list notes explaining important emissions changes for the country. ’' means that the following text only applies to the TP time series, while means that it only applies to the CR scenario. Otherwise the note applies to both scenarios.
- 1.A, CO2: A change in downscaling of CDIAC data for the former Yugoslavia to its member states has lowered pre-1990 emissions. The shares are now calculated based on the shares in the first year with data for the individual states instead of a multi year average. This is more realistic as the rapid emissions decline after 1990 differs by country.
- 2.C, CO2: Much lower emissions in EDGAR 8.0 than in EDGAR 7.0
- 2.D, CO2: Much lower emissions in EDGAR 8.0 than in EDGAR 7.0
- 1.B.2, CH4: Emissions in EDGAR 8.0 are much lower than in older releases.
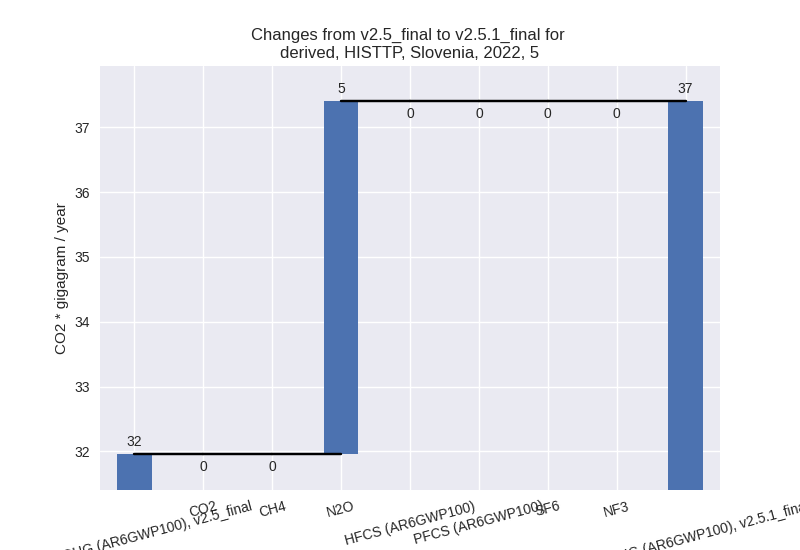
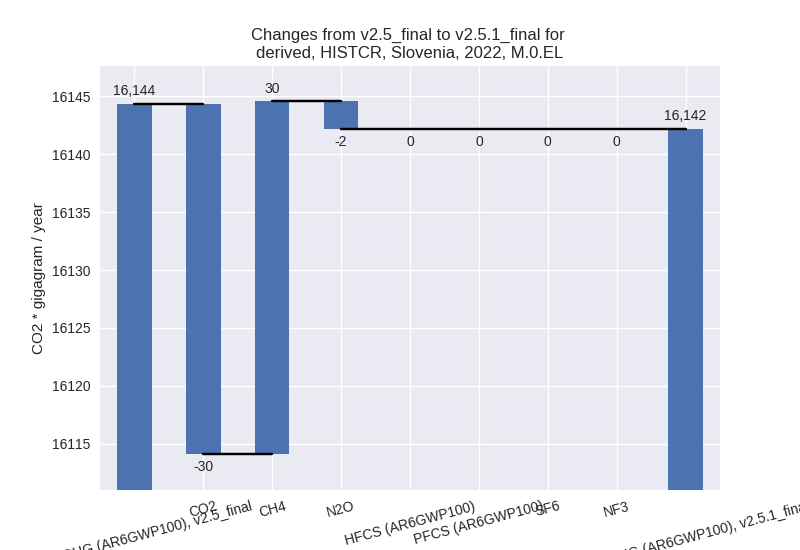
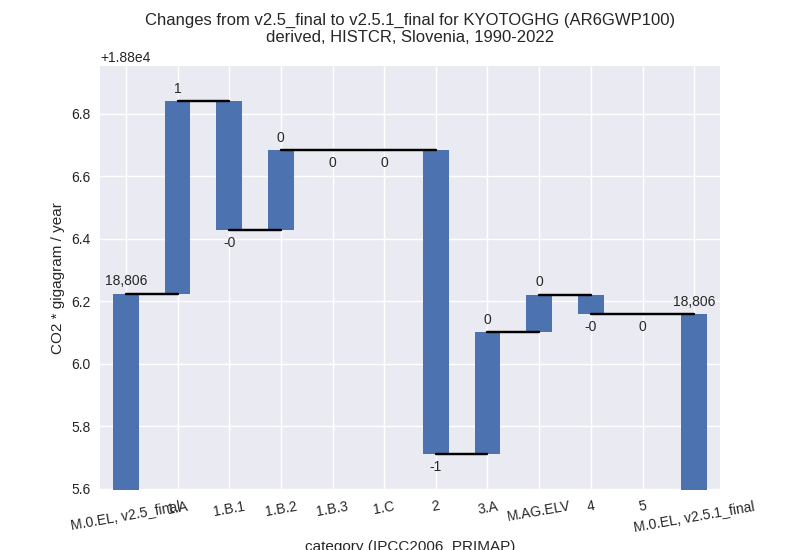
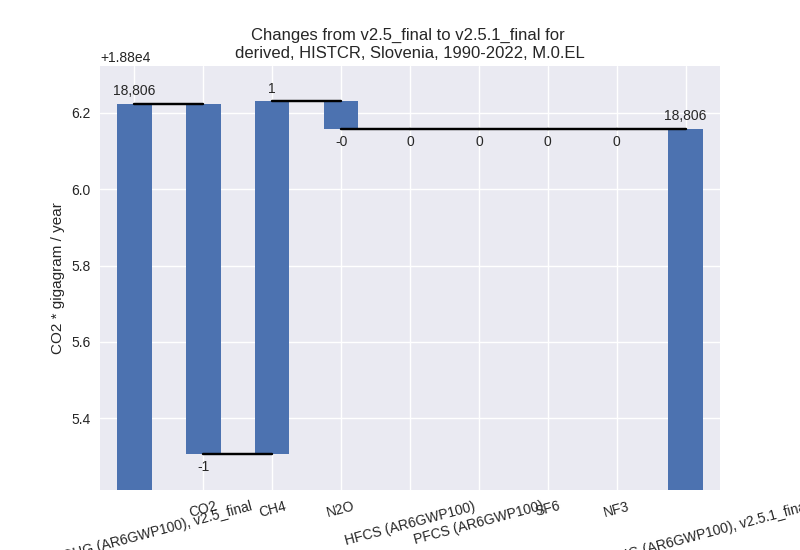
Changes by sector and gas
For each scenario and time frame the changes are displayed for all individual sectors and all individual gases. In the sector plot we use aggregate Kyoto GHGs in AR6GWP100. In the gas plot we usenational total emissions without LULUCF. ## country reported scenario
2022

1990-2022
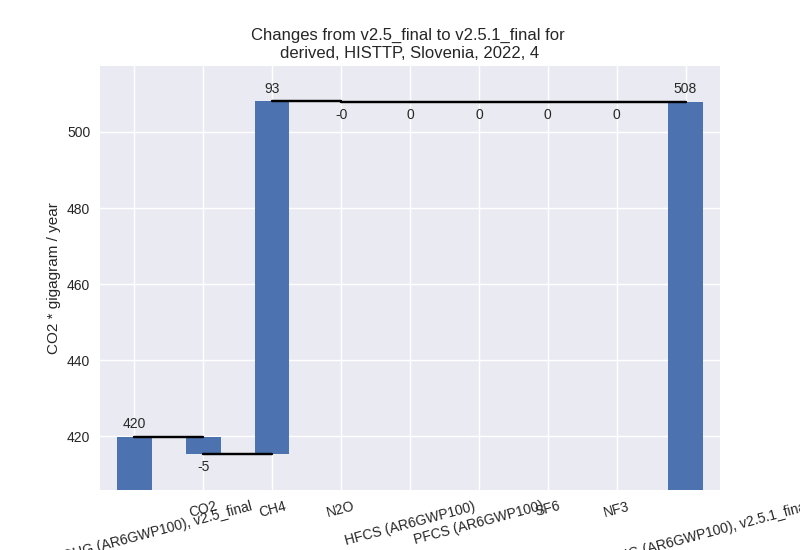
third party scenario
2022

1990-2022

Detailed changes for the scenarios:
country reported scenario (HISTCR):
Most important changes per time frame
For 2022 the following sector-gas combinations have the highest absolute impact on national total KyotoGHG (AR6GWP100) emissions in 2022 (top 5):
- 1: 2, CO2 with -21.63 Gg CO2 / year (-2.7%)
- 2: 1.B.1, CH4 with -13.94 Gg CO2 / year (-7.0%)
- 3: 4, CO2 with -13.06 Gg CO2 / year (-50.0%)
- 4: 3.A, CH4 with 13.05 Gg CO2 / year (1.0%)
- 5: 1.A, CH4 with 12.41 Gg CO2 / year (9.0%)
For 1990-2022 the following sector-gas combinations have the highest absolute impact on national total KyotoGHG (AR6GWP100) emissions in 1990-2022 (top 5):
- 1: 2, CO2 with -0.66 Gg CO2 / year (-0.1%)
- 2: 1.B.1, CH4 with -0.42 Gg CO2 / year (-0.1%)
- 3: 4, CO2 with -0.40 Gg CO2 / year (-4.4%)
- 4: 3.A, CH4 with 0.40 Gg CO2 / year (0.0%)
- 5: 1.A, CH4 with 0.38 Gg CO2 / year (0.2%)
Changes in the main sectors for aggregate KyotoGHG (AR6GWP100) are
- 1: Total sectoral emissions in 2022 are 12741.69 Gg CO2 / year which is 78.9% of M.0.EL emissions. 2022 Emissions have changed by 0.1% (15.17 Gg CO2 / year). 1990-2022 Emissions have changed by 0.0% (0.46 Gg CO2 / year).
- 2: Total sectoral emissions in 2022 are 1166.22 Gg
CO2 / year which is 7.2% of M.0.EL emissions. 2022 Emissions have
changed by -2.7% (-32.10 Gg CO2 /
year). 1990-2022 Emissions have changed by -0.1% (-0.97 Gg CO2 / year). For 2022 the
changes per gas
are:

- M.AG: Total sectoral emissions in 2022 are 1823.79 Gg CO2 / year which is 11.3% of M.0.EL emissions. 2022 Emissions have changed by 0.9% (16.87 Gg CO2 / year). 1990-2022 Emissions have changed by 0.0% (0.51 Gg CO2 / year).
- 4: Total sectoral emissions in 2022 are 410.51 Gg CO2 / year which is 2.5% of M.0.EL emissions. 2022 Emissions have changed by -0.5% (-2.10 Gg CO2 / year). 1990-2022 Emissions have changed by -0.0% (-0.06 Gg CO2 / year).
- 5: No data
third party scenario (HISTTP):
Most important changes per time frame
For 2022 the following sector-gas combinations have the highest absolute impact on national total KyotoGHG (AR6GWP100) emissions in 2022 (top 5):
- 1: 2, CO2 with -625.15 Gg CO2 / year (-46.9%)
- 2: 1.A, CO2 with 529.93 Gg CO2 / year (4.8%)
- 3: 1.B.2, CH4 with -431.18 Gg CO2 / year (-58.9%)
- 4: 1.B.1, CH4 with -98.45 Gg CO2 / year (-13.7%)
- 5: 4, CH4 with 92.74 Gg CO2 / year (25.7%)
For 1990-2022 the following sector-gas combinations have the highest absolute impact on national total KyotoGHG (AR6GWP100) emissions in 1990-2022 (top 5):
- 1: 2, CO2 with -812.70 Gg CO2 / year (-52.1%)
- 2: 1.B.2, CH4 with -252.11 Gg CO2 / year (-61.0%)
- 3: 1.A, CO2 with -65.40 Gg CO2 / year (-0.5%)
- 4: 1.B.1, CH4 with -20.75 Gg CO2 / year (-1.9%)
- 5: M.AG.ELV, N2O with 8.35 Gg CO2 / year (1.8%)
Changes in the main sectors for aggregate KyotoGHG (AR6GWP100) are
- 1: Total sectoral emissions in 2022 are 12817.50 Gg
CO2 / year which is 78.7% of M.0.EL emissions. 2022 Emissions have
changed by 0.1% (9.06 Gg CO2 /
year). 1990-2022 Emissions have changed by -2.1% (-337.76 Gg CO2 / year). For
1990-2022 the changes per gas
are:

The changes come from the following subsectors:- 1.A: Total sectoral emissions in 2022 are 11886.92
Gg CO2 / year which is 92.7% of category 1 emissions. 2022 Emissions
have changed by 4.8% (540.52 Gg CO2
/ year). 1990-2022 Emissions have changed by -0.5% (-64.52 Gg CO2 / year). For 2022 the
changes per gas
are:

There is no subsector information available in PRIMAP-hist. - 1.B.1: Total sectoral emissions in 2022 are 629.98
Gg CO2 / year which is 4.9% of category 1 emissions. 2022 Emissions have
changed by -13.7% (-100.29 Gg CO2 /
year). 1990-2022 Emissions have changed by -1.9% (-21.13 Gg CO2 / year). For 2022 the
changes per gas
are:

There is no subsector information available in PRIMAP-hist. - 1.B.2: Total sectoral emissions in 2022 are 300.59
Gg CO2 / year which is 2.3% of category 1 emissions. 2022 Emissions have
changed by -58.9% (-431.18 Gg CO2 /
year). 1990-2022 Emissions have changed by -61.0% (-252.11 Gg CO2 / year). For 2022
the changes per gas
are:
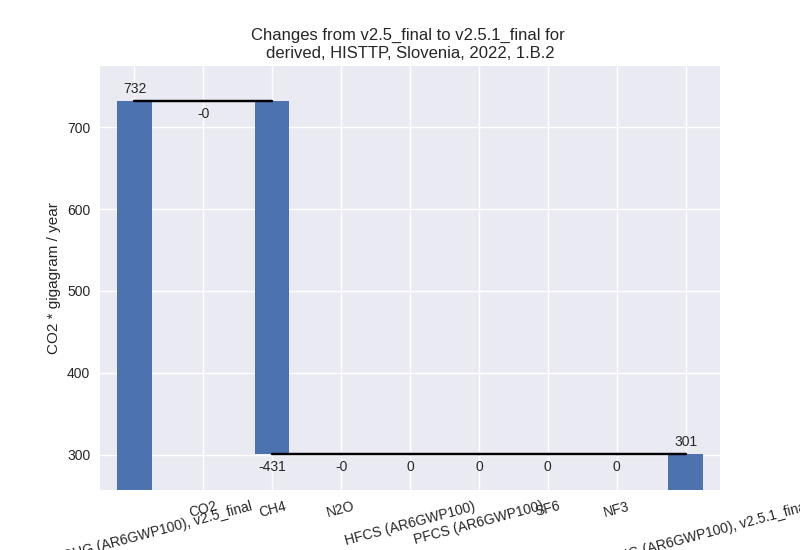
For 1990-2022 the changes per gas are:
There is no subsector information available in PRIMAP-hist.
- 1.A: Total sectoral emissions in 2022 are 11886.92
Gg CO2 / year which is 92.7% of category 1 emissions. 2022 Emissions
have changed by 4.8% (540.52 Gg CO2
/ year). 1990-2022 Emissions have changed by -0.5% (-64.52 Gg CO2 / year). For 2022 the
changes per gas
are:
- 2: Total sectoral emissions in 2022 are 1225.35 Gg
CO2 / year which is 7.5% of M.0.EL emissions. 2022 Emissions have
changed by -33.8% (-626.69 Gg CO2 /
year). 1990-2022 Emissions have changed by -35.8% (-812.71 Gg CO2 / year). For 2022
the changes per gas
are:

For 1990-2022 the changes per gas are: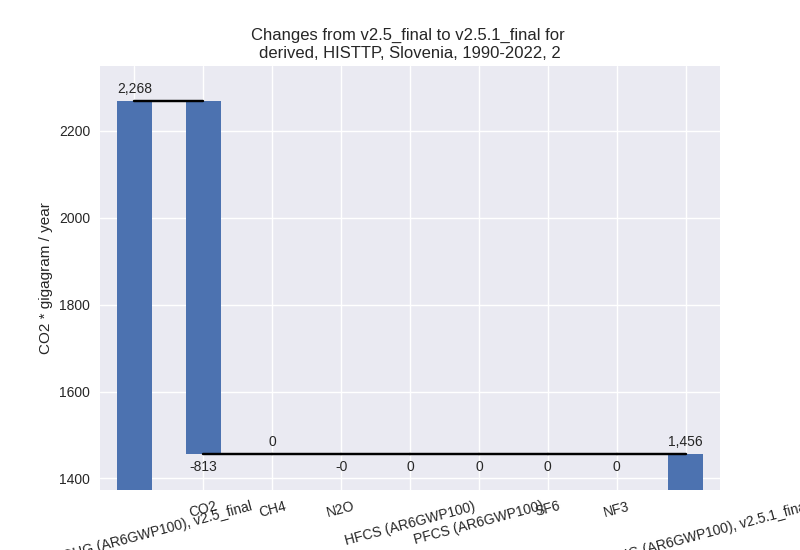
- M.AG: Total sectoral emissions in 2022 are 1699.66 Gg CO2 / year which is 10.4% of M.0.EL emissions. 2022 Emissions have changed by 1.8% (30.53 Gg CO2 / year). 1990-2022 Emissions have changed by 0.5% (9.69 Gg CO2 / year).
- 4: Total sectoral emissions in 2022 are 507.92 Gg
CO2 / year which is 3.1% of M.0.EL emissions. 2022 Emissions have
changed by 20.9% (87.98 Gg CO2 /
year). 1990-2022 Emissions have changed by 0.3% (2.67 Gg CO2 / year). For 2022 the
changes per gas
are:
- 5: Total sectoral emissions in 2022 are 37.40 Gg
CO2 / year which is 0.2% of M.0.EL emissions. 2022 Emissions have
changed by 17.0% (5.44 Gg CO2 /
year). 1990-2022 Emissions have changed by 0.3% (0.16 Gg CO2 / year). For 2022 the
changes per gas
are: