Changes in PRIMAP-hist v2.5.1_final compared to v2.5_final for Eswatini
2024-02-29
Johannes Gütschow
Change analysis for Eswatini for PRIMAP-hist v2.5.1_final compared to v2.5_final
Overview over emissions by sector and gas
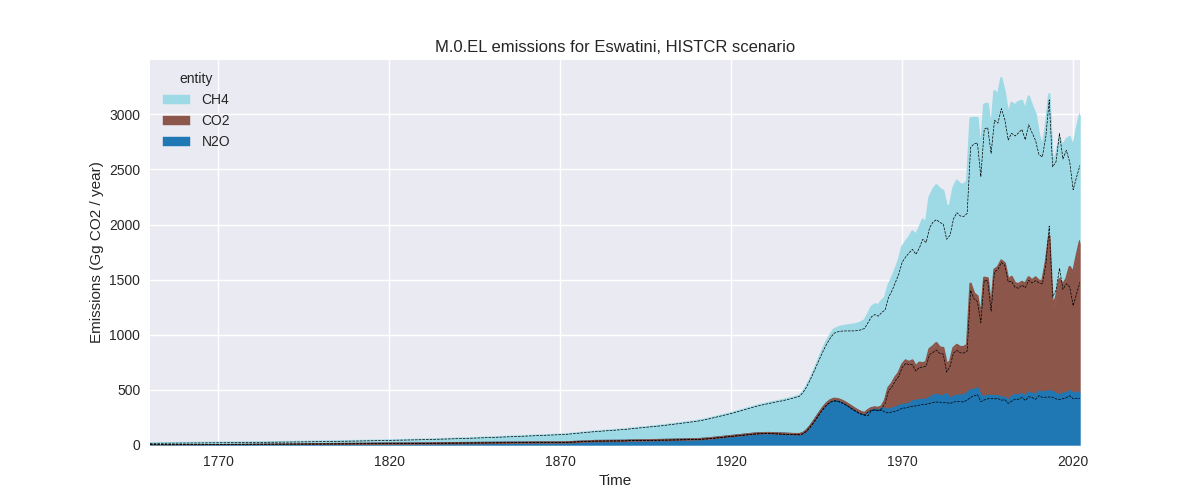
The following figures show the aggregate national total emissions excluding LULUCF AR6GWP100 for the country reported priority scenario. The dotted linesshow the v2.5_final data.


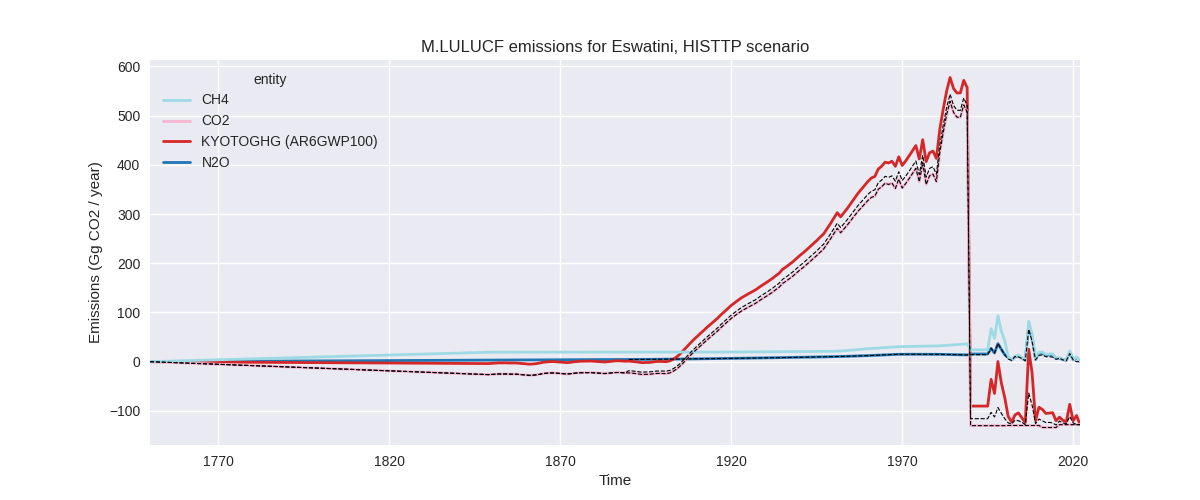
The following figures show the aggregate national total emissions excluding LULUCF AR6GWP100 for the third party priority scenario. The dotted linesshow the v2.5_final data.


Overview over changes
In the country reported priority scenario we have the following changes for aggregate Kyoto GHG and national total emissions excluding LULUCF (M.0.EL):
- Emissions in 2022 have changed by 18.1%% (459.27 Gg CO2 / year)
- Emissions in 1990-2022 have changed by 7.8%% (214.75 Gg CO2 / year)
In the third party priority scenario we have the following changes for aggregate Kyoto GHG and national total emissions excluding LULUCF (M.0.EL):
- Emissions in 2022 have changed by 18.1%% (459.27 Gg CO2 / year)
- Emissions in 1990-2022 have changed by 7.8%% (214.75 Gg CO2 / year)
Most important changes per scenario and time frame
In the country reported priority scenario the following sector-gas combinations have the highest absolute impact on national total KyotoGHG (AR6GWP100) emissions in 2022 (top 5):
- 1: 1.A, CO2 with 320.50 Gg CO2 / year (30.6%)
- 2: 1.B.1, CH4 with 110.20 Gg CO2 / year (135.1%)
- 3: 1.A, CH4 with -44.09 Gg CO2 / year (-27.9%)
- 4: M.AG.ELV, N2O with 35.10 Gg CO2 / year (10.3%)
- 5: 4, CH4 with 24.00 Gg CO2 / year (18.3%)
In the country reported priority scenario the following sector-gas combinations have the highest absolute impact on national total KyotoGHG (AR6GWP100) emissions in 1990-2022 (top 5):
- 1: 1.B.1, CH4 with 133.25 Gg CO2 / year (170.0%)
- 2: 1.A, CH4 with 34.17 Gg CO2 / year (28.7%)
- 3: M.AG.ELV, N2O with 27.14 Gg CO2 / year (7.8%)
- 4: 1.A, CO2 with 11.32 Gg CO2 / year (1.1%)
- 5: 1.A, N2O with 10.41 Gg CO2 / year (32.7%)
In the third party priority scenario the following sector-gas combinations have the highest absolute impact on national total KyotoGHG (AR6GWP100) emissions in 2022 (top 5):
- 1: 1.A, CO2 with 320.50 Gg CO2 / year (30.6%)
- 2: 1.B.1, CH4 with 110.20 Gg CO2 / year (135.1%)
- 3: 1.A, CH4 with -44.09 Gg CO2 / year (-27.9%)
- 4: M.AG.ELV, N2O with 35.10 Gg CO2 / year (10.3%)
- 5: 4, CH4 with 24.00 Gg CO2 / year (18.3%)
In the third party priority scenario the following sector-gas combinations have the highest absolute impact on national total KyotoGHG (AR6GWP100) emissions in 1990-2022 (top 5):
- 1: 1.B.1, CH4 with 133.25 Gg CO2 / year (170.0%)
- 2: 1.A, CH4 with 34.17 Gg CO2 / year (28.7%)
- 3: M.AG.ELV, N2O with 27.14 Gg CO2 / year (7.8%)
- 4: 1.A, CO2 with 11.32 Gg CO2 / year (1.1%)
- 5: 1.A, N2O with 10.41 Gg CO2 / year (32.7%)
Notes on data changes
Here we list notes explaining important emissions changes for the country. ’' means that the following text only applies to the TP time series, while means that it only applies to the CR scenario. Otherwise the note applies to both scenarios.
General note: We have no country reported data for Eswatini, thus CR and TP time-series are identical except for LULUCF.
- 1.A, CO2: CDIAC 2023 shows increasing emissions after 2017 which are not present in the regional EI data used in PRIMAP-hist v2.5. Thus emissions are higher in v2.5.1 for the last years.
- 1.B.1, CH4: EDGAR 8.0 emissions are much higher than EDGAR 7.0 emissions used in PRIMAP-hist v2.5
- 1.A, CH4: EDGAR 8.0 emissions are higher before 2009 and lower after 2009 leading to lower 2022 emissions and higher cumulative emissions.
- M.AG.ELV, N2O: FAO 2023 emissions are higher than older rleleases leading to higher 2022 and cumulative emissions in PRIMAP-hist v2.5.1.
Changes by sector and gas
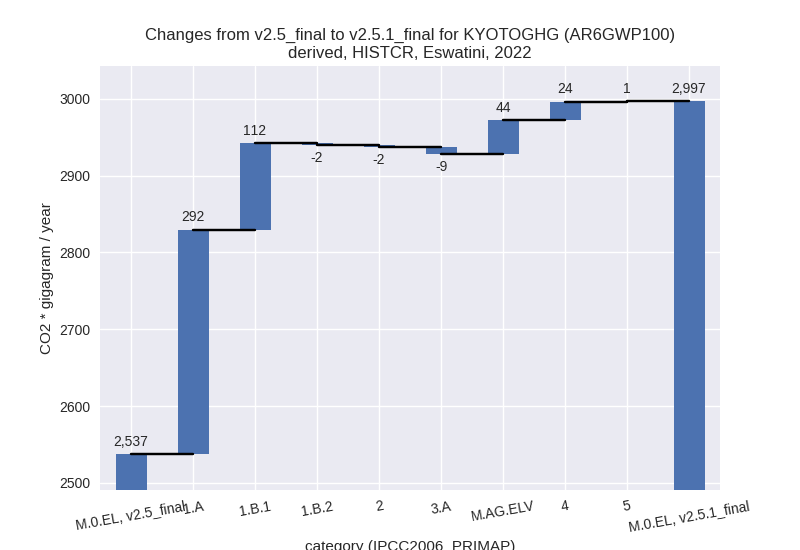
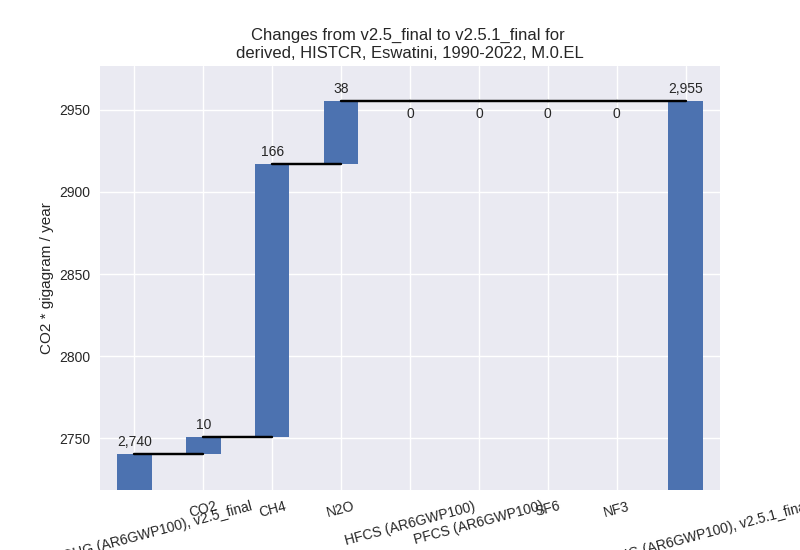
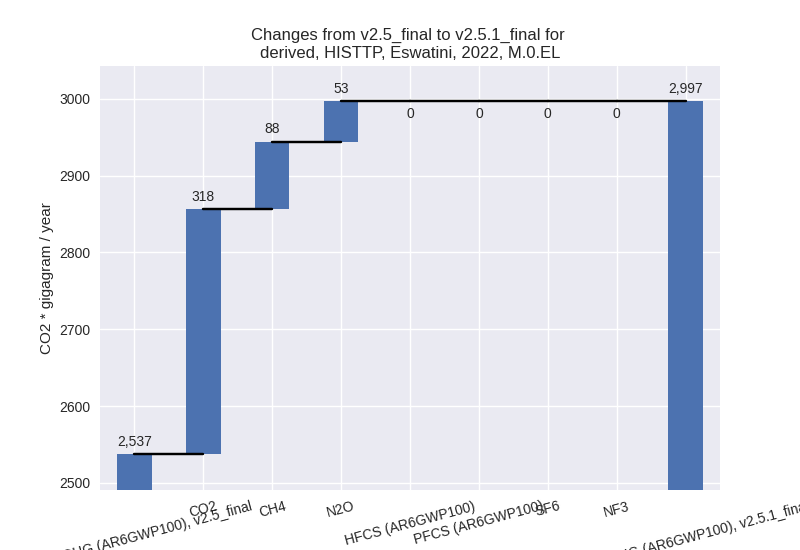
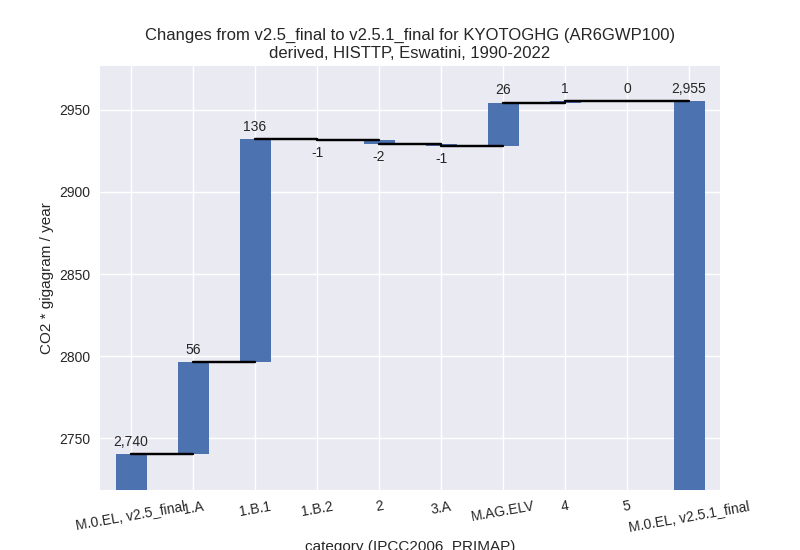
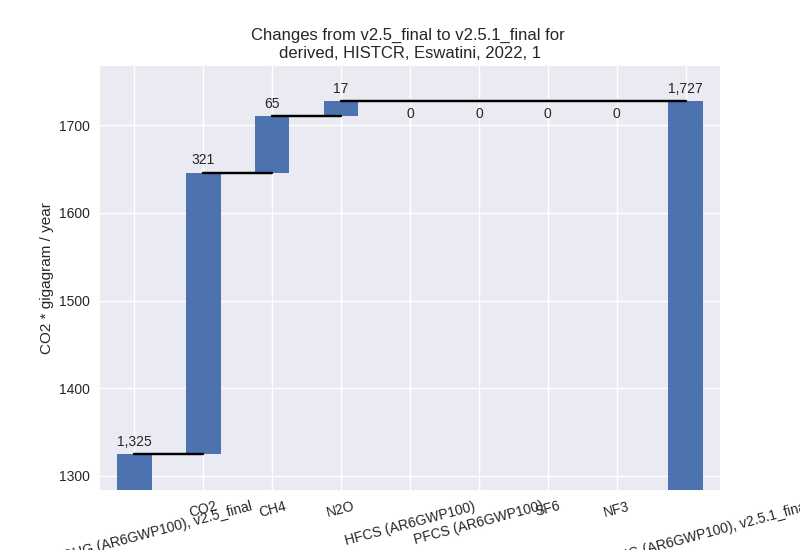
For each scenario and time frame the changes are displayed for all individual sectors and all individual gases. In the sector plot we use aggregate Kyoto GHGs in AR6GWP100. In the gas plot we usenational total emissions without LULUCF. ## country reported scenario
2022

1990-2022

third party scenario
2022

1990-2022

Detailed changes for the scenarios:
country reported scenario (HISTCR):
Most important changes per time frame
For 2022 the following sector-gas combinations have the highest absolute impact on national total KyotoGHG (AR6GWP100) emissions in 2022 (top 5):
- 1: 1.A, CO2 with 320.50 Gg CO2 / year (30.6%)
- 2: 1.B.1, CH4 with 110.20 Gg CO2 / year (135.1%)
- 3: 1.A, CH4 with -44.09 Gg CO2 / year (-27.9%)
- 4: M.AG.ELV, N2O with 35.10 Gg CO2 / year (10.3%)
- 5: 4, CH4 with 24.00 Gg CO2 / year (18.3%)
For 1990-2022 the following sector-gas combinations have the highest absolute impact on national total KyotoGHG (AR6GWP100) emissions in 1990-2022 (top 5):
- 1: 1.B.1, CH4 with 133.25 Gg CO2 / year (170.0%)
- 2: 1.A, CH4 with 34.17 Gg CO2 / year (28.7%)
- 3: M.AG.ELV, N2O with 27.14 Gg CO2 / year (7.8%)
- 4: 1.A, CO2 with 11.32 Gg CO2 / year (1.1%)
- 5: 1.A, N2O with 10.41 Gg CO2 / year (32.7%)
Changes in the main sectors for aggregate KyotoGHG (AR6GWP100) are
- 1: Total sectoral emissions in 2022 are 1727.36 Gg
CO2 / year which is 57.6% of M.0.EL emissions. 2022 Emissions have
changed by 30.4% (402.74 Gg CO2 /
year). 1990-2022 Emissions have changed by 15.1% (190.90 Gg CO2 / year). For 2022 the
changes per gas
are:
For 1990-2022 the changes per gas are: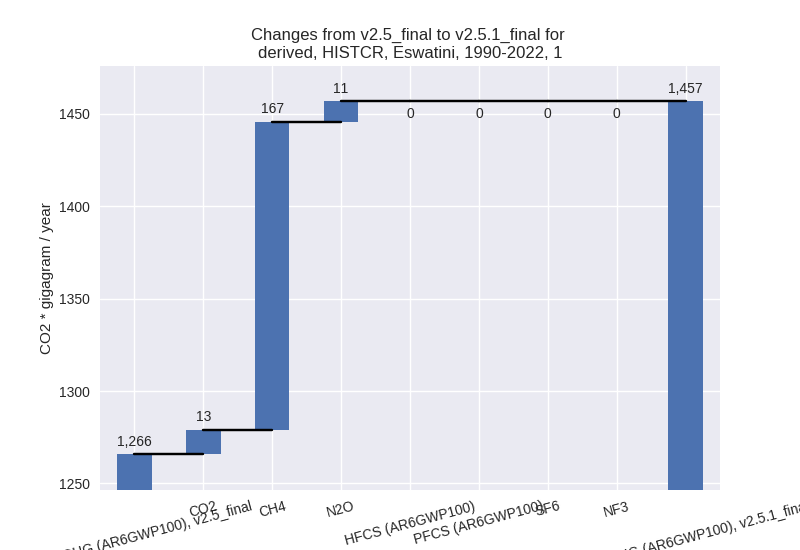
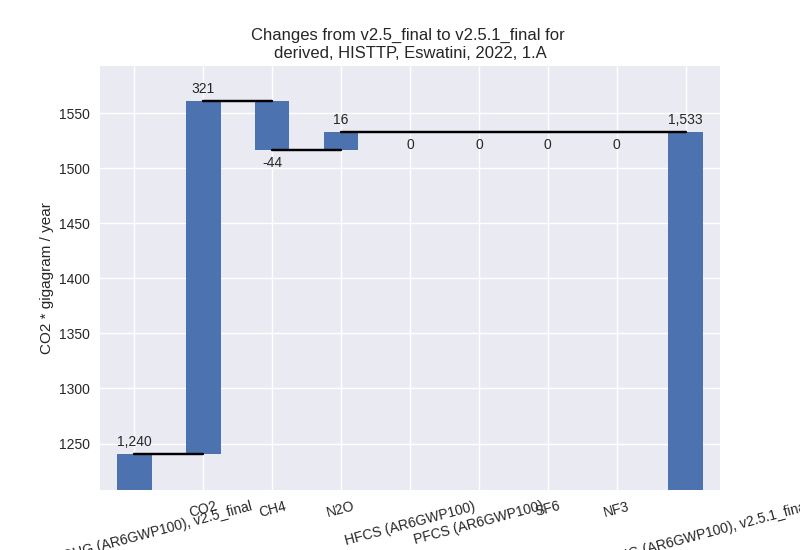
The changes come from the following subsectors:- 1.A: Total sectoral emissions in 2022 are 1532.56
Gg CO2 / year which is 88.7% of category 1 emissions. 2022 Emissions
have changed by 23.6% (292.28 Gg CO2
/ year). 1990-2022 Emissions have changed by 4.7% (55.89 Gg CO2 / year). For 2022 the
changes per gas
are:

For 1990-2022 the changes per gas are:
There is no subsector information available in PRIMAP-hist. - 1.B.1: Total sectoral emissions in 2022 are 194.79
Gg CO2 / year which is 11.3% of category 1 emissions. 2022 Emissions
have changed by 135.5% (112.08 Gg
CO2 / year). 1990-2022 Emissions have changed by 170.3% (135.83 Gg CO2 / year). For 2022
the changes per gas
are:

For 1990-2022 the changes per gas are:
There is no subsector information available in PRIMAP-hist. - 1.B.2: Total sectoral emissions in 2022 are nan Gg
CO2 / year which is nan% of category 1 emissions. 2022 Emissions have
changed by -100.0% (-1.63 Gg CO2 /
year). 1990-2022 Emissions have changed by -100.0% (-0.82 Gg CO2 / year). For 2022
the changes per gas
are:
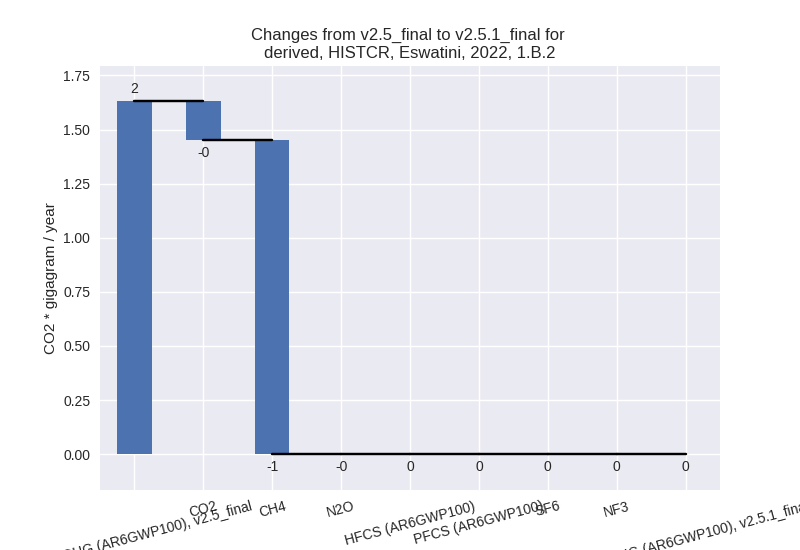
For 1990-2022 the changes per gas are: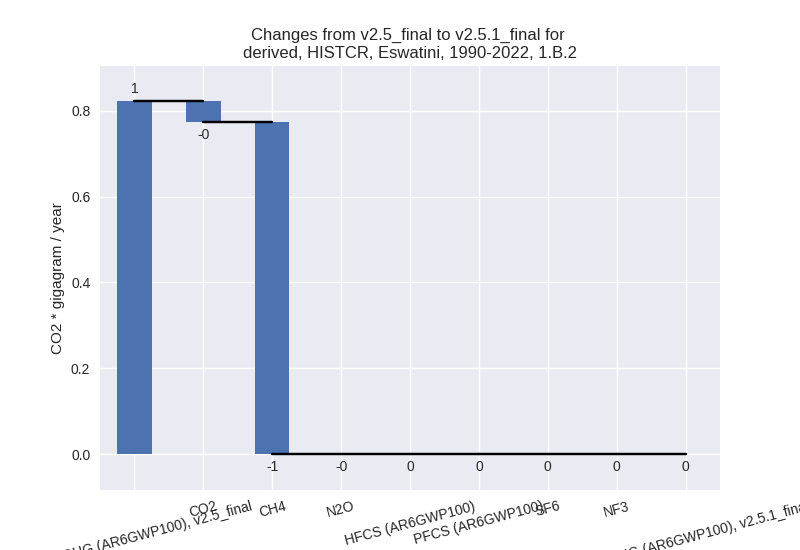
There is no subsector information available in PRIMAP-hist.
- 1.A: Total sectoral emissions in 2022 are 1532.56
Gg CO2 / year which is 88.7% of category 1 emissions. 2022 Emissions
have changed by 23.6% (292.28 Gg CO2
/ year). 1990-2022 Emissions have changed by 4.7% (55.89 Gg CO2 / year). For 2022 the
changes per gas
are:
- 2: Total sectoral emissions in 2022 are 11.12 Gg
CO2 / year which is 0.4% of M.0.EL emissions. 2022 Emissions have
changed by -17.8% (-2.41 Gg CO2 /
year). 1990-2022 Emissions have changed by -17.8% (-1.91 Gg CO2 / year). For 2022 the
changes per gas
are:

For 1990-2022 the changes per gas are:
- M.AG: Total sectoral emissions in 2022 are 1071.31
Gg CO2 / year which is 35.7% of M.0.EL emissions. 2022 Emissions have
changed by 3.3% (34.27 Gg CO2 /
year). 1990-2022 Emissions have changed by 2.4% (25.01 Gg CO2 / year). For 2022 the
changes per gas
are:

For 1990-2022 the changes per gas are: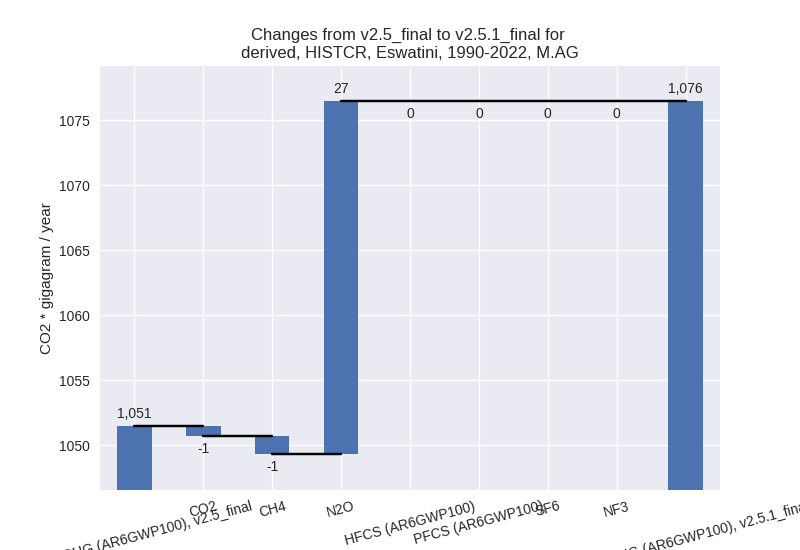
The changes come from the following subsectors:- 3.A: Total sectoral emissions in 2022 are 667.03 Gg CO2 / year which is 62.3% of category M.AG emissions. 2022 Emissions have changed by -1.4% (-9.40 Gg CO2 / year). 1990-2022 Emissions have changed by -0.2% (-1.45 Gg CO2 / year).
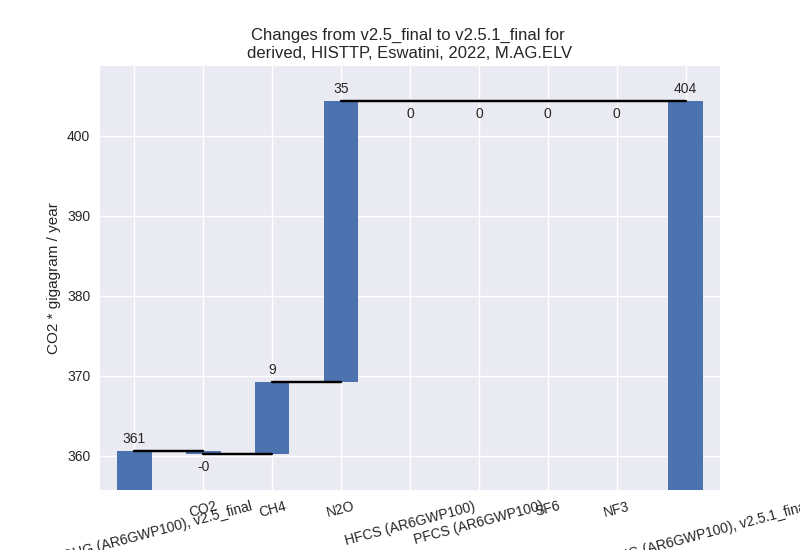
- M.AG.ELV: Total sectoral emissions in 2022 are
404.28 Gg CO2 / year which is 37.7% of category M.AG emissions. 2022
Emissions have changed by 12.1%
(43.67 Gg CO2 / year). 1990-2022 Emissions have changed by 7.1% (26.46 Gg CO2 / year). For 2022 the
changes per gas
are:

For 1990-2022 the changes per gas are:
There is no subsector information available in PRIMAP-hist.
- 4: Total sectoral emissions in 2022 are 169.15 Gg
CO2 / year which is 5.6% of M.0.EL emissions. 2022 Emissions have
changed by 16.4% (23.87 Gg CO2 /
year). 1990-2022 Emissions have changed by 0.2% (0.72 Gg CO2 / year). For 2022 the
changes per gas
are:

- 5: Total sectoral emissions in 2022 are 17.80 Gg
CO2 / year which is 0.6% of M.0.EL emissions. 2022 Emissions have
changed by 4.8% (0.81 Gg CO2 /
year). 1990-2022 Emissions have changed by 0.1% (0.02 Gg CO2 / year). For 2022 the
changes per gas
are:

third party scenario (HISTTP):
Most important changes per time frame
For 2022 the following sector-gas combinations have the highest absolute impact on national total KyotoGHG (AR6GWP100) emissions in 2022 (top 5):
- 1: 1.A, CO2 with 320.50 Gg CO2 / year (30.6%)
- 2: 1.B.1, CH4 with 110.20 Gg CO2 / year (135.1%)
- 3: 1.A, CH4 with -44.09 Gg CO2 / year (-27.9%)
- 4: M.AG.ELV, N2O with 35.10 Gg CO2 / year (10.3%)
- 5: 4, CH4 with 24.00 Gg CO2 / year (18.3%)
For 1990-2022 the following sector-gas combinations have the highest absolute impact on national total KyotoGHG (AR6GWP100) emissions in 1990-2022 (top 5):
- 1: 1.B.1, CH4 with 133.25 Gg CO2 / year (170.0%)
- 2: 1.A, CH4 with 34.17 Gg CO2 / year (28.7%)
- 3: M.AG.ELV, N2O with 27.14 Gg CO2 / year (7.8%)
- 4: 1.A, CO2 with 11.32 Gg CO2 / year (1.1%)
- 5: 1.A, N2O with 10.41 Gg CO2 / year (32.7%)
Changes in the main sectors for aggregate KyotoGHG (AR6GWP100) are
- 1: Total sectoral emissions in 2022 are 1727.36 Gg
CO2 / year which is 57.6% of M.0.EL emissions. 2022 Emissions have
changed by 30.4% (402.74 Gg CO2 /
year). 1990-2022 Emissions have changed by 15.1% (190.90 Gg CO2 / year). For 2022 the
changes per gas
are:

For 1990-2022 the changes per gas are:
The changes come from the following subsectors:- 1.A: Total sectoral emissions in 2022 are 1532.56
Gg CO2 / year which is 88.7% of category 1 emissions. 2022 Emissions
have changed by 23.6% (292.28 Gg CO2
/ year). 1990-2022 Emissions have changed by 4.7% (55.89 Gg CO2 / year). For 2022 the
changes per gas
are:
For 1990-2022 the changes per gas are:
There is no subsector information available in PRIMAP-hist. - 1.B.1: Total sectoral emissions in 2022 are 194.79
Gg CO2 / year which is 11.3% of category 1 emissions. 2022 Emissions
have changed by 135.5% (112.08 Gg
CO2 / year). 1990-2022 Emissions have changed by 170.3% (135.83 Gg CO2 / year). For 2022
the changes per gas
are:
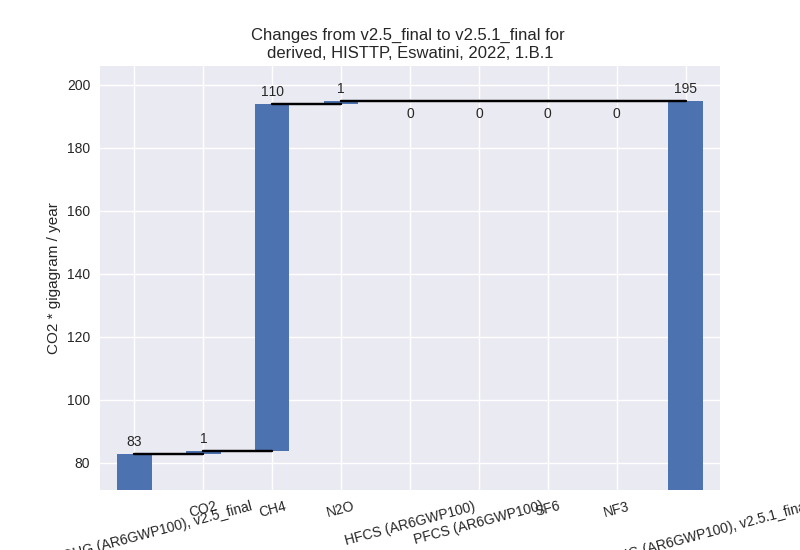
For 1990-2022 the changes per gas are:
There is no subsector information available in PRIMAP-hist. - 1.B.2: Total sectoral emissions in 2022 are nan Gg
CO2 / year which is nan% of category 1 emissions. 2022 Emissions have
changed by -100.0% (-1.63 Gg CO2 /
year). 1990-2022 Emissions have changed by -100.0% (-0.82 Gg CO2 / year). For 2022
the changes per gas
are:

For 1990-2022 the changes per gas are:
There is no subsector information available in PRIMAP-hist.
- 1.A: Total sectoral emissions in 2022 are 1532.56
Gg CO2 / year which is 88.7% of category 1 emissions. 2022 Emissions
have changed by 23.6% (292.28 Gg CO2
/ year). 1990-2022 Emissions have changed by 4.7% (55.89 Gg CO2 / year). For 2022 the
changes per gas
are:
- 2: Total sectoral emissions in 2022 are 11.12 Gg
CO2 / year which is 0.4% of M.0.EL emissions. 2022 Emissions have
changed by -17.8% (-2.41 Gg CO2 /
year). 1990-2022 Emissions have changed by -17.8% (-1.91 Gg CO2 / year). For 2022 the
changes per gas
are:

For 1990-2022 the changes per gas are: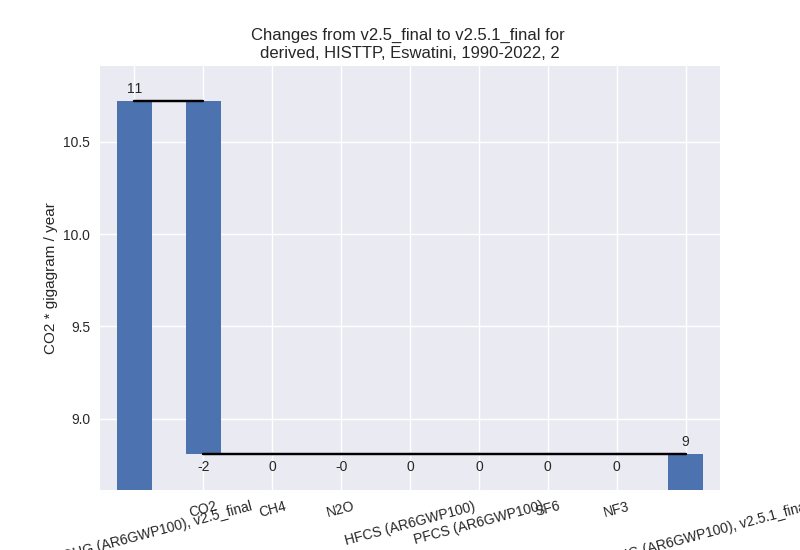
- M.AG: Total sectoral emissions in 2022 are 1071.31
Gg CO2 / year which is 35.7% of M.0.EL emissions. 2022 Emissions have
changed by 3.3% (34.27 Gg CO2 /
year). 1990-2022 Emissions have changed by 2.4% (25.01 Gg CO2 / year). For 2022 the
changes per gas
are:

For 1990-2022 the changes per gas are:
The changes come from the following subsectors:- 3.A: Total sectoral emissions in 2022 are 667.03 Gg CO2 / year which is 62.3% of category M.AG emissions. 2022 Emissions have changed by -1.4% (-9.40 Gg CO2 / year). 1990-2022 Emissions have changed by -0.2% (-1.45 Gg CO2 / year).
- M.AG.ELV: Total sectoral emissions in 2022 are
404.28 Gg CO2 / year which is 37.7% of category M.AG emissions. 2022
Emissions have changed by 12.1%
(43.67 Gg CO2 / year). 1990-2022 Emissions have changed by 7.1% (26.46 Gg CO2 / year). For 2022 the
changes per gas
are:
For 1990-2022 the changes per gas are: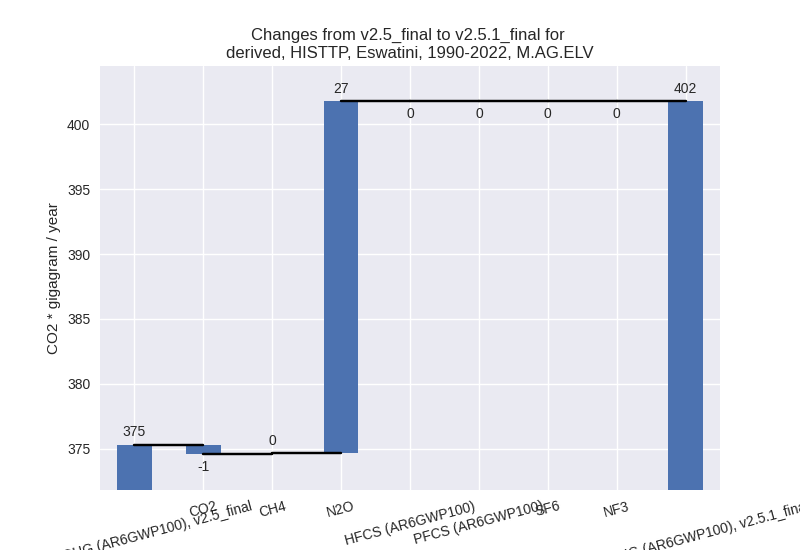
There is no subsector information available in PRIMAP-hist.
- 4: Total sectoral emissions in 2022 are 169.15 Gg
CO2 / year which is 5.6% of M.0.EL emissions. 2022 Emissions have
changed by 16.4% (23.87 Gg CO2 /
year). 1990-2022 Emissions have changed by 0.2% (0.72 Gg CO2 / year). For 2022 the
changes per gas
are:

- 5: Total sectoral emissions in 2022 are 17.80 Gg
CO2 / year which is 0.6% of M.0.EL emissions. 2022 Emissions have
changed by 4.8% (0.81 Gg CO2 /
year). 1990-2022 Emissions have changed by 0.1% (0.02 Gg CO2 / year). For 2022 the
changes per gas
are:
