Changes in PRIMAP-hist v2.5.1_final compared to v2.5_final for Seychelles
2024-02-29
Johannes Gütschow
Change analysis for Seychelles for PRIMAP-hist v2.5.1_final compared to v2.5_final
Overview over emissions by sector and gas
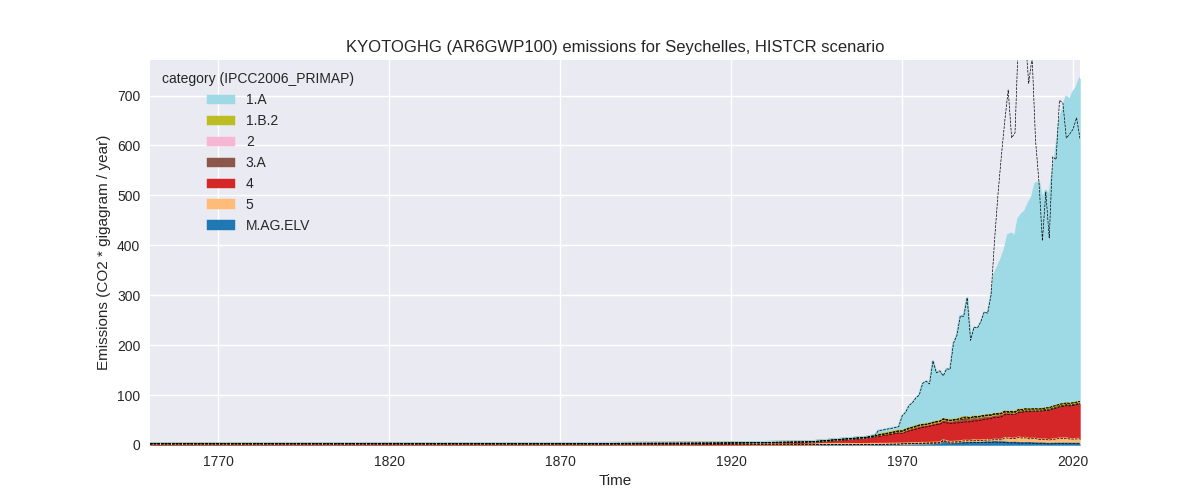
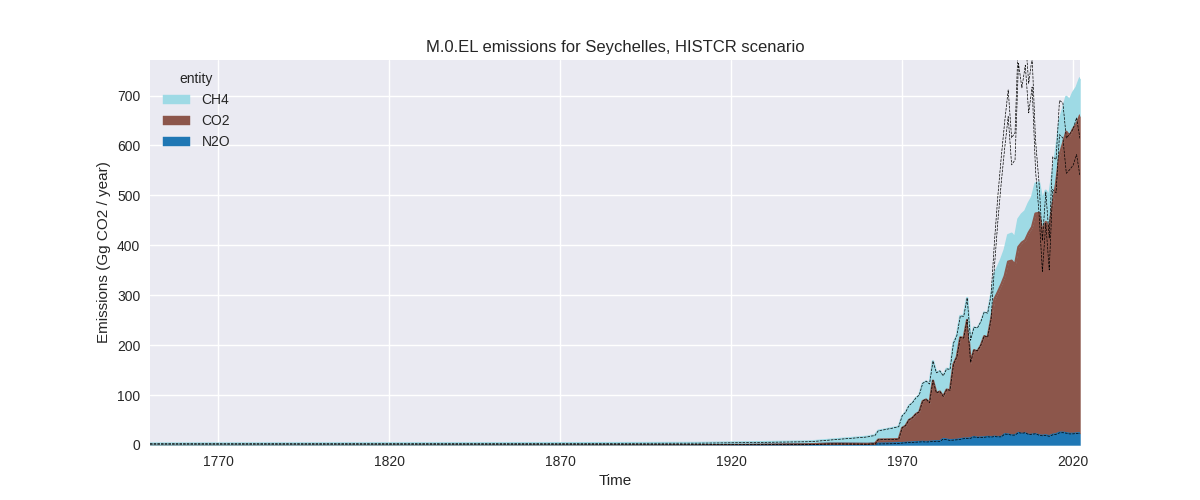
The following figures show the aggregate national total emissions excluding LULUCF AR6GWP100 for the country reported priority scenario. The dotted linesshow the v2.5_final data.

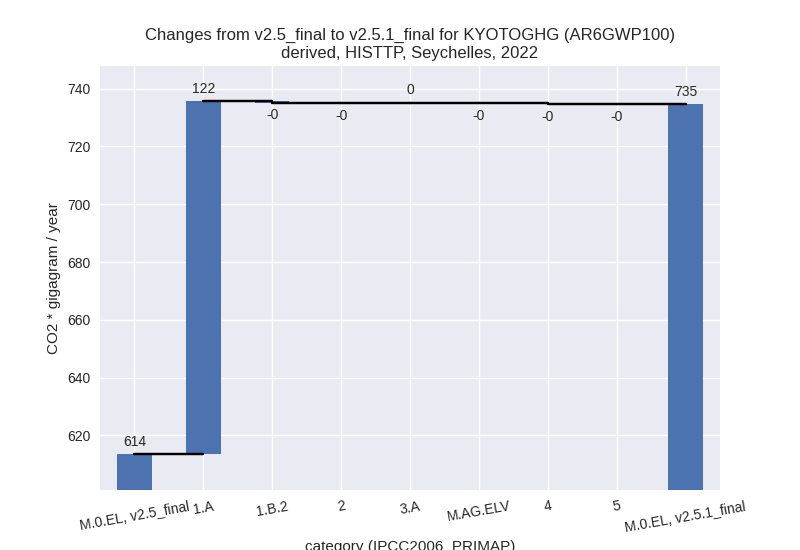
The following figures show the aggregate national total emissions excluding LULUCF AR6GWP100 for the third party priority scenario. The dotted linesshow the v2.5_final data.


Overview over changes
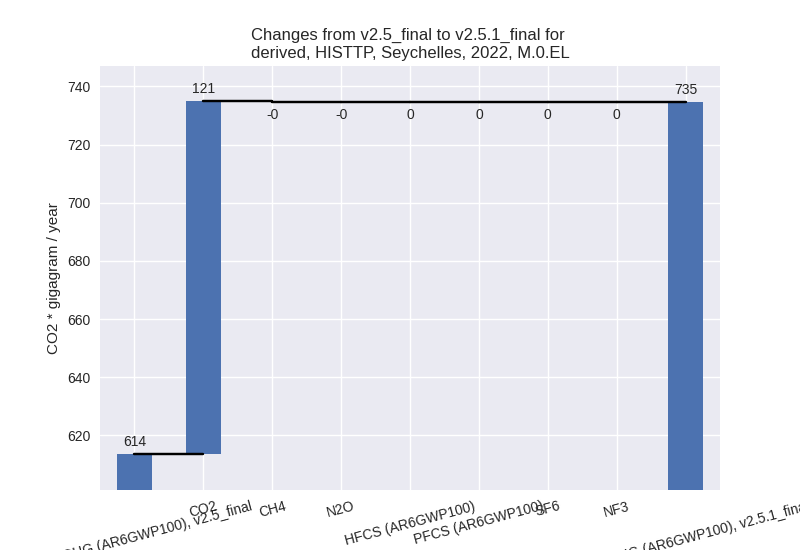
In the country reported priority scenario we have the following changes for aggregate Kyoto GHG and national total emissions excluding LULUCF (M.0.EL):
- Emissions in 2022 have changed by 19.7%% (121.02 Gg CO2 / year)
- Emissions in 1990-2022 have changed by -14.0%% (-76.18 Gg CO2 / year)
In the third party priority scenario we have the following changes for aggregate Kyoto GHG and national total emissions excluding LULUCF (M.0.EL):
- Emissions in 2022 have changed by 19.7%% (121.02 Gg CO2 / year)
- Emissions in 1990-2022 have changed by -14.0%% (-76.18 Gg CO2 / year)
Most important changes per scenario and time frame
In the country reported priority scenario the following sector-gas combinations have the highest absolute impact on national total KyotoGHG (AR6GWP100) emissions in 2022 (top 5):
- 1: 1.A, CO2 with 122.25 Gg CO2 / year (23.9%)
- 2: M.AG.ELV, CO2 with -0.61 Gg CO2 / year (-100.0%)
- 3: M.AG.ELV, N2O with 0.45 Gg CO2 / year (28.1%)
- 4: 1.B.2, CH4 with -0.42 Gg CO2 / year (-99.6%)
- 5: 2, CO2 with -0.30 Gg CO2 / year (-9.1%)
In the country reported priority scenario the following sector-gas combinations have the highest absolute impact on national total KyotoGHG (AR6GWP100) emissions in 1990-2022 (top 5):
- 1: 1.A, CO2 with -74.79 Gg CO2 / year (-16.2%)
- 2: M.AG.ELV, CO2 with -0.45 Gg CO2 / year (-100.0%)
- 3: 1.A, N2O with -0.45 Gg CO2 / year (-6.6%)
- 4: 2, CO2 with -0.32 Gg CO2 / year (-14.9%)
- 5: 1.A, CH4 with -0.10 Gg CO2 / year (-2.9%)
In the third party priority scenario the following sector-gas combinations have the highest absolute impact on national total KyotoGHG (AR6GWP100) emissions in 2022 (top 5):
- 1: 1.A, CO2 with 122.25 Gg CO2 / year (23.9%)
- 2: M.AG.ELV, CO2 with -0.61 Gg CO2 / year (-100.0%)
- 3: M.AG.ELV, N2O with 0.45 Gg CO2 / year (28.1%)
- 4: 1.B.2, CH4 with -0.42 Gg CO2 / year (-99.6%)
- 5: 2, CO2 with -0.30 Gg CO2 / year (-9.1%)
In the third party priority scenario the following sector-gas combinations have the highest absolute impact on national total KyotoGHG (AR6GWP100) emissions in 1990-2022 (top 5):
- 1: 1.A, CO2 with -74.79 Gg CO2 / year (-16.2%)
- 2: M.AG.ELV, CO2 with -0.45 Gg CO2 / year (-100.0%)
- 3: 1.A, N2O with -0.45 Gg CO2 / year (-6.6%)
- 4: 2, CO2 with -0.32 Gg CO2 / year (-14.9%)
- 5: 1.A, CH4 with -0.10 Gg CO2 / year (-2.9%)
Notes on data changes
Here we list notes explaining important emissions changes for the country. ’' means that the following text only applies to the TP time series, while means that it only applies to the CR scenario. Otherwise the note applies to both scenarios.
- 1.A, CO2: CDIAC 2023 data differs from older releases especially for the period 1997 to 2009, but also to a lesser extend for later years. While 2022 emissions are higher in PRIMAP-hist v2.5.1. cumulative emissions are lower due to the lower 1997-2009 emissions.
- M.AG.ELV, CO2: No data available in FAO and also not in EDGAR 8.0 and in consequence PRIMAP-hist v2.5.1 has no emissions. EDGAR 7.0 used in PRIMAP-hist v2.5 has data.
- M.AG.ELV, N2O: FAO 2023 emissions are a bit higher for the latest years.
- 1.A, N2O: EDGAR 8.0 emissions are lower in the period of 1988-2010 leading to lower emissions in PRIMAP-hist.
Changes by sector and gas
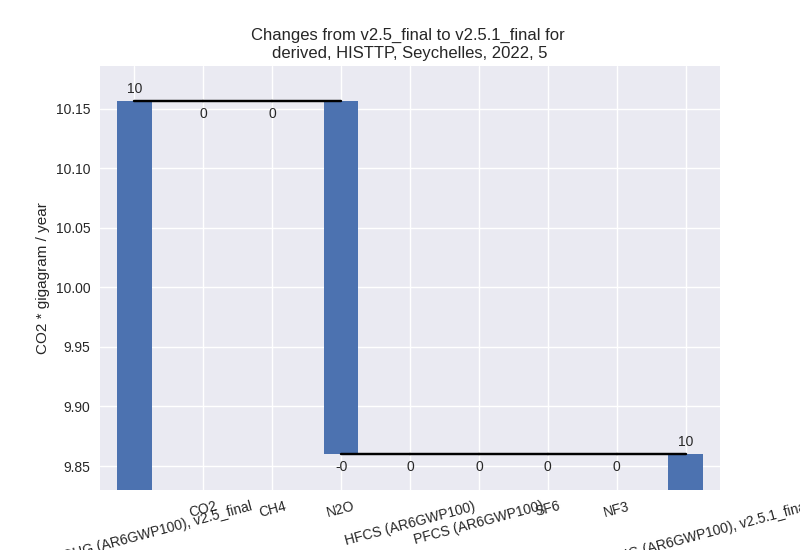
For each scenario and time frame the changes are displayed for all individual sectors and all individual gases. In the sector plot we use aggregate Kyoto GHGs in AR6GWP100. In the gas plot we usenational total emissions without LULUCF. ## country reported scenario
2022


1990-2022


third party scenario
2022
1990-2022


Detailed changes for the scenarios:
country reported scenario (HISTCR):
Most important changes per time frame
For 2022 the following sector-gas combinations have the highest absolute impact on national total KyotoGHG (AR6GWP100) emissions in 2022 (top 5):
- 1: 1.A, CO2 with 122.25 Gg CO2 / year (23.9%)
- 2: M.AG.ELV, CO2 with -0.61 Gg CO2 / year (-100.0%)
- 3: M.AG.ELV, N2O with 0.45 Gg CO2 / year (28.1%)
- 4: 1.B.2, CH4 with -0.42 Gg CO2 / year (-99.6%)
- 5: 2, CO2 with -0.30 Gg CO2 / year (-9.1%)
For 1990-2022 the following sector-gas combinations have the highest absolute impact on national total KyotoGHG (AR6GWP100) emissions in 1990-2022 (top 5):
- 1: 1.A, CO2 with -74.79 Gg CO2 / year (-16.2%)
- 2: M.AG.ELV, CO2 with -0.45 Gg CO2 / year (-100.0%)
- 3: 1.A, N2O with -0.45 Gg CO2 / year (-6.6%)
- 4: 2, CO2 with -0.32 Gg CO2 / year (-14.9%)
- 5: 1.A, CH4 with -0.10 Gg CO2 / year (-2.9%)
Changes in the main sectors for aggregate KyotoGHG (AR6GWP100) are
- 1: Total sectoral emissions in 2022 are 648.29 Gg
CO2 / year which is 88.3% of M.0.EL emissions. 2022 Emissions have
changed by 23.1% (121.68 Gg CO2 /
year). 1990-2022 Emissions have changed by -16.0% (-75.43 Gg CO2 / year). For 2022
the changes per gas
are:

For 1990-2022 the changes per gas are: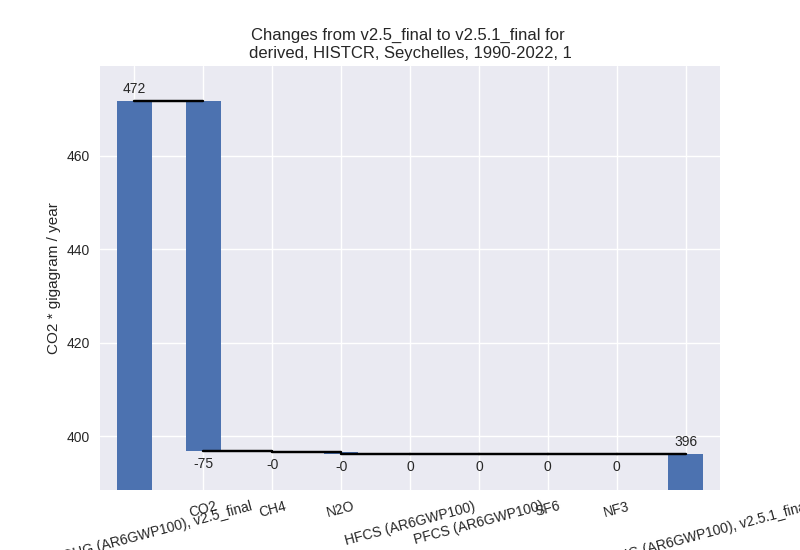
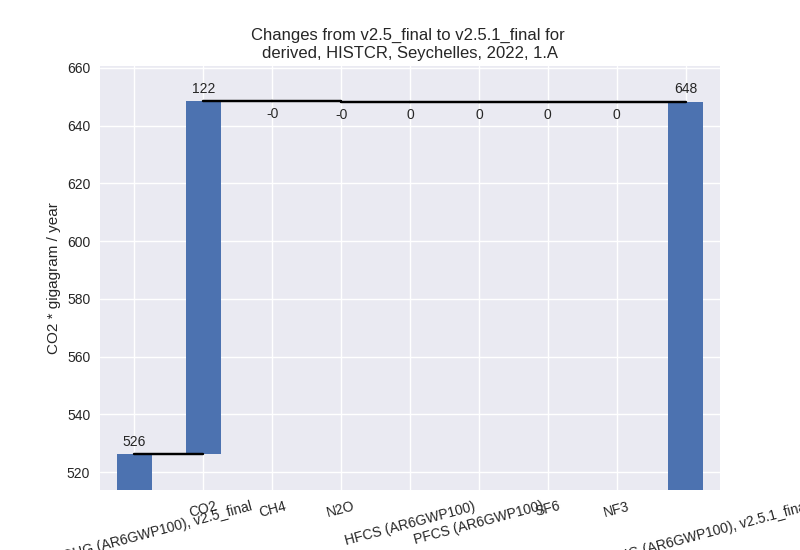
The changes come from the following subsectors:- 1.A: Total sectoral emissions in 2022 are 648.29 Gg
CO2 / year which is 100.0% of category 1 emissions. 2022 Emissions have
changed by 23.2% (122.10 Gg CO2 /
year). 1990-2022 Emissions have changed by -16.0% (-75.34 Gg CO2 / year). For 2022
the changes per gas
are:
For 1990-2022 the changes per gas are:
There is no subsector information available in PRIMAP-hist. - 1.B.2: Total sectoral emissions in 2022 are 0.00 Gg
CO2 / year which is 0.0% of category 1 emissions. 2022 Emissions have
changed by -99.6% (-0.42 Gg CO2 /
year). 1990-2022 Emissions have changed by -97.6% (-0.09 Gg CO2 / year). For 2022 the
changes per gas
are:

For 1990-2022 the changes per gas are:
There is no subsector information available in PRIMAP-hist.
- 1.A: Total sectoral emissions in 2022 are 648.29 Gg
CO2 / year which is 100.0% of category 1 emissions. 2022 Emissions have
changed by 23.2% (122.10 Gg CO2 /
year). 1990-2022 Emissions have changed by -16.0% (-75.34 Gg CO2 / year). For 2022
the changes per gas
are:
- 2: Total sectoral emissions in 2022 are 2.98 Gg CO2
/ year which is 0.4% of M.0.EL emissions. 2022 Emissions have changed by
-9.1% (-0.30 Gg CO2 / year).
1990-2022 Emissions have changed by -14.9% (-0.32 Gg CO2 / year). For 2022 the
changes per gas
are:
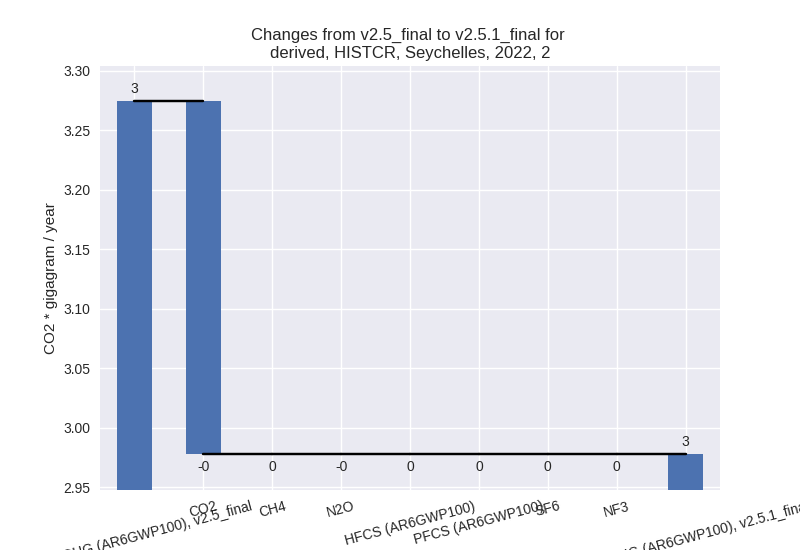
For 1990-2022 the changes per gas are:
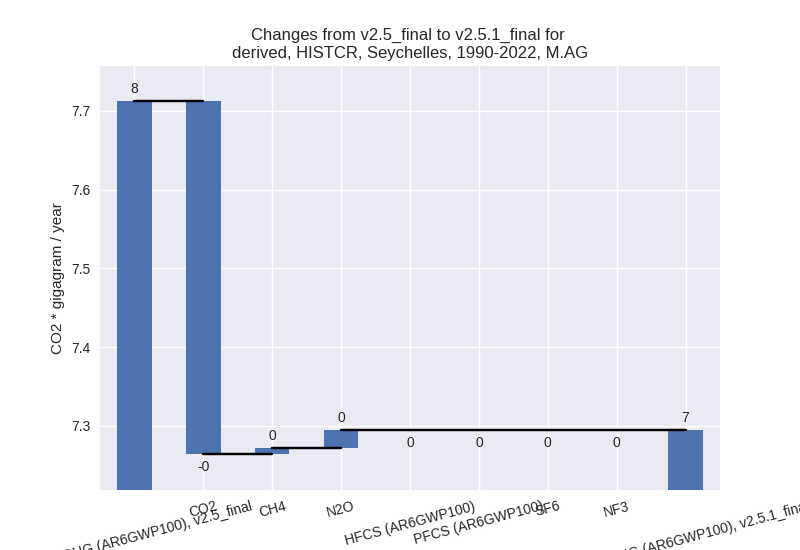
- M.AG: Total sectoral emissions in 2022 are 4.11 Gg
CO2 / year which is 0.6% of M.0.EL emissions. 2022 Emissions have
changed by 0.2% (0.01 Gg CO2 /
year). 1990-2022 Emissions have changed by -5.4% (-0.42 Gg CO2 / year). For 1990-2022
the changes per gas
are:
The changes come from the following subsectors:- 3.A: Total sectoral emissions in 2022 are 2.08 Gg
CO2 / year which is 50.6% of category M.AG emissions. 2022 Emissions
have changed by 9.1% (0.17 Gg CO2 /
year). 1990-2022 Emissions have changed by 0.2% (0.01 Gg CO2 / year). For 2022 the
changes per gas
are:

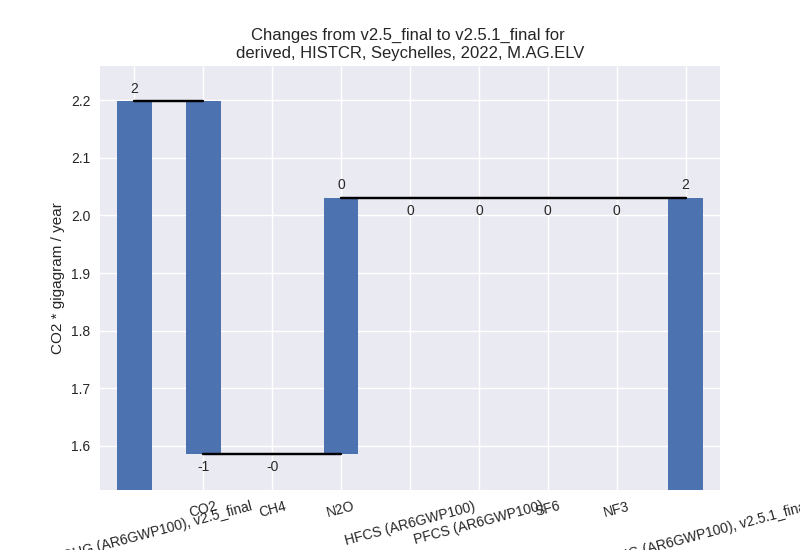
There is no subsector information available in PRIMAP-hist. - M.AG.ELV: Total sectoral emissions in 2022 are 2.03
Gg CO2 / year which is 49.4% of category M.AG emissions. 2022 Emissions
have changed by -7.6% (-0.17 Gg CO2
/ year). 1990-2022 Emissions have changed by -11.1% (-0.42 Gg CO2 / year). For 2022 the
changes per gas
are:
For 1990-2022 the changes per gas are: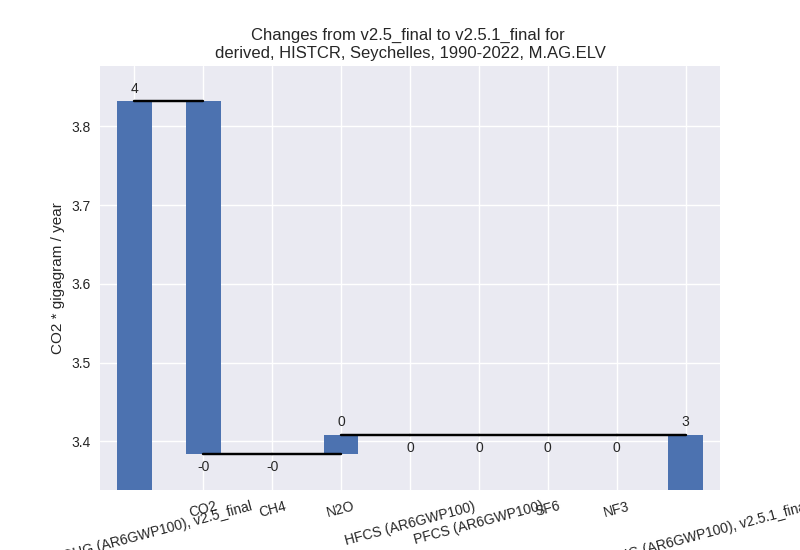
There is no subsector information available in PRIMAP-hist.
- 3.A: Total sectoral emissions in 2022 are 2.08 Gg
CO2 / year which is 50.6% of category M.AG emissions. 2022 Emissions
have changed by 9.1% (0.17 Gg CO2 /
year). 1990-2022 Emissions have changed by 0.2% (0.01 Gg CO2 / year). For 2022 the
changes per gas
are:
- 4: Total sectoral emissions in 2022 are 69.31 Gg CO2 / year which is 9.4% of M.0.EL emissions. 2022 Emissions have changed by -0.1% (-0.07 Gg CO2 / year). 1990-2022 Emissions have changed by -0.0% (-0.00 Gg CO2 / year).
- 5: Total sectoral emissions in 2022 are 9.86 Gg CO2
/ year which is 1.3% of M.0.EL emissions. 2022 Emissions have changed by
-2.9% (-0.30 Gg CO2 / year).
1990-2022 Emissions have changed by -0.1% (-0.01 Gg CO2 / year). For 2022 the
changes per gas
are:

third party scenario (HISTTP):
Most important changes per time frame
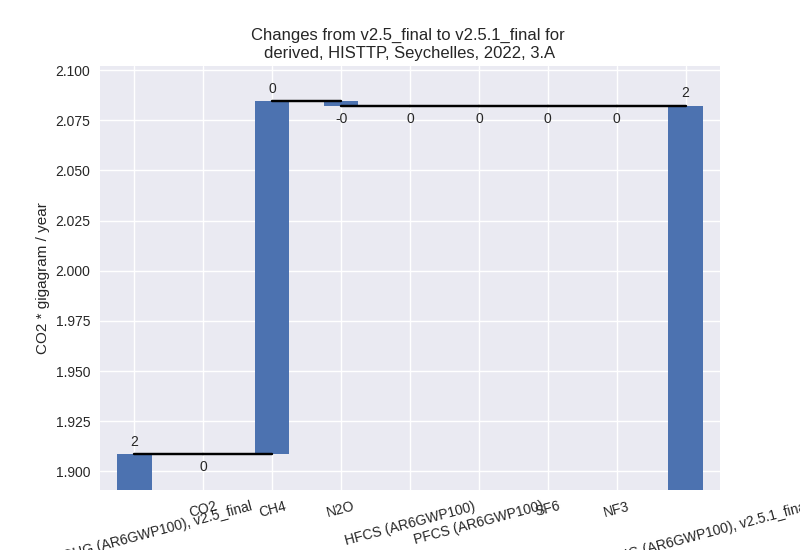
For 2022 the following sector-gas combinations have the highest absolute impact on national total KyotoGHG (AR6GWP100) emissions in 2022 (top 5):
- 1: 1.A, CO2 with 122.25 Gg CO2 / year (23.9%)
- 2: M.AG.ELV, CO2 with -0.61 Gg CO2 / year (-100.0%)
- 3: M.AG.ELV, N2O with 0.45 Gg CO2 / year (28.1%)
- 4: 1.B.2, CH4 with -0.42 Gg CO2 / year (-99.6%)
- 5: 2, CO2 with -0.30 Gg CO2 / year (-9.1%)
For 1990-2022 the following sector-gas combinations have the highest absolute impact on national total KyotoGHG (AR6GWP100) emissions in 1990-2022 (top 5):
- 1: 1.A, CO2 with -74.79 Gg CO2 / year (-16.2%)
- 2: M.AG.ELV, CO2 with -0.45 Gg CO2 / year (-100.0%)
- 3: 1.A, N2O with -0.45 Gg CO2 / year (-6.6%)
- 4: 2, CO2 with -0.32 Gg CO2 / year (-14.9%)
- 5: 1.A, CH4 with -0.10 Gg CO2 / year (-2.9%)
Changes in the main sectors for aggregate KyotoGHG (AR6GWP100) are
- 1: Total sectoral emissions in 2022 are 648.29 Gg
CO2 / year which is 88.3% of M.0.EL emissions. 2022 Emissions have
changed by 23.1% (121.68 Gg CO2 /
year). 1990-2022 Emissions have changed by -16.0% (-75.43 Gg CO2 / year). For 2022
the changes per gas
are:
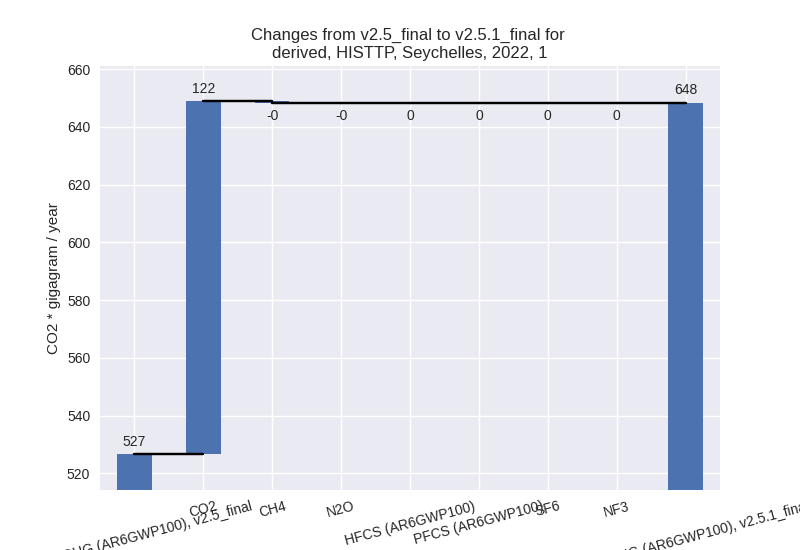
For 1990-2022 the changes per gas are:
The changes come from the following subsectors:- 1.A: Total sectoral emissions in 2022 are 648.29 Gg
CO2 / year which is 100.0% of category 1 emissions. 2022 Emissions have
changed by 23.2% (122.10 Gg CO2 /
year). 1990-2022 Emissions have changed by -16.0% (-75.34 Gg CO2 / year). For 2022
the changes per gas
are:

For 1990-2022 the changes per gas are:
There is no subsector information available in PRIMAP-hist. - 1.B.2: Total sectoral emissions in 2022 are 0.00 Gg
CO2 / year which is 0.0% of category 1 emissions. 2022 Emissions have
changed by -99.6% (-0.42 Gg CO2 /
year). 1990-2022 Emissions have changed by -97.6% (-0.09 Gg CO2 / year). For 2022 the
changes per gas
are:
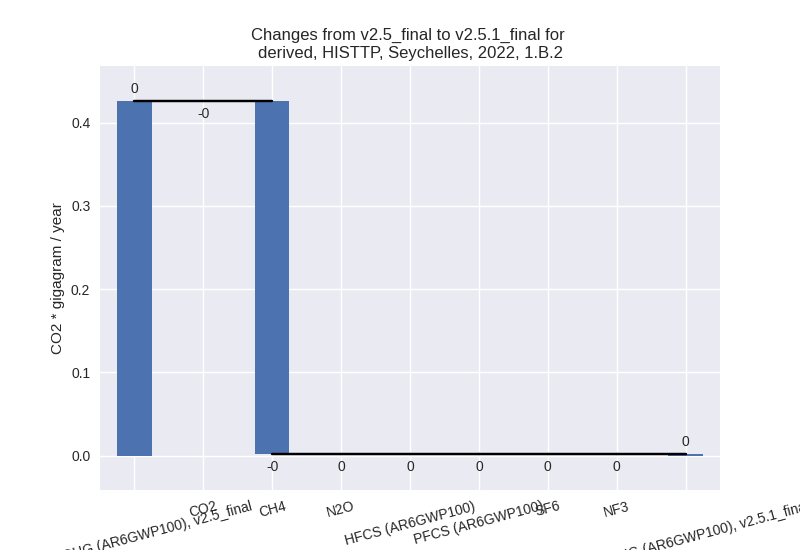
For 1990-2022 the changes per gas are: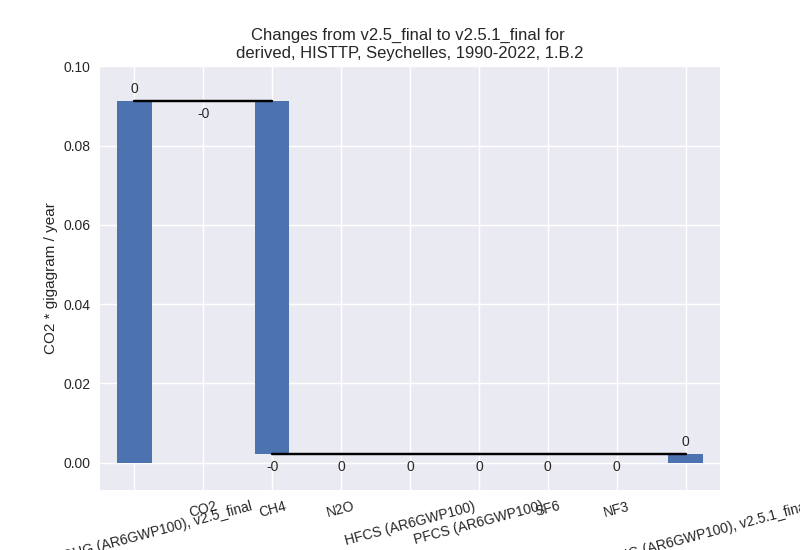
There is no subsector information available in PRIMAP-hist.
- 1.A: Total sectoral emissions in 2022 are 648.29 Gg
CO2 / year which is 100.0% of category 1 emissions. 2022 Emissions have
changed by 23.2% (122.10 Gg CO2 /
year). 1990-2022 Emissions have changed by -16.0% (-75.34 Gg CO2 / year). For 2022
the changes per gas
are:
- 2: Total sectoral emissions in 2022 are 2.98 Gg CO2
/ year which is 0.4% of M.0.EL emissions. 2022 Emissions have changed by
-9.1% (-0.30 Gg CO2 / year).
1990-2022 Emissions have changed by -14.9% (-0.32 Gg CO2 / year). For 2022 the
changes per gas
are:

For 1990-2022 the changes per gas are:
- M.AG: Total sectoral emissions in 2022 are 4.11 Gg
CO2 / year which is 0.6% of M.0.EL emissions. 2022 Emissions have
changed by 0.2% (0.01 Gg CO2 /
year). 1990-2022 Emissions have changed by -5.4% (-0.42 Gg CO2 / year). For 1990-2022
the changes per gas
are:

The changes come from the following subsectors:- 3.A: Total sectoral emissions in 2022 are 2.08 Gg
CO2 / year which is 50.6% of category M.AG emissions. 2022 Emissions
have changed by 9.1% (0.17 Gg CO2 /
year). 1990-2022 Emissions have changed by 0.2% (0.01 Gg CO2 / year). For 2022 the
changes per gas
are:
There is no subsector information available in PRIMAP-hist. - M.AG.ELV: Total sectoral emissions in 2022 are 2.03
Gg CO2 / year which is 49.4% of category M.AG emissions. 2022 Emissions
have changed by -7.6% (-0.17 Gg CO2
/ year). 1990-2022 Emissions have changed by -11.1% (-0.42 Gg CO2 / year). For 2022 the
changes per gas
are:

For 1990-2022 the changes per gas are:
There is no subsector information available in PRIMAP-hist.
- 3.A: Total sectoral emissions in 2022 are 2.08 Gg
CO2 / year which is 50.6% of category M.AG emissions. 2022 Emissions
have changed by 9.1% (0.17 Gg CO2 /
year). 1990-2022 Emissions have changed by 0.2% (0.01 Gg CO2 / year). For 2022 the
changes per gas
are:
- 4: Total sectoral emissions in 2022 are 69.31 Gg CO2 / year which is 9.4% of M.0.EL emissions. 2022 Emissions have changed by -0.1% (-0.07 Gg CO2 / year). 1990-2022 Emissions have changed by -0.0% (-0.00 Gg CO2 / year).
- 5: Total sectoral emissions in 2022 are 9.86 Gg CO2
/ year which is 1.3% of M.0.EL emissions. 2022 Emissions have changed by
-2.9% (-0.30 Gg CO2 / year).
1990-2022 Emissions have changed by -0.1% (-0.01 Gg CO2 / year). For 2022 the
changes per gas
are: