Changes in PRIMAP-hist v2.5.1_final compared to v2.5_final for Chad
2024-02-29
Johannes Gütschow
Change analysis for Chad for PRIMAP-hist v2.5.1_final compared to v2.5_final
Overview over emissions by sector and gas
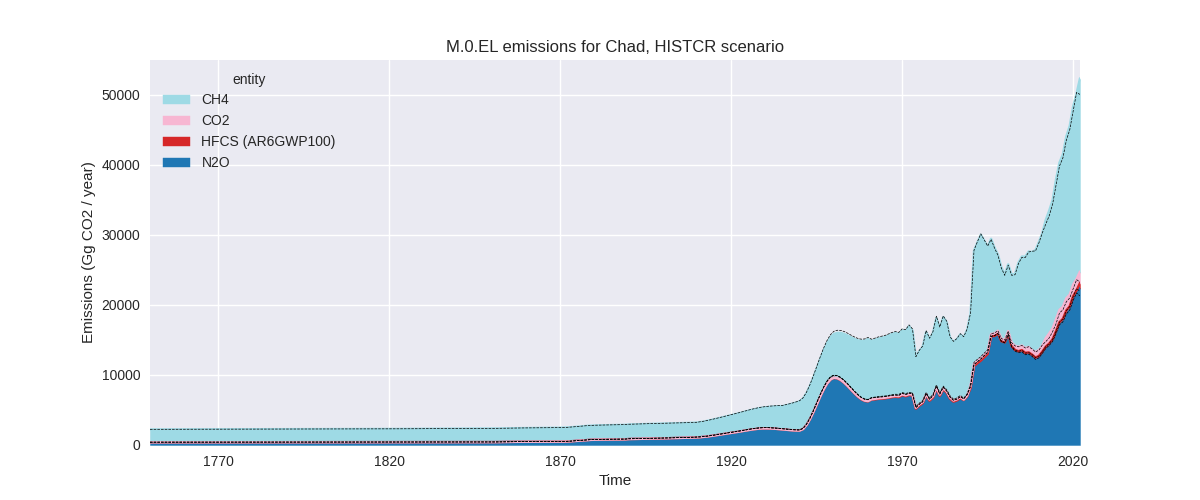
The following figures show the aggregate national total emissions excluding LULUCF AR6GWP100 for the country reported priority scenario. The dotted linesshow the v2.5_final data.


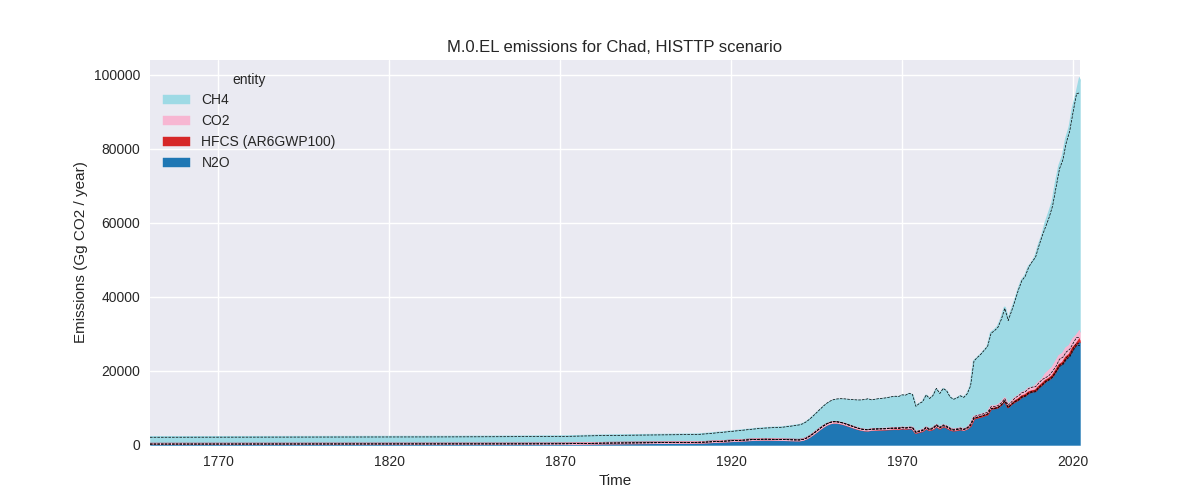
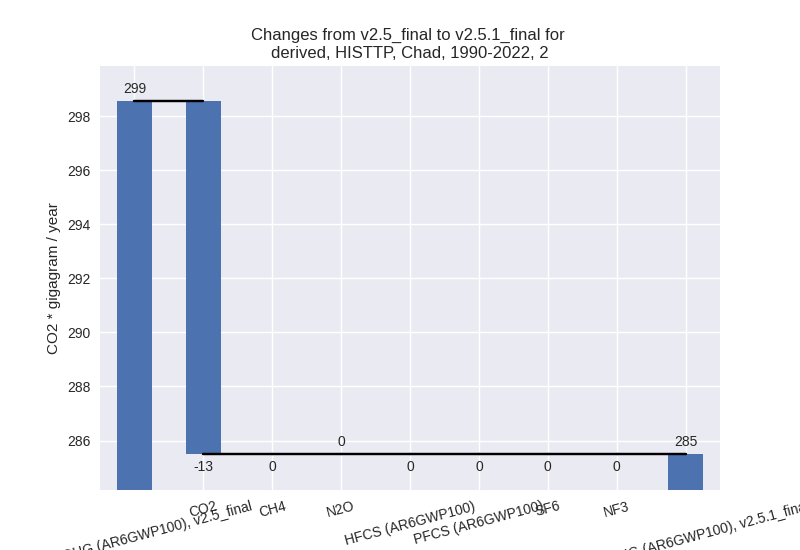
The following figures show the aggregate national total emissions excluding LULUCF AR6GWP100 for the third party priority scenario. The dotted linesshow the v2.5_final data.


Overview over changes
In the country reported priority scenario we have the following changes for aggregate Kyoto GHG and national total emissions excluding LULUCF (M.0.EL):
- Emissions in 2022 have changed by 4.6%% (2300.84 Gg CO2 / year)
- Emissions in 1990-2022 have changed by 0.8%% (247.80 Gg CO2 / year)
In the third party priority scenario we have the following changes for aggregate Kyoto GHG and national total emissions excluding LULUCF (M.0.EL):
- Emissions in 2022 have changed by 4.1%% (3931.82 Gg CO2 / year)
- Emissions in 1990-2022 have changed by 0.9%% (444.55 Gg CO2 / year)
Most important changes per scenario and time frame
In the country reported priority scenario the following sector-gas combinations have the highest absolute impact on national total KyotoGHG (AR6GWP100) emissions in 2022 (top 5):
- 1: M.AG.ELV, N2O with 1207.73 Gg CO2 / year (5.9%)
- 2: 3.A, CH4 with 868.98 Gg CO2 / year (3.8%)
- 3: 1.A, CO2 with 349.56 Gg CO2 / year (58.7%)
- 4: 1.B.1, CH4 with -164.50 Gg CO2 / year (-22.8%)
- 5: 1.A, CH4 with 151.23 Gg CO2 / year (14.7%)
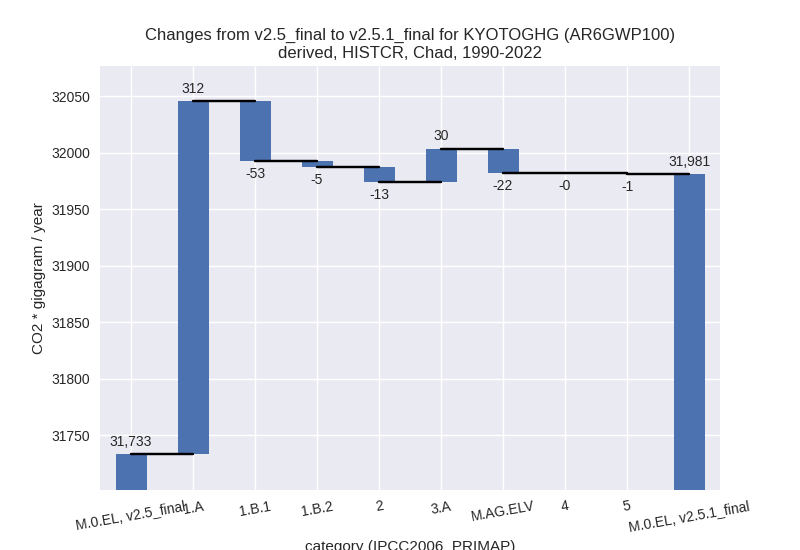
In the country reported priority scenario the following sector-gas combinations have the highest absolute impact on national total KyotoGHG (AR6GWP100) emissions in 1990-2022 (top 5):
- 1: 1.A, CO2 with 153.96 Gg CO2 / year (32.4%)
- 2: 1.A, CH4 with 142.23 Gg CO2 / year (20.2%)
- 3: 1.B.1, CH4 with -52.44 Gg CO2 / year (-11.8%)
- 4: 3.A, CH4 with 29.21 Gg CO2 / year (0.2%)
- 5: M.AG.ELV, N2O with -17.41 Gg CO2 / year (-0.1%)
In the third party priority scenario the following sector-gas combinations have the highest absolute impact on national total KyotoGHG (AR6GWP100) emissions in 2022 (top 5):
- 1: 3.A, CH4 with 2230.34 Gg CO2 / year (3.8%)
- 2: M.AG.ELV, N2O with 1058.67 Gg CO2 / year (4.1%)
- 3: 1.A, CO2 with 691.00 Gg CO2 / year (80.8%)
- 4: 1.B.1, CH4 with -164.50 Gg CO2 / year (-22.8%)
- 5: 1.A, CH4 with 151.23 Gg CO2 / year (14.7%)
In the third party priority scenario the following sector-gas combinations have the highest absolute impact on national total KyotoGHG (AR6GWP100) emissions in 1990-2022 (top 5):
- 1: 1.A, CO2 with 310.87 Gg CO2 / year (45.2%)
- 2: 1.A, CH4 with 142.23 Gg CO2 / year (20.2%)
- 3: 3.A, CH4 with 74.90 Gg CO2 / year (0.3%)
- 4: 1.B.1, CH4 with -52.44 Gg CO2 / year (-11.8%)
- 5: M.AG.ELV, CH4 with -44.28 Gg CO2 / year (-1.4%)
Notes on data changes
No country specific notes present for this changelog.
Changes by sector and gas
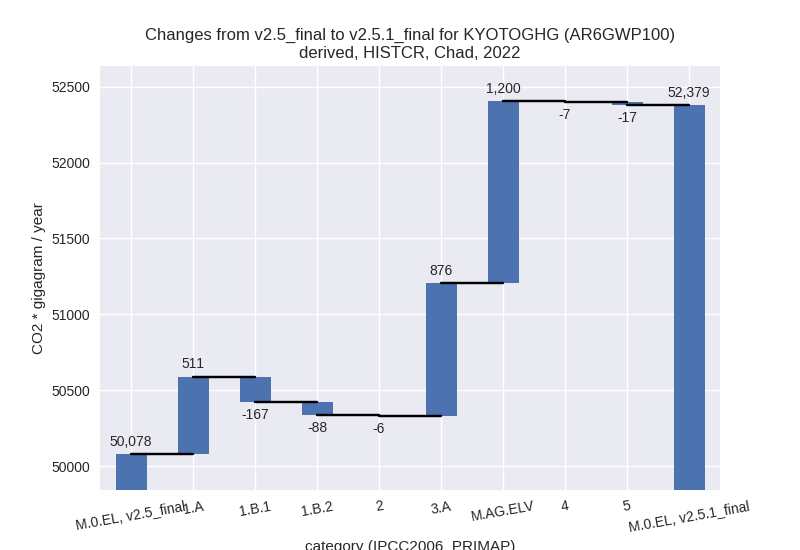
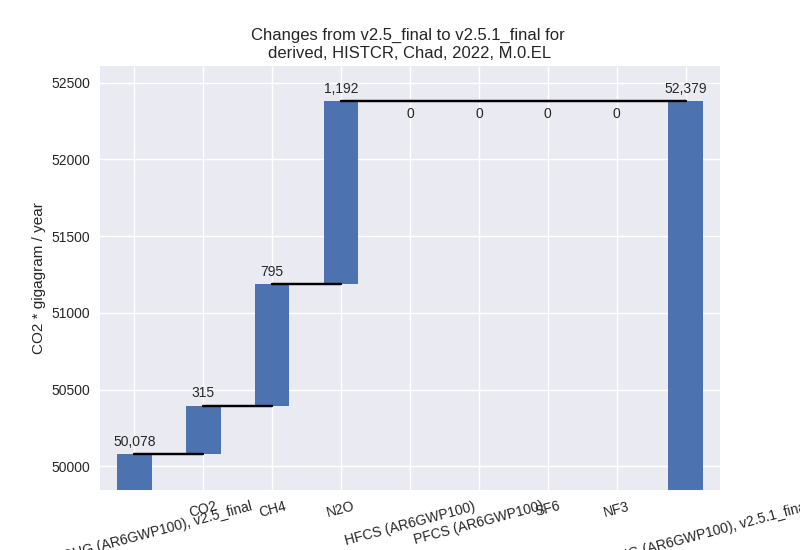
For each scenario and time frame the changes are displayed for all individual sectors and all individual gases. In the sector plot we use aggregate Kyoto GHGs in AR6GWP100. In the gas plot we usenational total emissions without LULUCF. ## country reported scenario
2022
1990-2022

third party scenario
2022

1990-2022

Detailed changes for the scenarios:
country reported scenario (HISTCR):
Most important changes per time frame
For 2022 the following sector-gas combinations have the highest absolute impact on national total KyotoGHG (AR6GWP100) emissions in 2022 (top 5):
- 1: M.AG.ELV, N2O with 1207.73 Gg CO2 / year (5.9%)
- 2: 3.A, CH4 with 868.98 Gg CO2 / year (3.8%)
- 3: 1.A, CO2 with 349.56 Gg CO2 / year (58.7%)
- 4: 1.B.1, CH4 with -164.50 Gg CO2 / year (-22.8%)
- 5: 1.A, CH4 with 151.23 Gg CO2 / year (14.7%)
For 1990-2022 the following sector-gas combinations have the highest absolute impact on national total KyotoGHG (AR6GWP100) emissions in 1990-2022 (top 5):
- 1: 1.A, CO2 with 153.96 Gg CO2 / year (32.4%)
- 2: 1.A, CH4 with 142.23 Gg CO2 / year (20.2%)
- 3: 1.B.1, CH4 with -52.44 Gg CO2 / year (-11.8%)
- 4: 3.A, CH4 with 29.21 Gg CO2 / year (0.2%)
- 5: M.AG.ELV, N2O with -17.41 Gg CO2 / year (-0.1%)
Changes in the main sectors for aggregate KyotoGHG (AR6GWP100) are
- 1: Total sectoral emissions in 2022 are 4214.43 Gg
CO2 / year which is 8.0% of M.0.EL emissions. 2022 Emissions have
changed by 6.5% (256.10 Gg CO2 /
year). 1990-2022 Emissions have changed by 10.1% (253.77 Gg CO2 / year). For 2022 the
changes per gas
are:

For 1990-2022 the changes per gas are:
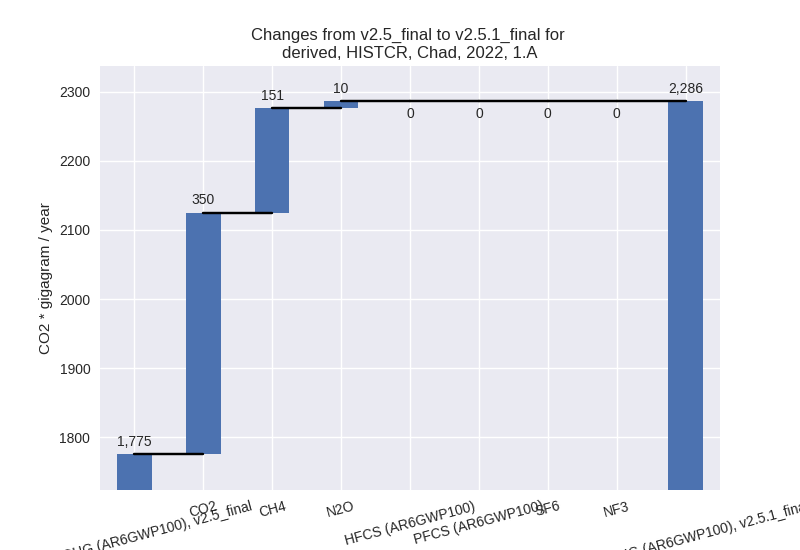
The changes come from the following subsectors:- 1.A: Total sectoral emissions in 2022 are 2286.35
Gg CO2 / year which is 54.3% of category 1 emissions. 2022 Emissions
have changed by 28.8% (511.00 Gg CO2
/ year). 1990-2022 Emissions have changed by 24.5% (312.13 Gg CO2 / year). For 2022 the
changes per gas
are:
For 1990-2022 the changes per gas are:
There is no subsector information available in PRIMAP-hist. - 1.B.1: Total sectoral emissions in 2022 are 564.89
Gg CO2 / year which is 13.4% of category 1 emissions. 2022 Emissions
have changed by -22.8% (-166.69 Gg
CO2 / year). 1990-2022 Emissions have changed by -11.8% (-53.13 Gg CO2 / year). For 2022
the changes per gas
are:
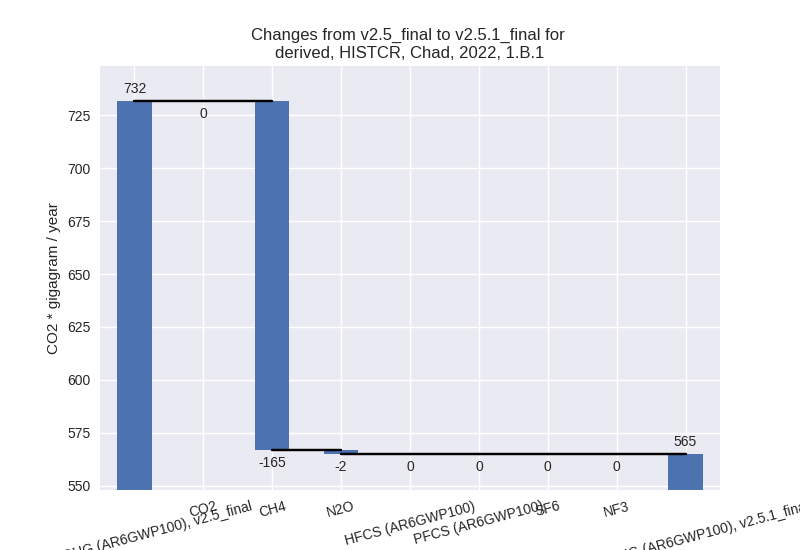
For 1990-2022 the changes per gas are:
There is no subsector information available in PRIMAP-hist. - 1.B.2: Total sectoral emissions in 2022 are 1363.18
Gg CO2 / year which is 32.3% of category 1 emissions. 2022 Emissions
have changed by -6.1% (-88.22 Gg CO2
/ year). 1990-2022 Emissions have changed by -0.7% (-5.23 Gg CO2 / year). For 2022 the
changes per gas
are:
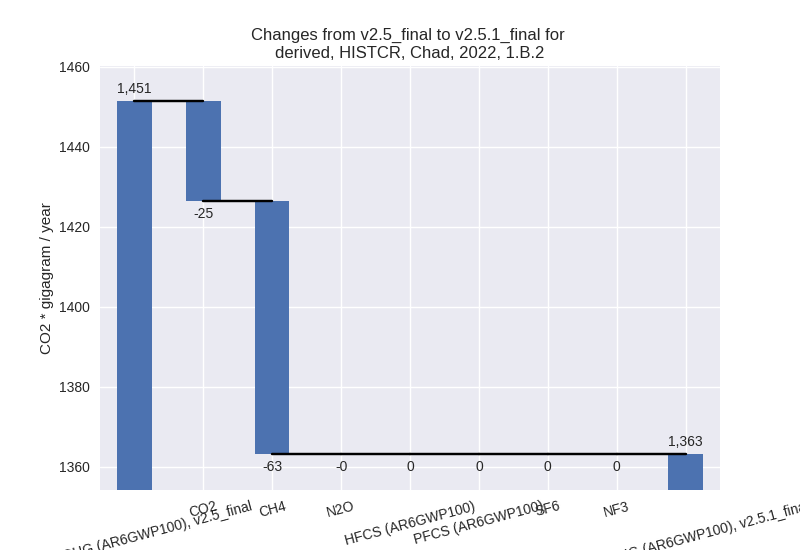
There is no subsector information available in PRIMAP-hist.
- 1.A: Total sectoral emissions in 2022 are 2286.35
Gg CO2 / year which is 54.3% of category 1 emissions. 2022 Emissions
have changed by 28.8% (511.00 Gg CO2
/ year). 1990-2022 Emissions have changed by 24.5% (312.13 Gg CO2 / year). For 2022 the
changes per gas
are:
- 2: Total sectoral emissions in 2022 are 899.63 Gg
CO2 / year which is 1.7% of M.0.EL emissions. 2022 Emissions have
changed by -0.6% (-5.75 Gg CO2 /
year). 1990-2022 Emissions have changed by -4.4% (-13.06 Gg CO2 / year). For
1990-2022 the changes per gas
are:

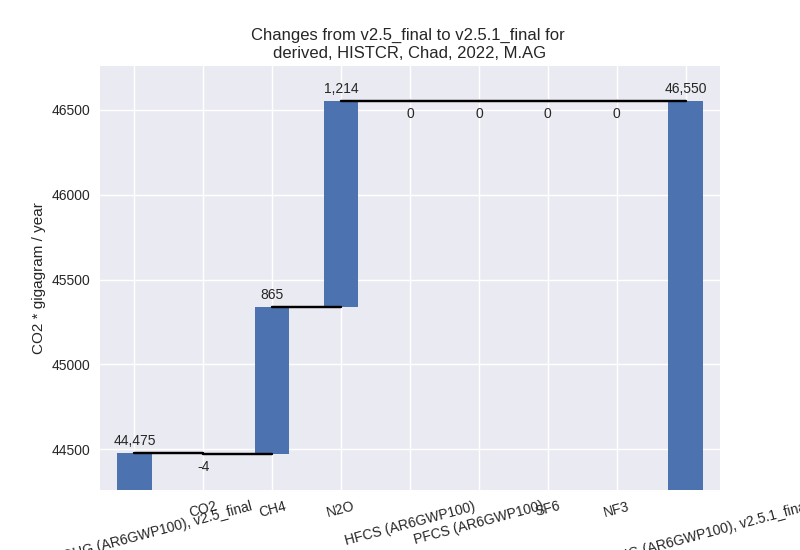
- M.AG: Total sectoral emissions in 2022 are 46550.36
Gg CO2 / year which is 88.9% of M.0.EL emissions. 2022 Emissions have
changed by 4.7% (2075.29 Gg CO2 /
year). 1990-2022 Emissions have changed by 0.0% (7.83 Gg CO2 / year). For 2022 the
changes per gas
are:
The changes come from the following subsectors:- 3.A: Total sectoral emissions in 2022 are 24003.76
Gg CO2 / year which is 51.6% of category M.AG emissions. 2022 Emissions
have changed by 3.8% (875.67 Gg CO2
/ year). 1990-2022 Emissions have changed by 0.2% (29.59 Gg CO2 / year). For 2022 the
changes per gas
are:

There is no subsector information available in PRIMAP-hist. - M.AG.ELV: Total sectoral emissions in 2022 are
22546.60 Gg CO2 / year which is 48.4% of category M.AG emissions. 2022
Emissions have changed by 5.6%
(1199.62 Gg CO2 / year). 1990-2022 Emissions have changed by -0.1% (-21.76 Gg CO2 / year). For 2022 the
changes per gas
are:
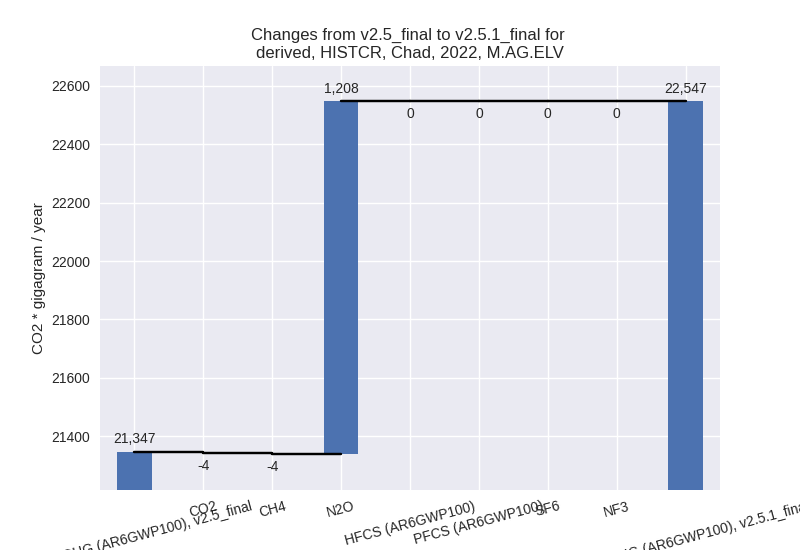
There is no subsector information available in PRIMAP-hist.
- 3.A: Total sectoral emissions in 2022 are 24003.76
Gg CO2 / year which is 51.6% of category M.AG emissions. 2022 Emissions
have changed by 3.8% (875.67 Gg CO2
/ year). 1990-2022 Emissions have changed by 0.2% (29.59 Gg CO2 / year). For 2022 the
changes per gas
are:
- 4: Total sectoral emissions in 2022 are 646.24 Gg CO2 / year which is 1.2% of M.0.EL emissions. 2022 Emissions have changed by -1.1% (-7.48 Gg CO2 / year). 1990-2022 Emissions have changed by -0.1% (-0.23 Gg CO2 / year).
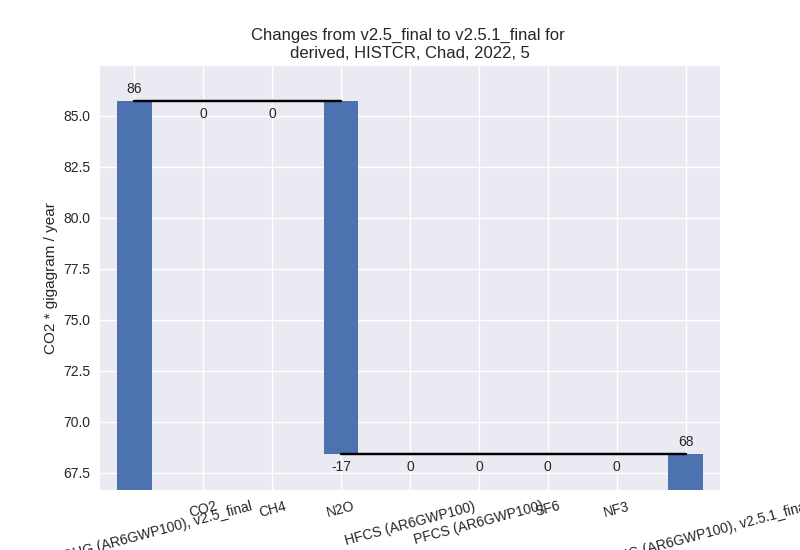
- 5: Total sectoral emissions in 2022 are 68.41 Gg
CO2 / year which is 0.1% of M.0.EL emissions. 2022 Emissions have
changed by -20.2% (-17.31 Gg CO2 /
year). 1990-2022 Emissions have changed by -0.9% (-0.52 Gg CO2 / year). For 2022 the
changes per gas
are:
third party scenario (HISTTP):
Most important changes per time frame
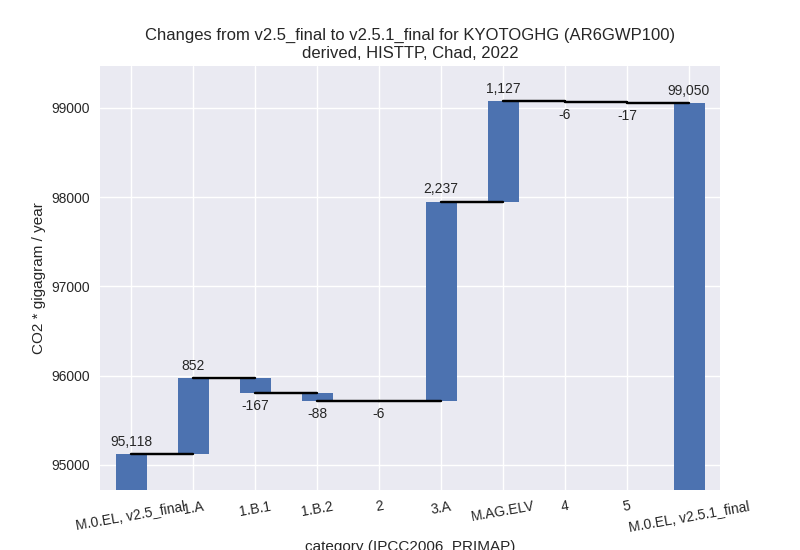
For 2022 the following sector-gas combinations have the highest absolute impact on national total KyotoGHG (AR6GWP100) emissions in 2022 (top 5):
- 1: 3.A, CH4 with 2230.34 Gg CO2 / year (3.8%)
- 2: M.AG.ELV, N2O with 1058.67 Gg CO2 / year (4.1%)
- 3: 1.A, CO2 with 691.00 Gg CO2 / year (80.8%)
- 4: 1.B.1, CH4 with -164.50 Gg CO2 / year (-22.8%)
- 5: 1.A, CH4 with 151.23 Gg CO2 / year (14.7%)
For 1990-2022 the following sector-gas combinations have the highest absolute impact on national total KyotoGHG (AR6GWP100) emissions in 1990-2022 (top 5):
- 1: 1.A, CO2 with 310.87 Gg CO2 / year (45.2%)
- 2: 1.A, CH4 with 142.23 Gg CO2 / year (20.2%)
- 3: 3.A, CH4 with 74.90 Gg CO2 / year (0.3%)
- 4: 1.B.1, CH4 with -52.44 Gg CO2 / year (-11.8%)
- 5: M.AG.ELV, CH4 with -44.28 Gg CO2 / year (-1.4%)
Changes in the main sectors for aggregate KyotoGHG (AR6GWP100) are
- 1: Total sectoral emissions in 2022 are 4814.87 Gg
CO2 / year which is 4.9% of M.0.EL emissions. 2022 Emissions have
changed by 14.2% (597.54 Gg CO2 /
year). 1990-2022 Emissions have changed by 15.0% (410.68 Gg CO2 / year). For 2022 the
changes per gas
are:

For 1990-2022 the changes per gas are:
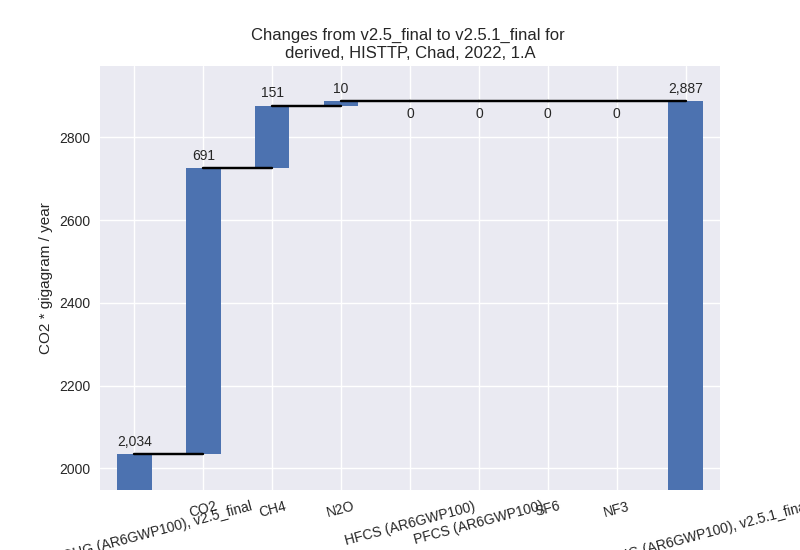
The changes come from the following subsectors:- 1.A: Total sectoral emissions in 2022 are 2886.80
Gg CO2 / year which is 60.0% of category 1 emissions. 2022 Emissions
have changed by 41.9% (852.44 Gg CO2
/ year). 1990-2022 Emissions have changed by 31.5% (469.04 Gg CO2 / year). For 2022 the
changes per gas
are:
For 1990-2022 the changes per gas are: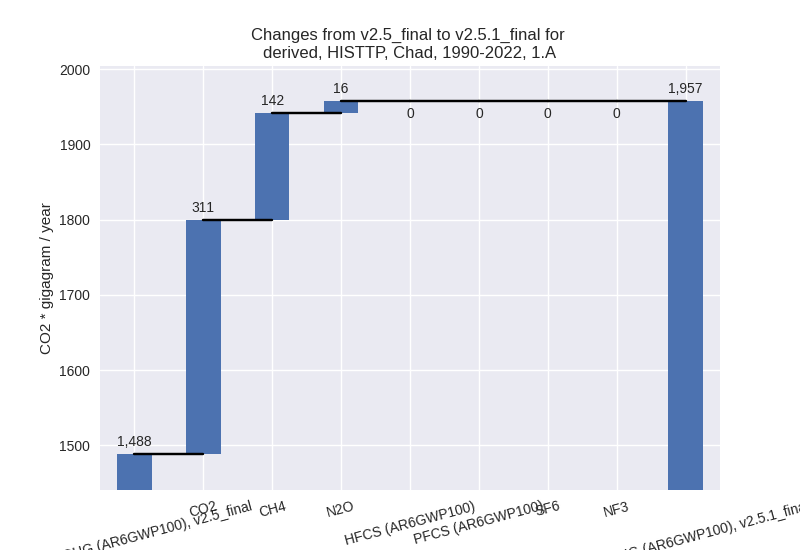
There is no subsector information available in PRIMAP-hist. - 1.B.1: Total sectoral emissions in 2022 are 564.89
Gg CO2 / year which is 11.7% of category 1 emissions. 2022 Emissions
have changed by -22.8% (-166.69 Gg
CO2 / year). 1990-2022 Emissions have changed by -11.8% (-53.13 Gg CO2 / year). For 2022
the changes per gas
are:

For 1990-2022 the changes per gas are: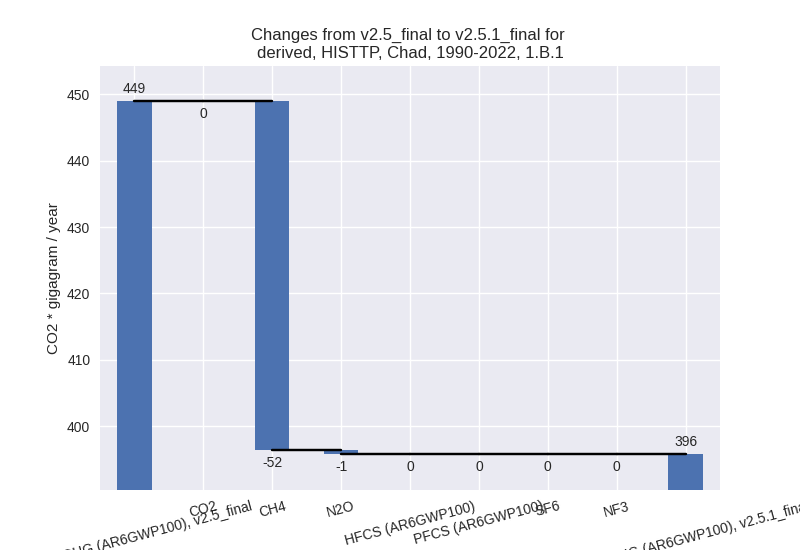
There is no subsector information available in PRIMAP-hist. - 1.B.2: Total sectoral emissions in 2022 are 1363.18
Gg CO2 / year which is 28.3% of category 1 emissions. 2022 Emissions
have changed by -6.1% (-88.22 Gg CO2
/ year). 1990-2022 Emissions have changed by -0.7% (-5.23 Gg CO2 / year). For 2022 the
changes per gas
are:

There is no subsector information available in PRIMAP-hist.
- 1.A: Total sectoral emissions in 2022 are 2886.80
Gg CO2 / year which is 60.0% of category 1 emissions. 2022 Emissions
have changed by 41.9% (852.44 Gg CO2
/ year). 1990-2022 Emissions have changed by 31.5% (469.04 Gg CO2 / year). For 2022 the
changes per gas
are:
- 2: Total sectoral emissions in 2022 are 899.63 Gg
CO2 / year which is 0.9% of M.0.EL emissions. 2022 Emissions have
changed by -0.6% (-5.75 Gg CO2 /
year). 1990-2022 Emissions have changed by -4.4% (-13.06 Gg CO2 / year). For
1990-2022 the changes per gas
are:
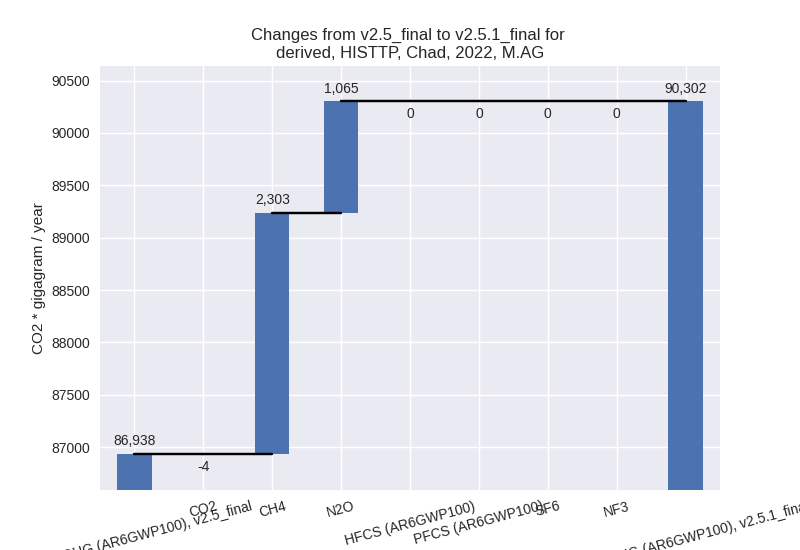
- M.AG: Total sectoral emissions in 2022 are 90301.58
Gg CO2 / year which is 91.2% of M.0.EL emissions. 2022 Emissions have
changed by 3.9% (3363.74 Gg CO2 /
year). 1990-2022 Emissions have changed by 0.1% (47.65 Gg CO2 / year). For 2022 the
changes per gas
are:
The changes come from the following subsectors:- 3.A: Total sectoral emissions in 2022 are 60561.91
Gg CO2 / year which is 67.1% of category M.AG emissions. 2022 Emissions
have changed by 3.8% (2237.03 Gg CO2
/ year). 1990-2022 Emissions have changed by 0.3% (75.27 Gg CO2 / year). For 2022 the
changes per gas
are:

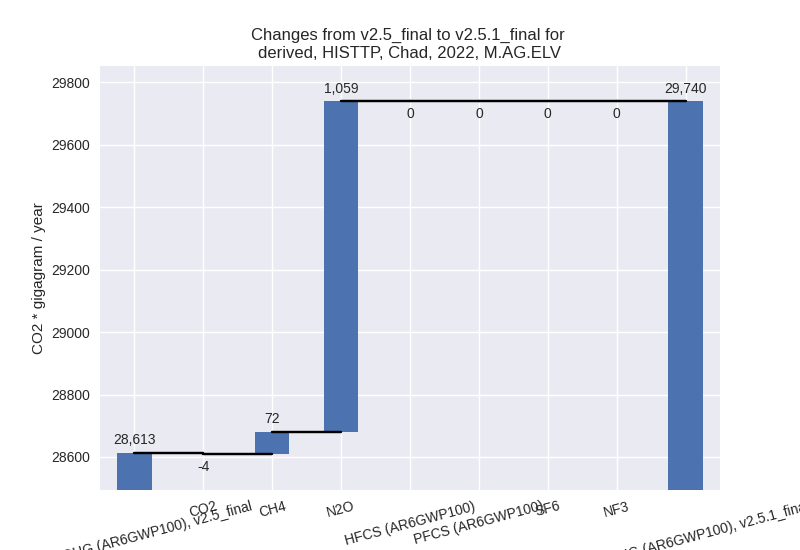
There is no subsector information available in PRIMAP-hist. - M.AG.ELV: Total sectoral emissions in 2022 are
29739.67 Gg CO2 / year which is 32.9% of category M.AG emissions. 2022
Emissions have changed by 3.9%
(1126.71 Gg CO2 / year). 1990-2022 Emissions have changed by -0.2% (-27.63 Gg CO2 / year). For 2022 the
changes per gas
are:
There is no subsector information available in PRIMAP-hist.
- 3.A: Total sectoral emissions in 2022 are 60561.91
Gg CO2 / year which is 67.1% of category M.AG emissions. 2022 Emissions
have changed by 3.8% (2237.03 Gg CO2
/ year). 1990-2022 Emissions have changed by 0.3% (75.27 Gg CO2 / year). For 2022 the
changes per gas
are:
- 4: Total sectoral emissions in 2022 are 2965.71 Gg CO2 / year which is 3.0% of M.0.EL emissions. 2022 Emissions have changed by -0.2% (-6.40 Gg CO2 / year). 1990-2022 Emissions have changed by -0.0% (-0.19 Gg CO2 / year).
- 5: Total sectoral emissions in 2022 are 68.41 Gg
CO2 / year which is 0.1% of M.0.EL emissions. 2022 Emissions have
changed by -20.2% (-17.31 Gg CO2 /
year). 1990-2022 Emissions have changed by -0.9% (-0.52 Gg CO2 / year). For 2022 the
changes per gas
are:
