Changes in PRIMAP-hist v2.5.1_final compared to v2.5_final for Trinidad and Tobago
2024-02-29
Johannes Gütschow
Change analysis for Trinidad and Tobago for PRIMAP-hist v2.5.1_final compared to v2.5_final
Overview over emissions by sector and gas
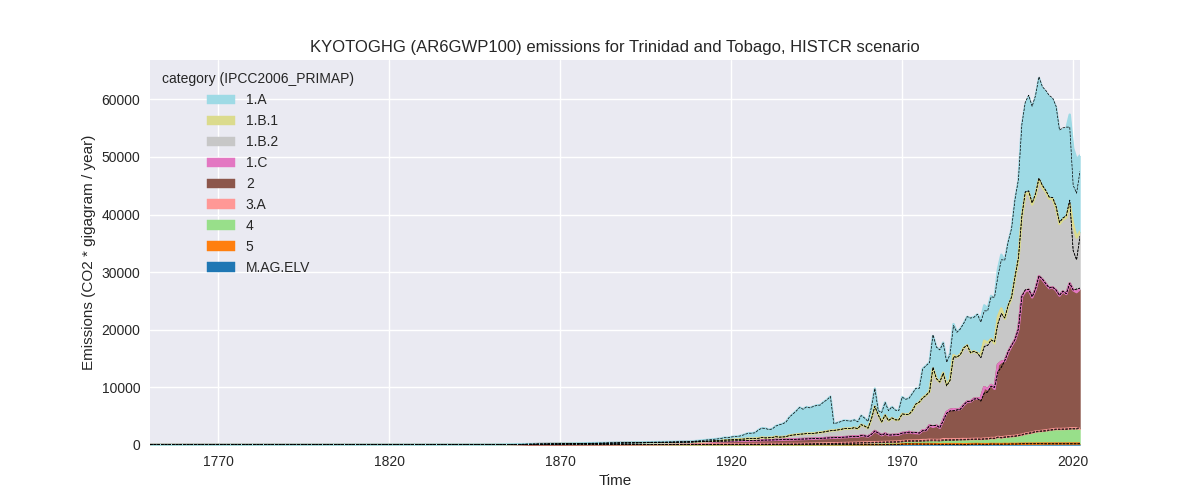
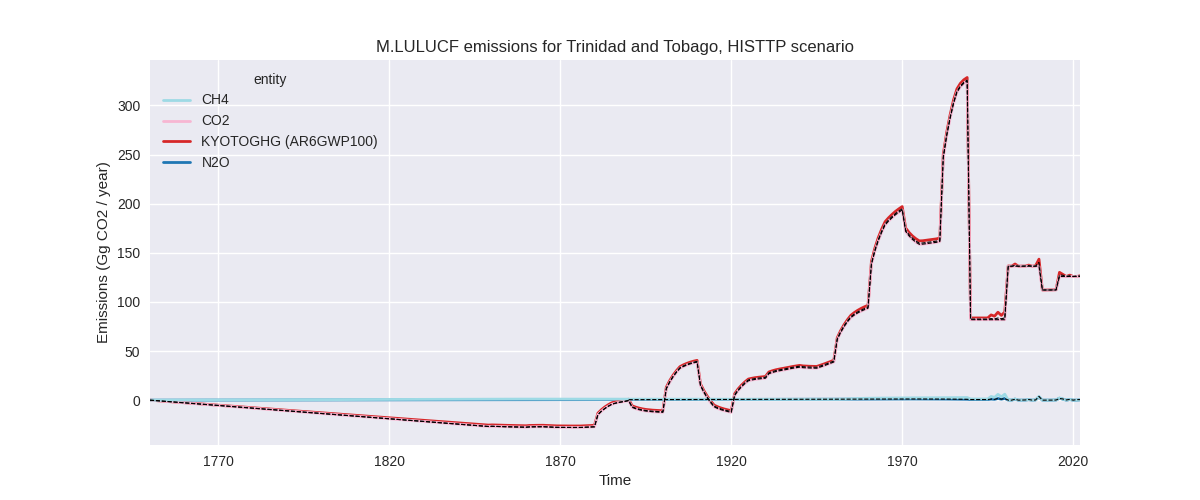
The following figures show the aggregate national total emissions excluding LULUCF AR6GWP100 for the country reported priority scenario. The dotted linesshow the v2.5_final data.
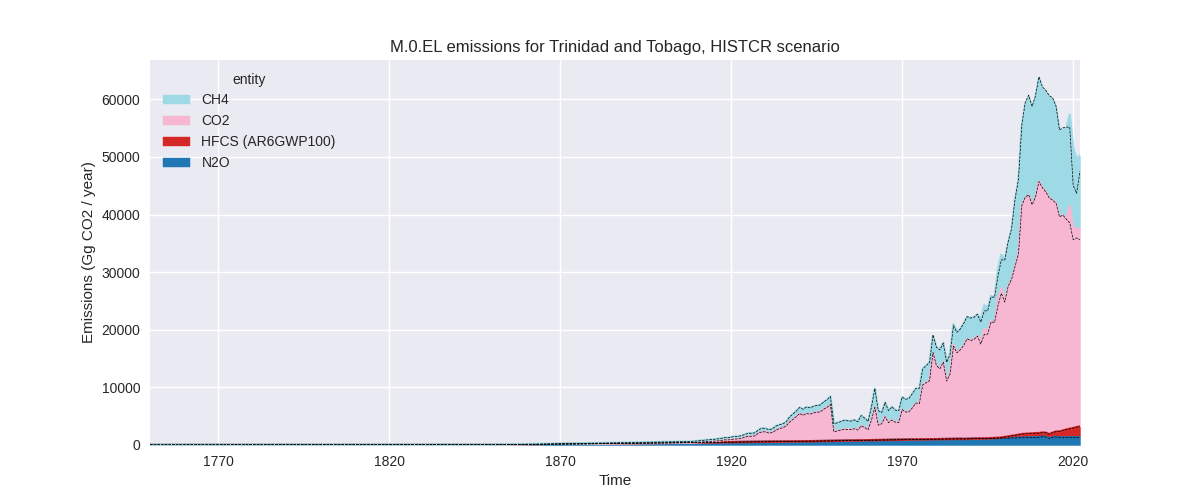
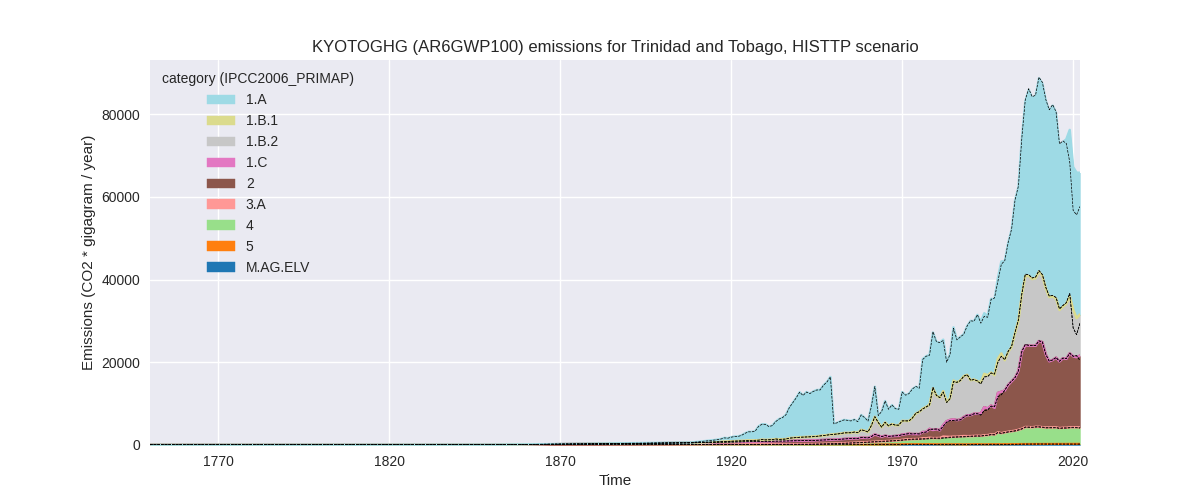
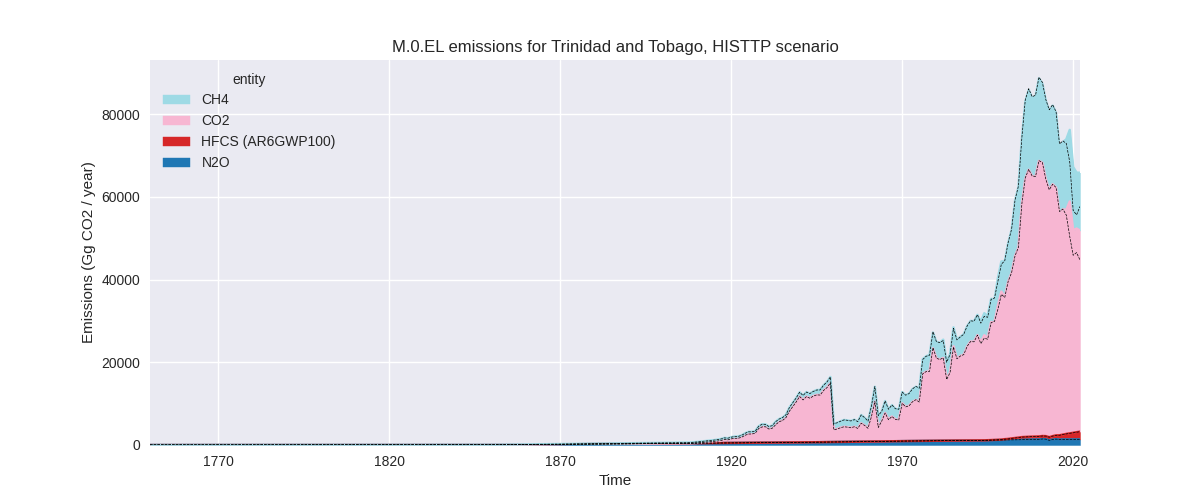
The following figures show the aggregate national total emissions excluding LULUCF AR6GWP100 for the third party priority scenario. The dotted linesshow the v2.5_final data.
Overview over changes
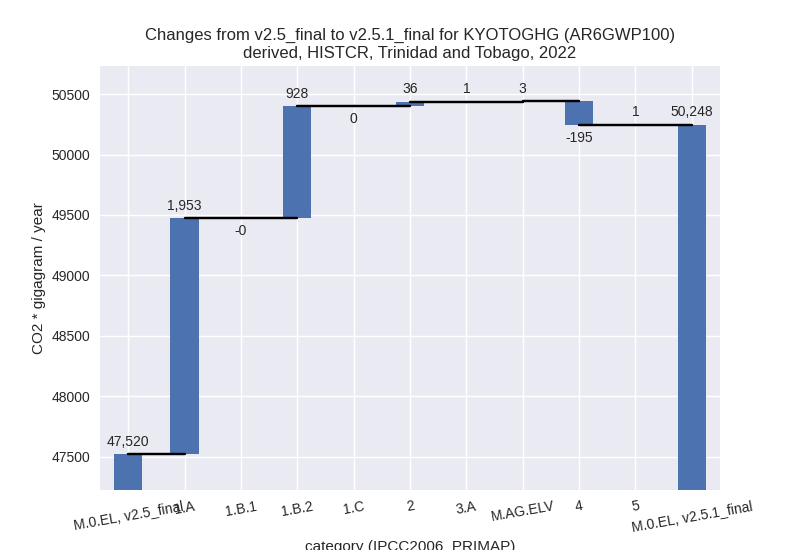
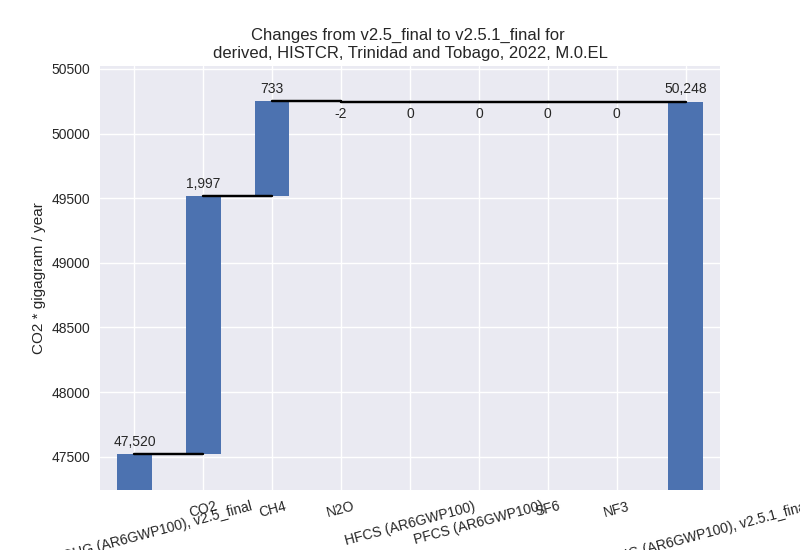
In the country reported priority scenario we have the following changes for aggregate Kyoto GHG and national total emissions excluding LULUCF (M.0.EL):
- Emissions in 2022 have changed by 5.7%% (2727.94 Gg CO2 / year)
- Emissions in 1990-2022 have changed by 1.1%% (485.76 Gg CO2 / year)
In the third party priority scenario we have the following changes for aggregate Kyoto GHG and national total emissions excluding LULUCF (M.0.EL):
- Emissions in 2022 have changed by 14.1%% (8146.03 Gg CO2 / year)
- Emissions in 1990-2022 have changed by 1.8%% (1069.67 Gg CO2 / year)
Most important changes per scenario and time frame
In the country reported priority scenario the following sector-gas combinations have the highest absolute impact on national total KyotoGHG (AR6GWP100) emissions in 2022 (top 5):
- 1: 1.A, CO2 with 1954.15 Gg CO2 / year (17.4%)
- 2: 1.B.2, CH4 with 929.08 Gg CO2 / year (10.7%)
- 3: 4, CH4 with -194.74 Gg CO2 / year (-7.2%)
- 4: 2, CO2 with 33.17 Gg CO2 / year (0.2%)
- 5: M.AG.ELV, CO2 with 9.43 Gg CO2 / year (inf%)
In the country reported priority scenario the following sector-gas combinations have the highest absolute impact on national total KyotoGHG (AR6GWP100) emissions in 1990-2022 (top 5):
- 1: 1.A, CO2 with 265.98 Gg CO2 / year (2.2%)
- 2: 1.B.2, CH4 with 152.96 Gg CO2 / year (1.7%)
- 3: 2, CO2 with 67.83 Gg CO2 / year (0.4%)
- 4: 2, CH4 with 12.82 Gg CO2 / year (4.6%)
- 5: M.AG.ELV, CO2 with -7.74 Gg CO2 / year (-49.9%)
In the third party priority scenario the following sector-gas combinations have the highest absolute impact on national total KyotoGHG (AR6GWP100) emissions in 2022 (top 5):
- 1: 1.A, CO2 with 6048.17 Gg CO2 / year (21.5%)
- 2: 2, CO2 with 1091.09 Gg CO2 / year (8.4%)
- 3: 1.B.2, CH4 with 929.08 Gg CO2 / year (10.7%)
- 4: 4, CH4 with 73.76 Gg CO2 / year (1.9%)
- 5: M.AG.ELV, CO2 with 9.43 Gg CO2 / year (inf%)
In the third party priority scenario the following sector-gas combinations have the highest absolute impact on national total KyotoGHG (AR6GWP100) emissions in 1990-2022 (top 5):
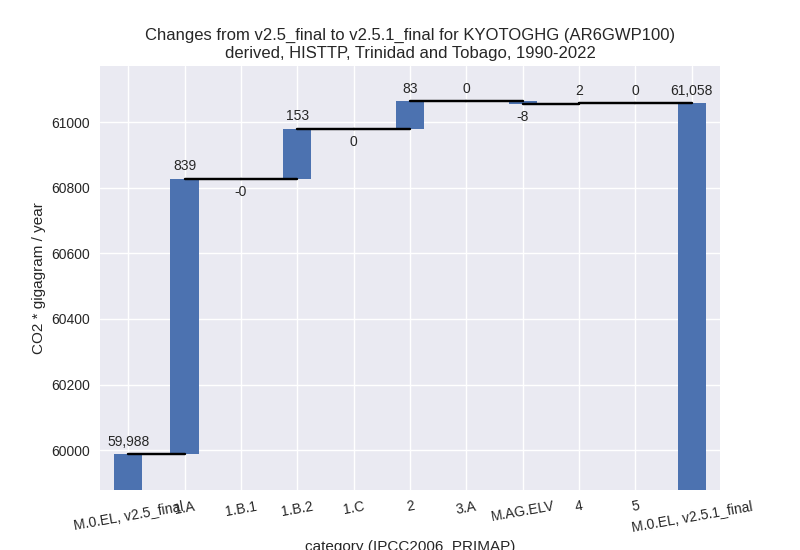
- 1: 1.A, CO2 with 839.01 Gg CO2 / year (2.7%)
- 2: 1.B.2, CH4 with 152.96 Gg CO2 / year (1.7%)
- 3: 2, CO2 with 74.09 Gg CO2 / year (0.6%)
- 4: 2, CH4 with 9.39 Gg CO2 / year (3.8%)
- 5: M.AG.ELV, CO2 with -7.74 Gg CO2 / year (-49.9%)
Notes on data changes
Here we list notes explaining important emissions changes for the country. ’' means that the following text only applies to the TP time series, while means that it only applies to the CR scenario. Otherwise the note applies to both scenarios.
- 1.A, CO2: The new CDIAC data shows relatively constant emissions for 2016-2019 while the EI data shows a decline in emissions. This leads to higher emissions in PRIMAP-hist as CDIAC replaces EI for 2018-2020. In the CR scenario the effect is smaller as country reported data are available until 2018.
- 1.B.2, CH4: The 2019-2021 emissions decline is smaller in EDGAR 8.0 than in EDGAR 7.0 leading to higher emissions for the last years.
- 2, CO2: EDGAR 8.0 data replaces numerical extrapolation for 2022 leading to higher emissions.
Changes by sector and gas
For each scenario and time frame the changes are displayed for all individual sectors and all individual gases. In the sector plot we use aggregate Kyoto GHGs in AR6GWP100. In the gas plot we usenational total emissions without LULUCF. ## country reported scenario
2022
1990-2022


third party scenario
2022


1990-2022

Detailed changes for the scenarios:
country reported scenario (HISTCR):
Most important changes per time frame
For 2022 the following sector-gas combinations have the highest absolute impact on national total KyotoGHG (AR6GWP100) emissions in 2022 (top 5):
- 1: 1.A, CO2 with 1954.15 Gg CO2 / year (17.4%)
- 2: 1.B.2, CH4 with 929.08 Gg CO2 / year (10.7%)
- 3: 4, CH4 with -194.74 Gg CO2 / year (-7.2%)
- 4: 2, CO2 with 33.17 Gg CO2 / year (0.2%)
- 5: M.AG.ELV, CO2 with 9.43 Gg CO2 / year (inf%)
For 1990-2022 the following sector-gas combinations have the highest absolute impact on national total KyotoGHG (AR6GWP100) emissions in 1990-2022 (top 5):
- 1: 1.A, CO2 with 265.98 Gg CO2 / year (2.2%)
- 2: 1.B.2, CH4 with 152.96 Gg CO2 / year (1.7%)
- 3: 2, CO2 with 67.83 Gg CO2 / year (0.4%)
- 4: 2, CH4 with 12.82 Gg CO2 / year (4.6%)
- 5: M.AG.ELV, CO2 with -7.74 Gg CO2 / year (-49.9%)
Changes in the main sectors for aggregate KyotoGHG (AR6GWP100) are
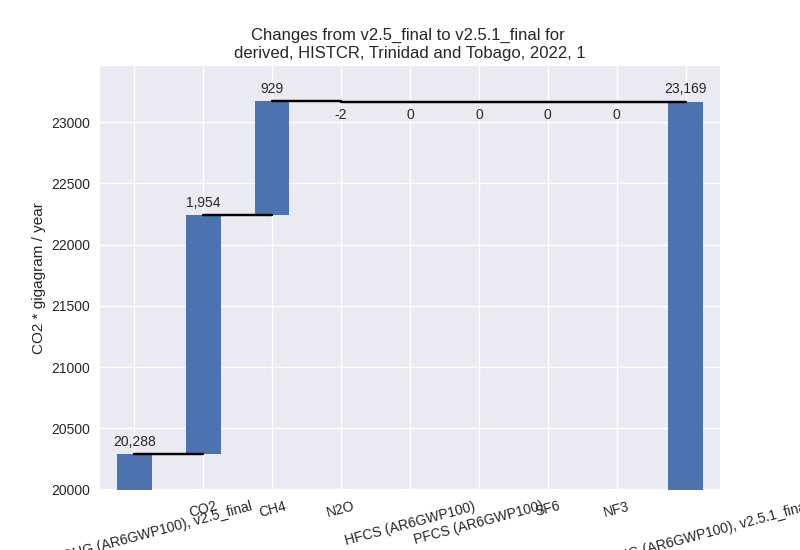
- 1: Total sectoral emissions in 2022 are 23169.05 Gg
CO2 / year which is 46.1% of M.0.EL emissions. 2022 Emissions have
changed by 14.2% (2881.23 Gg CO2 /
year). 1990-2022 Emissions have changed by 1.8% (418.97 Gg CO2 / year). For 2022 the
changes per gas
are:
The changes come from the following subsectors:- 1.A: Total sectoral emissions in 2022 are 13219.02
Gg CO2 / year which is 57.1% of category 1 emissions. 2022 Emissions
have changed by 17.3% (1952.86 Gg
CO2 / year). 1990-2022 Emissions have changed by 2.1% (266.08 Gg CO2 / year). For 2022 the
changes per gas
are:

For 1990-2022 the changes per gas are:
There is no subsector information available in PRIMAP-hist. - 1.B.1: Total sectoral emissions in 2022 are 4.89 Gg CO2 / year which is 0.0% of category 1 emissions. 2022 Emissions have changed by -0.1% (-0.01 Gg CO2 / year). 1990-2022 Emissions have changed by -0.0% (-0.00 Gg CO2 / year).
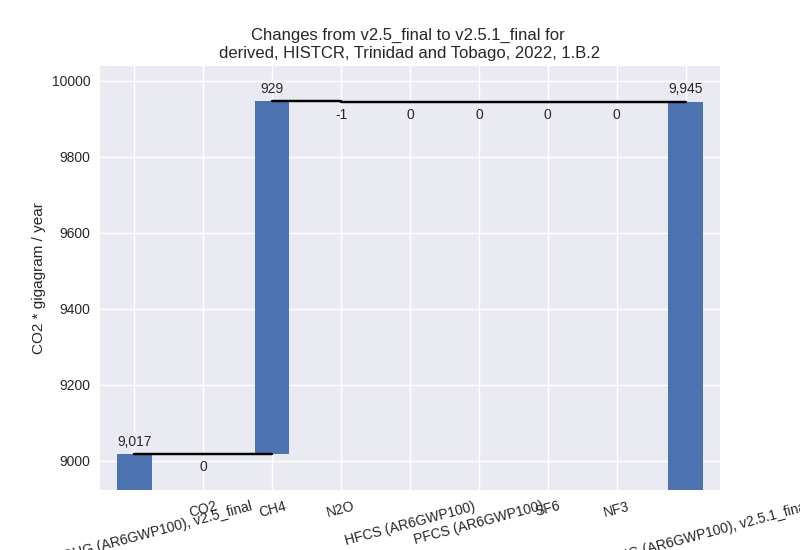
- 1.B.2: Total sectoral emissions in 2022 are 9945.14
Gg CO2 / year which is 42.9% of category 1 emissions. 2022 Emissions
have changed by 10.3% (928.37 Gg CO2
/ year). 1990-2022 Emissions have changed by 1.3% (152.89 Gg CO2 / year). For 2022 the
changes per gas
are:
There is no subsector information available in PRIMAP-hist.
- 1.A: Total sectoral emissions in 2022 are 13219.02
Gg CO2 / year which is 57.1% of category 1 emissions. 2022 Emissions
have changed by 17.3% (1952.86 Gg
CO2 / year). 1990-2022 Emissions have changed by 2.1% (266.08 Gg CO2 / year). For 2022 the
changes per gas
are:
- 2: Total sectoral emissions in 2022 are 24208.60 Gg CO2 / year which is 48.2% of M.0.EL emissions. 2022 Emissions have changed by 0.2% (36.26 Gg CO2 / year). 1990-2022 Emissions have changed by 0.4% (80.65 Gg CO2 / year).
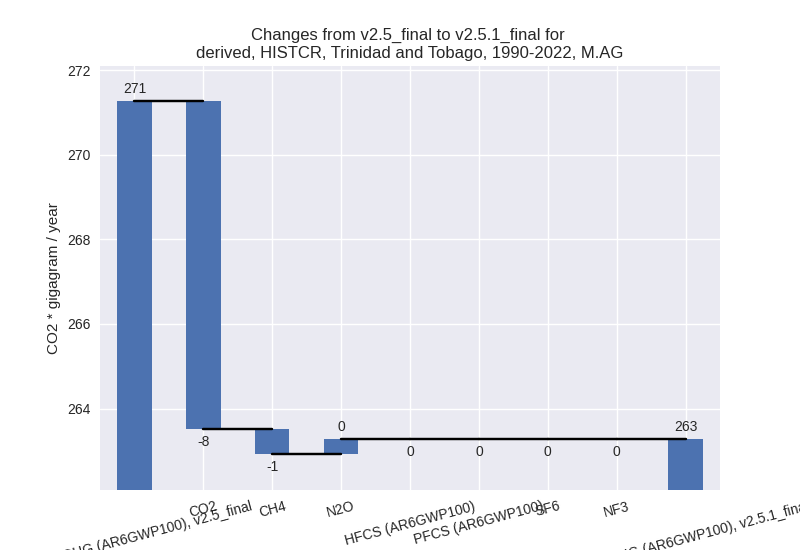
- M.AG: Total sectoral emissions in 2022 are 308.55
Gg CO2 / year which is 0.6% of M.0.EL emissions. 2022 Emissions have
changed by 1.4% (4.11 Gg CO2 /
year). 1990-2022 Emissions have changed by -2.9% (-7.99 Gg CO2 / year). For 1990-2022
the changes per gas
are:
The changes come from the following subsectors:- 3.A: Total sectoral emissions in 2022 are 120.28 Gg CO2 / year which is 39.0% of category M.AG emissions. 2022 Emissions have changed by 0.9% (1.02 Gg CO2 / year). 1990-2022 Emissions have changed by 0.1% (0.15 Gg CO2 / year).
- M.AG.ELV: Total sectoral emissions in 2022 are
188.26 Gg CO2 / year which is 61.0% of category M.AG emissions. 2022
Emissions have changed by 1.7% (3.09
Gg CO2 / year). 1990-2022 Emissions have changed by -5.1% (-8.14 Gg CO2 / year). For 1990-2022
the changes per gas
are:
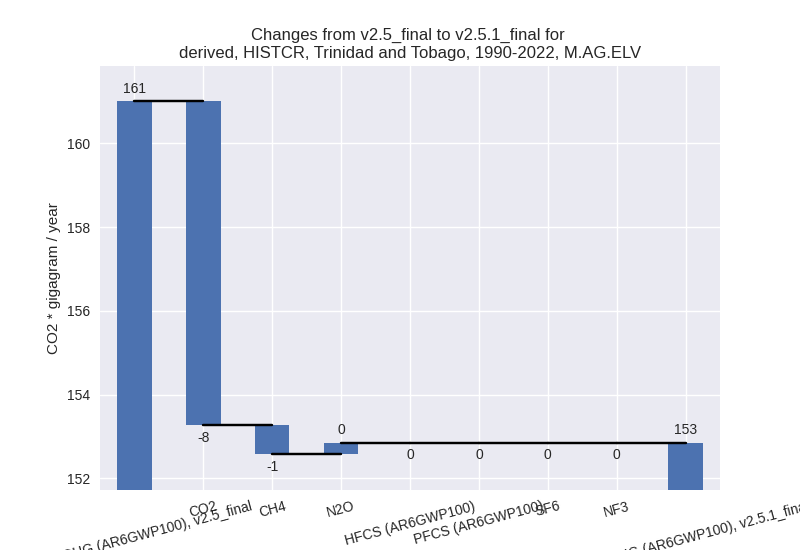
There is no subsector information available in PRIMAP-hist.
- 4: Total sectoral emissions in 2022 are 2498.92 Gg
CO2 / year which is 5.0% of M.0.EL emissions. 2022 Emissions have
changed by -7.2% (-194.75 Gg CO2 /
year). 1990-2022 Emissions have changed by -0.4% (-5.90 Gg CO2 / year). For 2022 the
changes per gas
are:

- 5: Total sectoral emissions in 2022 are 62.42 Gg CO2 / year which is 0.1% of M.0.EL emissions. 2022 Emissions have changed by 1.8% (1.09 Gg CO2 / year). 1990-2022 Emissions have changed by 0.1% (0.03 Gg CO2 / year).
third party scenario (HISTTP):
Most important changes per time frame
For 2022 the following sector-gas combinations have the highest absolute impact on national total KyotoGHG (AR6GWP100) emissions in 2022 (top 5):
- 1: 1.A, CO2 with 6048.17 Gg CO2 / year (21.5%)
- 2: 2, CO2 with 1091.09 Gg CO2 / year (8.4%)
- 3: 1.B.2, CH4 with 929.08 Gg CO2 / year (10.7%)
- 4: 4, CH4 with 73.76 Gg CO2 / year (1.9%)
- 5: M.AG.ELV, CO2 with 9.43 Gg CO2 / year (inf%)
For 1990-2022 the following sector-gas combinations have the highest absolute impact on national total KyotoGHG (AR6GWP100) emissions in 1990-2022 (top 5):
- 1: 1.A, CO2 with 839.01 Gg CO2 / year (2.7%)
- 2: 1.B.2, CH4 with 152.96 Gg CO2 / year (1.7%)
- 3: 2, CO2 with 74.09 Gg CO2 / year (0.6%)
- 4: 2, CH4 with 9.39 Gg CO2 / year (3.8%)
- 5: M.AG.ELV, CO2 with -7.74 Gg CO2 / year (-49.9%)
Changes in the main sectors for aggregate KyotoGHG (AR6GWP100) are
- 1: Total sectoral emissions in 2022 are 44223.79 Gg
CO2 / year which is 67.2% of M.0.EL emissions. 2022 Emissions have
changed by 18.7% (6973.28 Gg CO2 /
year). 1990-2022 Emissions have changed by 2.3% (991.94 Gg CO2 / year). For 2022 the
changes per gas
are:
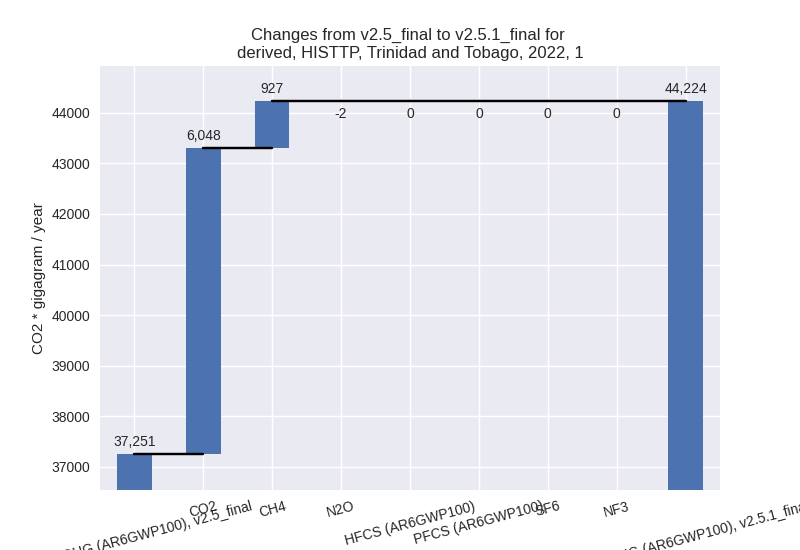
For 1990-2022 the changes per gas are:
The changes come from the following subsectors:- 1.A: Total sectoral emissions in 2022 are 34273.77
Gg CO2 / year which is 77.5% of category 1 emissions. 2022 Emissions
have changed by 21.4% (6044.92 Gg
CO2 / year). 1990-2022 Emissions have changed by 2.7% (839.05 Gg CO2 / year). For 2022 the
changes per gas
are:

For 1990-2022 the changes per gas are:
There is no subsector information available in PRIMAP-hist. - 1.B.1: Total sectoral emissions in 2022 are 4.89 Gg CO2 / year which is 0.0% of category 1 emissions. 2022 Emissions have changed by -0.1% (-0.01 Gg CO2 / year). 1990-2022 Emissions have changed by -0.0% (-0.00 Gg CO2 / year).
- 1.B.2: Total sectoral emissions in 2022 are 9945.14
Gg CO2 / year which is 22.5% of category 1 emissions. 2022 Emissions
have changed by 10.3% (928.37 Gg CO2
/ year). 1990-2022 Emissions have changed by 1.3% (152.89 Gg CO2 / year). For 2022 the
changes per gas
are:

There is no subsector information available in PRIMAP-hist.
- 1.A: Total sectoral emissions in 2022 are 34273.77
Gg CO2 / year which is 77.5% of category 1 emissions. 2022 Emissions
have changed by 21.4% (6044.92 Gg
CO2 / year). 1990-2022 Emissions have changed by 2.7% (839.05 Gg CO2 / year). For 2022 the
changes per gas
are:
- 2: Total sectoral emissions in 2022 are 17365.38 Gg
CO2 / year which is 26.4% of M.0.EL emissions. 2022 Emissions have
changed by 6.7% (1094.52 Gg CO2 /
year). 1990-2022 Emissions have changed by 0.6% (83.49 Gg CO2 / year). For 2022 the
changes per gas
are:

- M.AG: Total sectoral emissions in 2022 are 308.55
Gg CO2 / year which is 0.5% of M.0.EL emissions. 2022 Emissions have
changed by 1.4% (4.11 Gg CO2 /
year). 1990-2022 Emissions have changed by -2.9% (-7.99 Gg CO2 / year). For 1990-2022
the changes per gas
are:

The changes come from the following subsectors:- 3.A: Total sectoral emissions in 2022 are 120.28 Gg CO2 / year which is 39.0% of category M.AG emissions. 2022 Emissions have changed by 0.9% (1.02 Gg CO2 / year). 1990-2022 Emissions have changed by 0.1% (0.15 Gg CO2 / year).
- M.AG.ELV: Total sectoral emissions in 2022 are
188.26 Gg CO2 / year which is 61.0% of category M.AG emissions. 2022
Emissions have changed by 1.7% (3.09
Gg CO2 / year). 1990-2022 Emissions have changed by -5.1% (-8.14 Gg CO2 / year). For 1990-2022
the changes per gas
are:

There is no subsector information available in PRIMAP-hist.
- 4: Total sectoral emissions in 2022 are 3885.83 Gg CO2 / year which is 5.9% of M.0.EL emissions. 2022 Emissions have changed by 1.9% (73.02 Gg CO2 / year). 1990-2022 Emissions have changed by 0.1% (2.21 Gg CO2 / year).
- 5: Total sectoral emissions in 2022 are 62.42 Gg CO2 / year which is 0.1% of M.0.EL emissions. 2022 Emissions have changed by 1.8% (1.09 Gg CO2 / year). 1990-2022 Emissions have changed by 0.1% (0.03 Gg CO2 / year).