Changes in PRIMAP-hist v2.5.1_final compared to v2.5_final for Uganda
2024-02-29
Johannes Gütschow
Change analysis for Uganda for PRIMAP-hist v2.5.1_final compared to v2.5_final
Overview over emissions by sector and gas
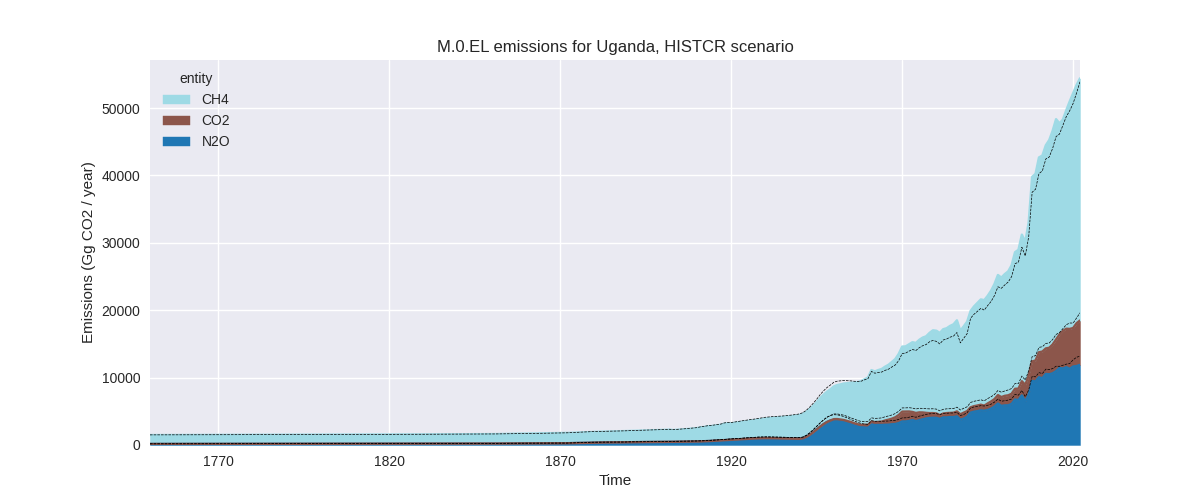
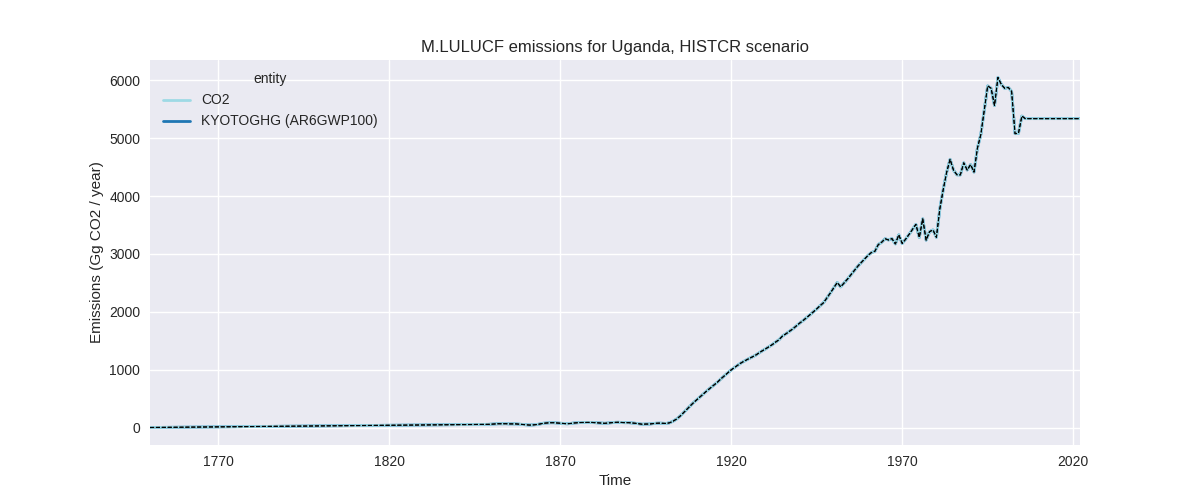
The following figures show the aggregate national total emissions excluding LULUCF AR6GWP100 for the country reported priority scenario. The dotted linesshow the v2.5_final data.

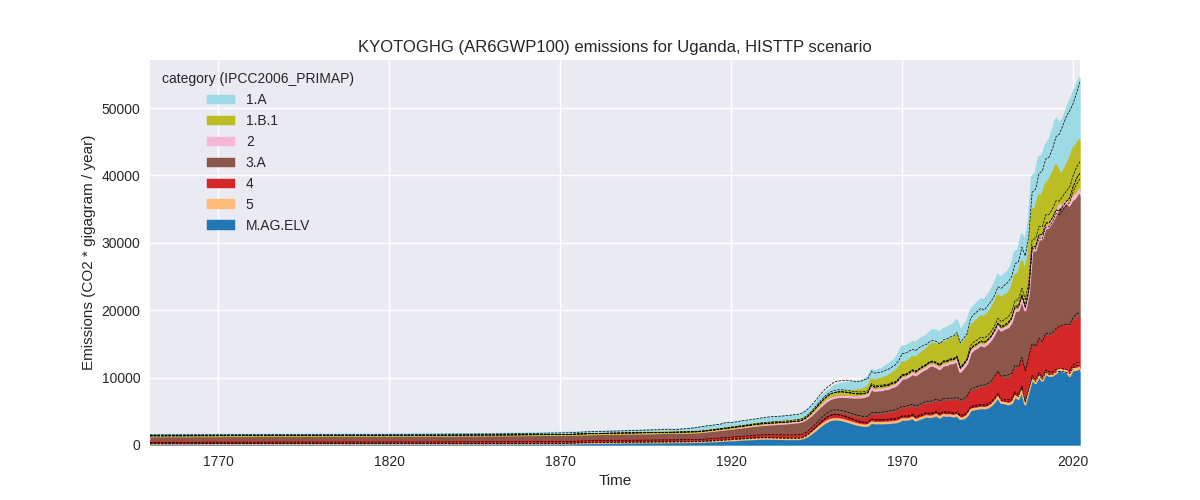
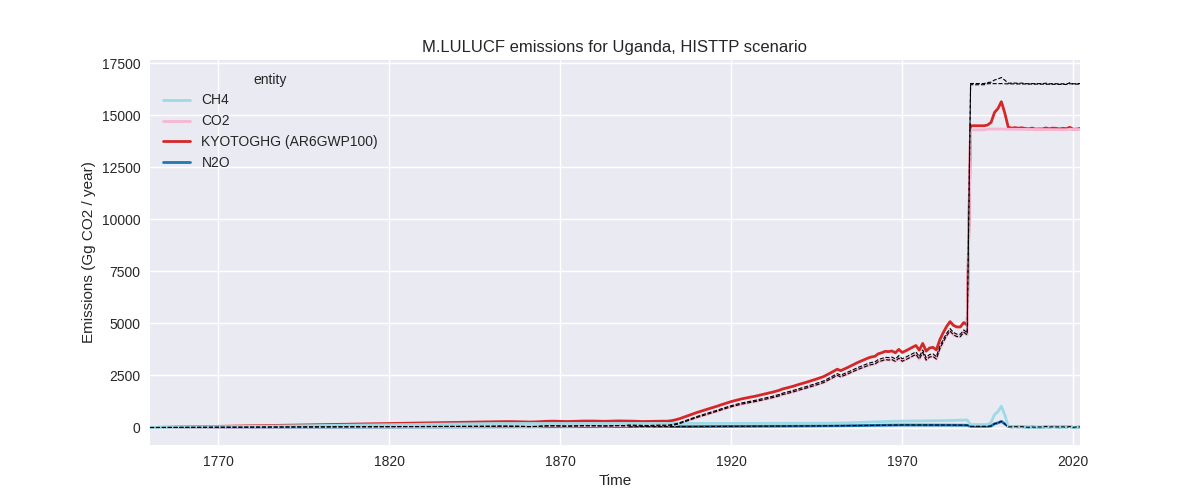
The following figures show the aggregate national total emissions excluding LULUCF AR6GWP100 for the third party priority scenario. The dotted linesshow the v2.5_final data.

Overview over changes
In the country reported priority scenario we have the following changes for aggregate Kyoto GHG and national total emissions excluding LULUCF (M.0.EL):
- Emissions in 2022 have changed by 0.9%% (502.77 Gg CO2 / year)
- Emissions in 1990-2022 have changed by 5.0%% (1688.40 Gg CO2 / year)
In the third party priority scenario we have the following changes for aggregate Kyoto GHG and national total emissions excluding LULUCF (M.0.EL):
- Emissions in 2022 have changed by 0.9%% (502.77 Gg CO2 / year)
- Emissions in 1990-2022 have changed by 5.0%% (1688.40 Gg CO2 / year)
Most important changes per scenario and time frame
In the country reported priority scenario the following sector-gas combinations have the highest absolute impact on national total KyotoGHG (AR6GWP100) emissions in 2022 (top 5):
- 1: 1.B.1, CH4 with 5607.95 Gg CO2 / year (332.2%)
- 2: 1.A, CH4 with -2680.13 Gg CO2 / year (-48.9%)
- 3: 3.A, CH4 with -1650.42 Gg CO2 / year (-8.5%)
- 4: M.AG.ELV, N2O with -1097.51 Gg CO2 / year (-9.9%)
- 5: M.AG.ELV, CH4 with 346.56 Gg CO2 / year (48.1%)
In the country reported priority scenario the following sector-gas combinations have the highest absolute impact on national total KyotoGHG (AR6GWP100) emissions in 1990-2022 (top 5):
- 1: 1.B.1, CH4 with 4413.65 Gg CO2 / year (428.3%)
- 2: 1.A, CH4 with -1926.08 Gg CO2 / year (-49.0%)
- 3: M.AG.ELV, N2O with -568.11 Gg CO2 / year (-7.7%)
- 4: 1.A, N2O with -219.67 Gg CO2 / year (-39.7%)
- 5: 3.A, CH4 with -86.07 Gg CO2 / year (-0.8%)
In the third party priority scenario the following sector-gas combinations have the highest absolute impact on national total KyotoGHG (AR6GWP100) emissions in 2022 (top 5):
- 1: 1.B.1, CH4 with 5607.95 Gg CO2 / year (332.2%)
- 2: 1.A, CH4 with -2680.13 Gg CO2 / year (-48.9%)
- 3: 3.A, CH4 with -1650.42 Gg CO2 / year (-8.5%)
- 4: M.AG.ELV, N2O with -1097.51 Gg CO2 / year (-9.9%)
- 5: M.AG.ELV, CH4 with 346.56 Gg CO2 / year (48.1%)
In the third party priority scenario the following sector-gas combinations have the highest absolute impact on national total KyotoGHG (AR6GWP100) emissions in 1990-2022 (top 5):
- 1: 1.B.1, CH4 with 4413.65 Gg CO2 / year (428.3%)
- 2: 1.A, CH4 with -1926.08 Gg CO2 / year (-49.0%)
- 3: M.AG.ELV, N2O with -568.11 Gg CO2 / year (-7.7%)
- 4: 1.A, N2O with -219.67 Gg CO2 / year (-39.7%)
- 5: 3.A, CH4 with -86.07 Gg CO2 / year (-0.8%)
Notes on data changes
Here we list notes explaining important emissions changes for the country. ’' means that the following text only applies to the TP time series, while means that it only applies to the CR scenario. Otherwise the note applies to both scenarios.
- 1.A, CH4: We have no country reported data for Uganda, thus the CR and TP time-series are identical except for LULUCF.
- 1.B.1, CH4: EDGAR 8.0 emissions are much higher than EDGAR 7.0 for all years.
- 1.A, CH4: EDGAR 8.0 data are much lower than EDGAR 7.0 for all years.
- 3.A, CH4: FAO 2023 emissions differ from FAO 2022 for the last years.
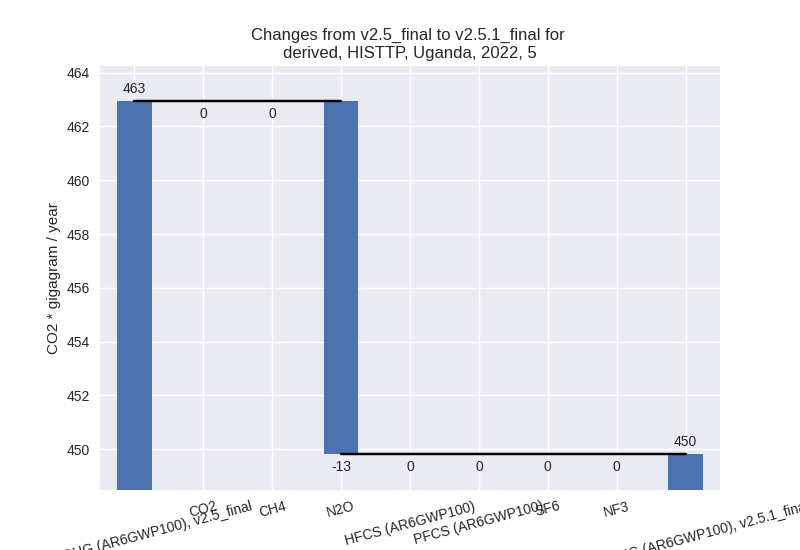
Changes by sector and gas
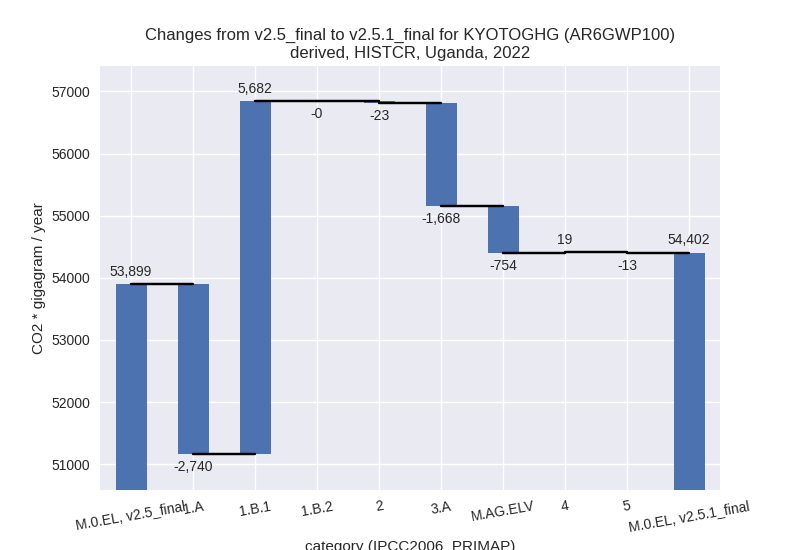
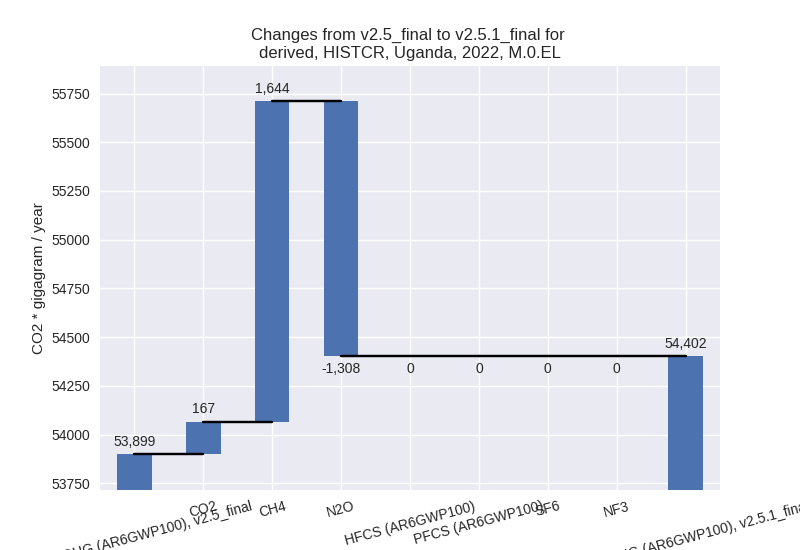
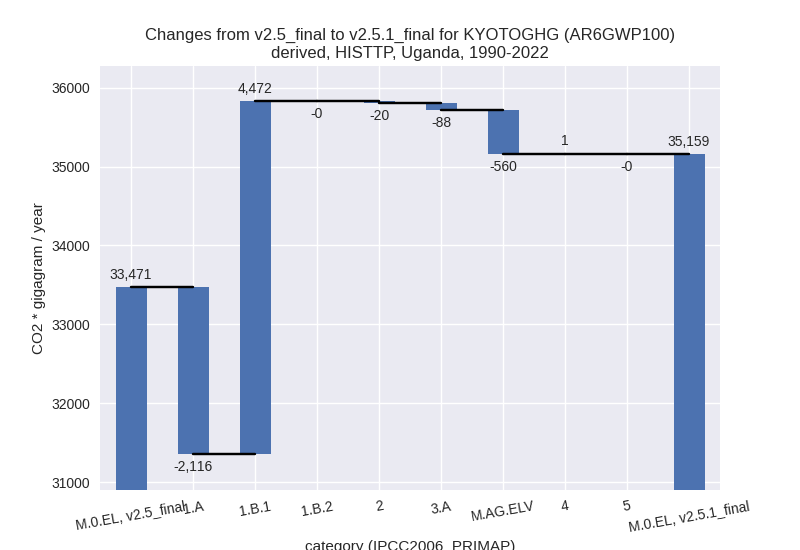
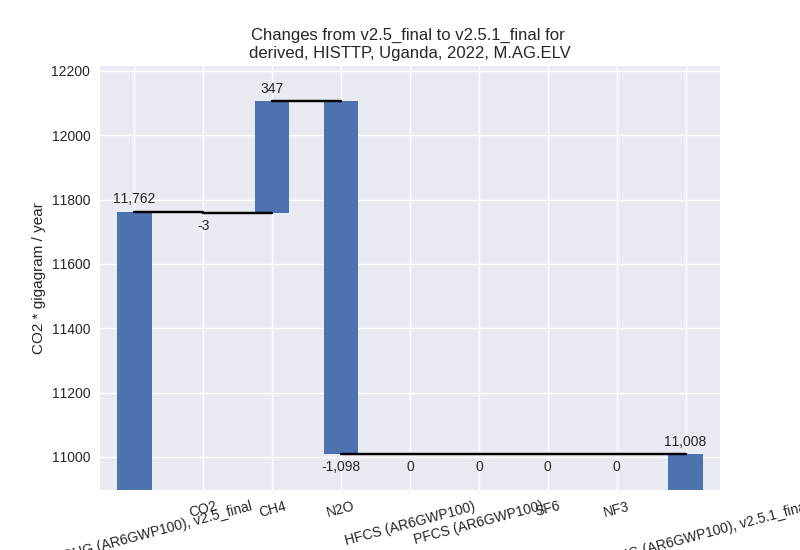
For each scenario and time frame the changes are displayed for all individual sectors and all individual gases. In the sector plot we use aggregate Kyoto GHGs in AR6GWP100. In the gas plot we usenational total emissions without LULUCF. ## country reported scenario
2022
1990-2022


third party scenario
2022


1990-2022

Detailed changes for the scenarios:
country reported scenario (HISTCR):
Most important changes per time frame
For 2022 the following sector-gas combinations have the highest absolute impact on national total KyotoGHG (AR6GWP100) emissions in 2022 (top 5):
- 1: 1.B.1, CH4 with 5607.95 Gg CO2 / year (332.2%)
- 2: 1.A, CH4 with -2680.13 Gg CO2 / year (-48.9%)
- 3: 3.A, CH4 with -1650.42 Gg CO2 / year (-8.5%)
- 4: M.AG.ELV, N2O with -1097.51 Gg CO2 / year (-9.9%)
- 5: M.AG.ELV, CH4 with 346.56 Gg CO2 / year (48.1%)
For 1990-2022 the following sector-gas combinations have the highest absolute impact on national total KyotoGHG (AR6GWP100) emissions in 1990-2022 (top 5):
- 1: 1.B.1, CH4 with 4413.65 Gg CO2 / year (428.3%)
- 2: 1.A, CH4 with -1926.08 Gg CO2 / year (-49.0%)
- 3: M.AG.ELV, N2O with -568.11 Gg CO2 / year (-7.7%)
- 4: 1.A, N2O with -219.67 Gg CO2 / year (-39.7%)
- 5: 3.A, CH4 with -86.07 Gg CO2 / year (-0.8%)
Changes in the main sectors for aggregate KyotoGHG (AR6GWP100) are
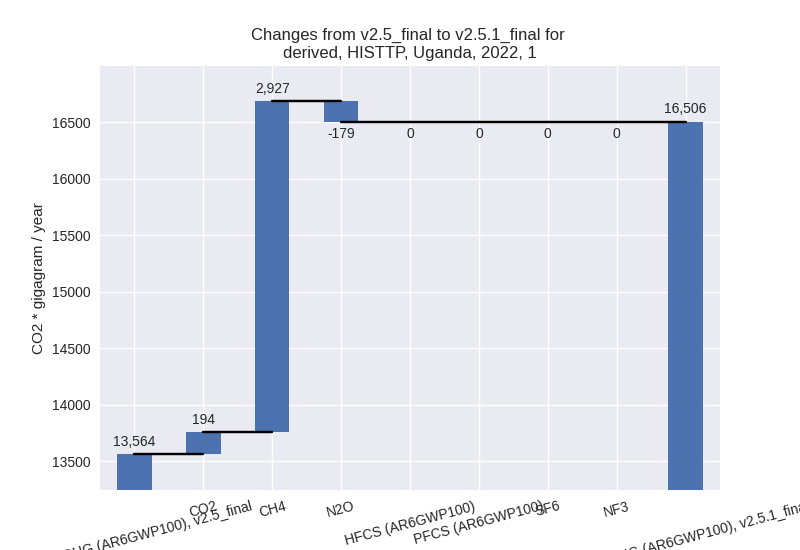
- 1: Total sectoral emissions in 2022 are 16505.97 Gg
CO2 / year which is 30.3% of M.0.EL emissions. 2022 Emissions have
changed by 21.7% (2942.11 Gg CO2 /
year). 1990-2022 Emissions have changed by 29.2% (2356.08 Gg CO2 / year). For 2022
the changes per gas
are:

For 1990-2022 the changes per gas are:
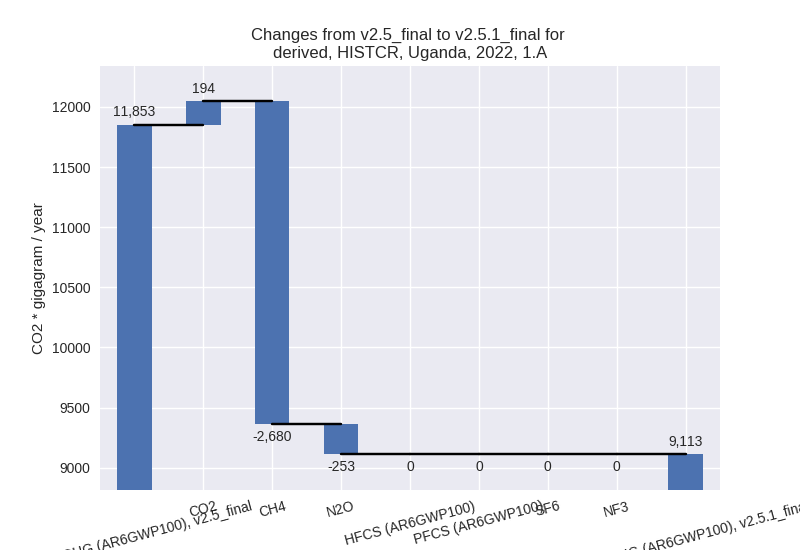
The changes come from the following subsectors:- 1.A: Total sectoral emissions in 2022 are 9112.98
Gg CO2 / year which is 55.2% of category 1 emissions. 2022 Emissions
have changed by -23.1% (-2739.76 Gg
CO2 / year). 1990-2022 Emissions have changed by -30.1% (-2115.99 Gg CO2 / year). For 2022
the changes per gas
are:
For 1990-2022 the changes per gas are:
There is no subsector information available in PRIMAP-hist. - 1.B.1: Total sectoral emissions in 2022 are 7392.99
Gg CO2 / year which is 44.8% of category 1 emissions. 2022 Emissions
have changed by 332.2% (5682.30 Gg
CO2 / year). 1990-2022 Emissions have changed by 428.3% (4472.16 Gg CO2 / year). For 2022
the changes per gas
are:

For 1990-2022 the changes per gas are: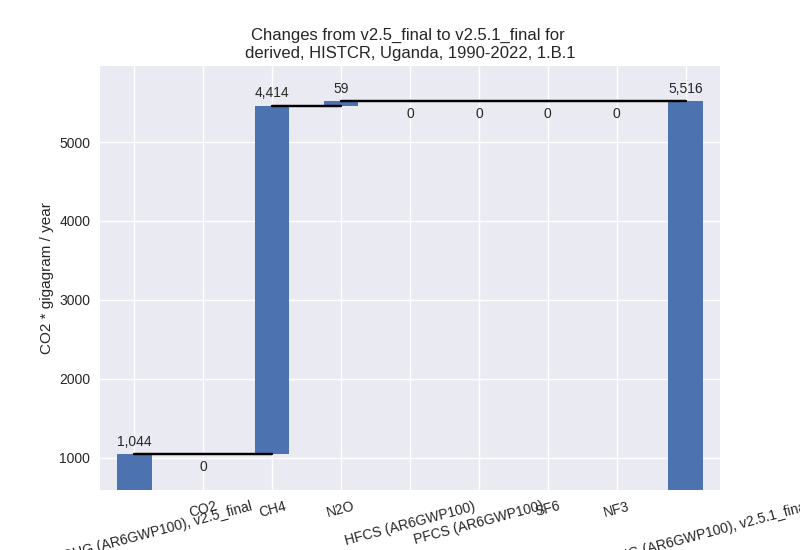
There is no subsector information available in PRIMAP-hist. - 1.B.2: Total sectoral emissions in 2022 are nan Gg
CO2 / year which is nan% of category 1 emissions. 2022 Emissions have
changed by -100.0% (-0.43 Gg CO2 /
year). 1990-2022 Emissions have changed by -100.0% (-0.09 Gg CO2 / year). For 2022
the changes per gas
are:
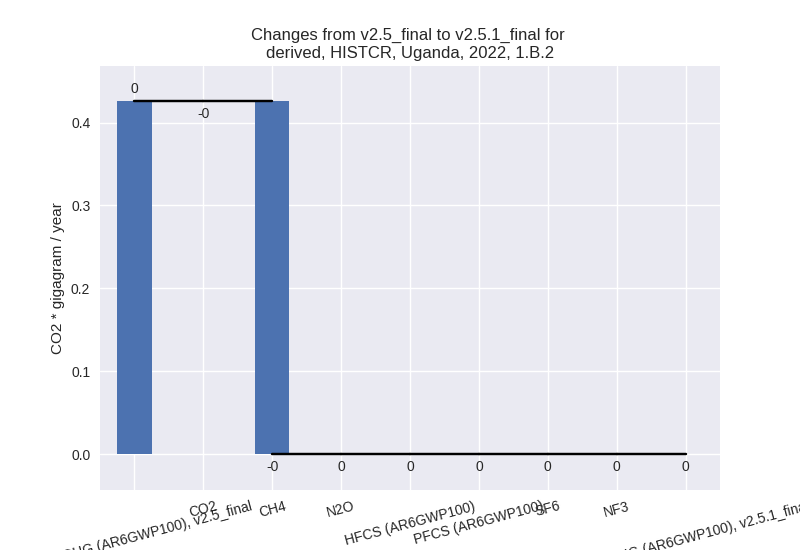
For 1990-2022 the changes per gas are:
There is no subsector information available in PRIMAP-hist.
- 1.A: Total sectoral emissions in 2022 are 9112.98
Gg CO2 / year which is 55.2% of category 1 emissions. 2022 Emissions
have changed by -23.1% (-2739.76 Gg
CO2 / year). 1990-2022 Emissions have changed by -30.1% (-2115.99 Gg CO2 / year). For 2022
the changes per gas
are:
- 2: Total sectoral emissions in 2022 are 818.34 Gg
CO2 / year which is 1.5% of M.0.EL emissions. 2022 Emissions have
changed by -2.8% (-23.37 Gg CO2 /
year). 1990-2022 Emissions have changed by -5.5% (-19.87 Gg CO2 / year). For 2022 the
changes per gas
are:

For 1990-2022 the changes per gas are: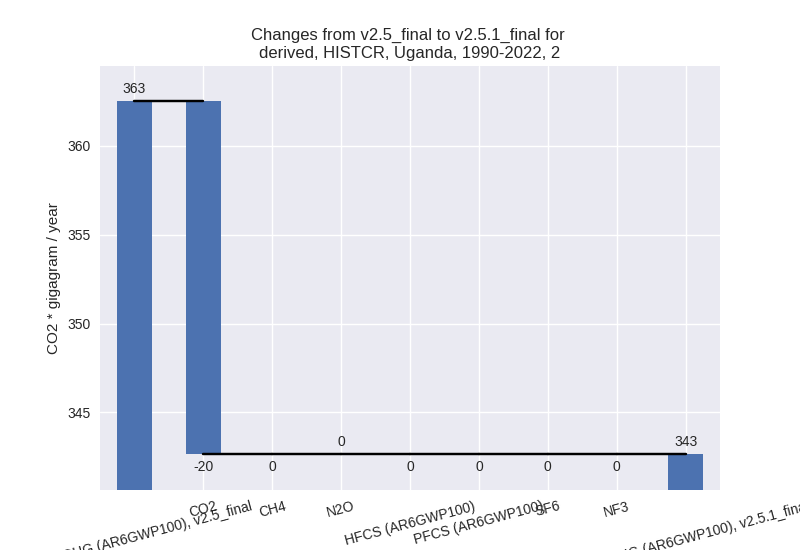
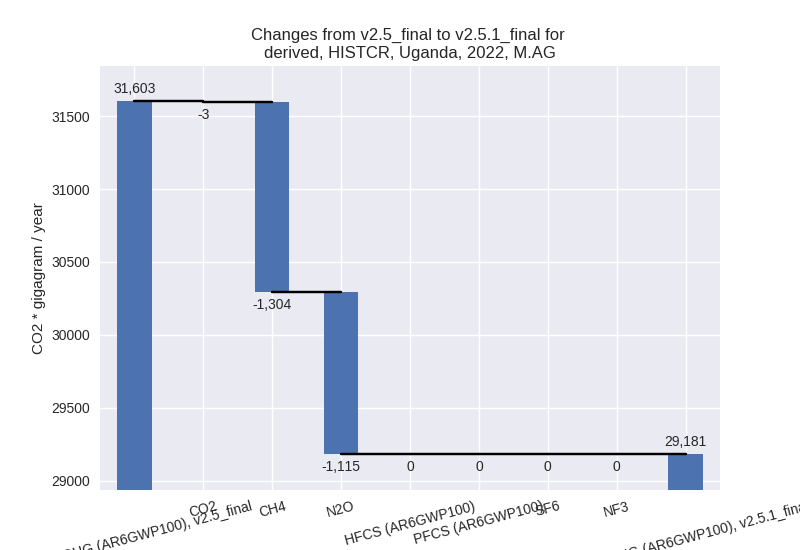
- M.AG: Total sectoral emissions in 2022 are 29180.85
Gg CO2 / year which is 53.6% of M.0.EL emissions. 2022 Emissions have
changed by -7.7% (-2422.05 Gg CO2 /
year). 1990-2022 Emissions have changed by -3.2% (-647.99 Gg CO2 / year). For 2022
the changes per gas
are:
For 1990-2022 the changes per gas are: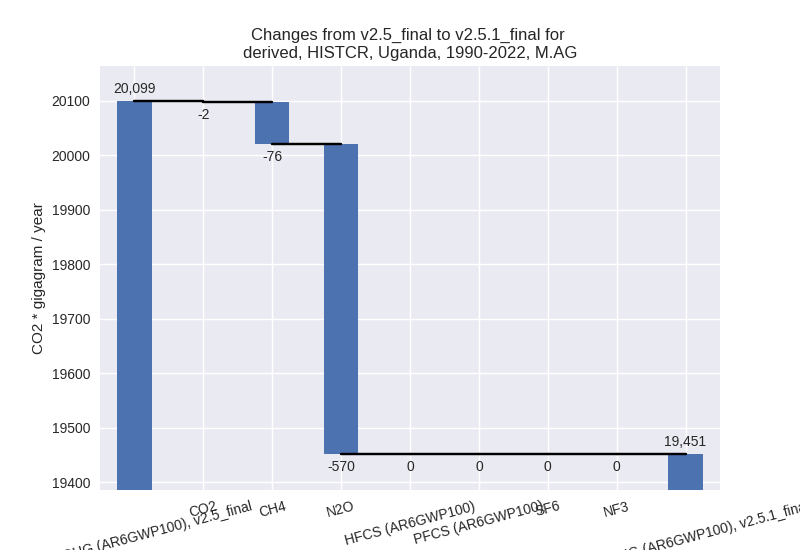
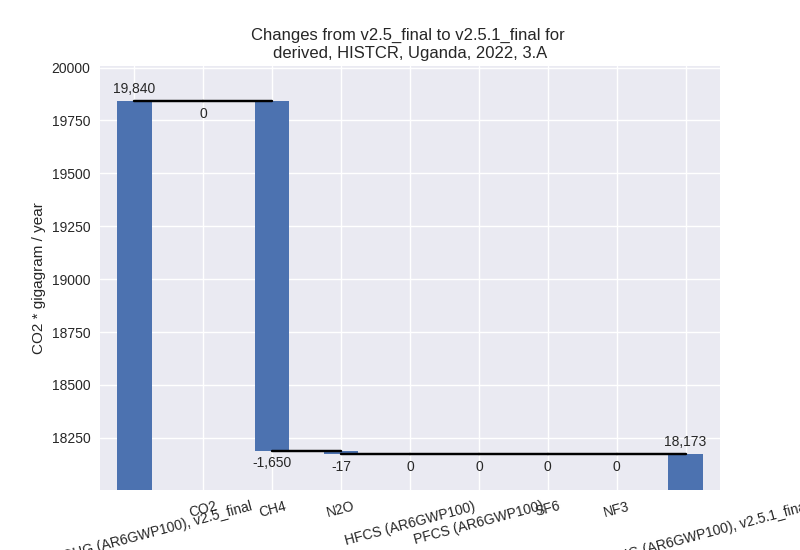
The changes come from the following subsectors:- 3.A: Total sectoral emissions in 2022 are 18172.57
Gg CO2 / year which is 62.3% of category M.AG emissions. 2022 Emissions
have changed by -8.4% (-1667.84 Gg
CO2 / year). 1990-2022 Emissions have changed by -0.8% (-87.84 Gg CO2 / year). For 2022 the
changes per gas
are:
There is no subsector information available in PRIMAP-hist. - M.AG.ELV: Total sectoral emissions in 2022 are
11008.28 Gg CO2 / year which is 37.7% of category M.AG emissions. 2022
Emissions have changed by -6.4%
(-754.21 Gg CO2 / year). 1990-2022 Emissions have changed by -6.6% (-560.16 Gg CO2 / year). For 2022
the changes per gas
are:

For 1990-2022 the changes per gas are:
There is no subsector information available in PRIMAP-hist.
- 3.A: Total sectoral emissions in 2022 are 18172.57
Gg CO2 / year which is 62.3% of category M.AG emissions. 2022 Emissions
have changed by -8.4% (-1667.84 Gg
CO2 / year). 1990-2022 Emissions have changed by -0.8% (-87.84 Gg CO2 / year). For 2022 the
changes per gas
are:
- 4: Total sectoral emissions in 2022 are 7447.19 Gg CO2 / year which is 13.7% of M.0.EL emissions. 2022 Emissions have changed by 0.3% (19.20 Gg CO2 / year). 1990-2022 Emissions have changed by 0.0% (0.58 Gg CO2 / year).
- 5: Total sectoral emissions in 2022 are 449.81 Gg
CO2 / year which is 0.8% of M.0.EL emissions. 2022 Emissions have
changed by -2.8% (-13.12 Gg CO2 /
year). 1990-2022 Emissions have changed by -0.1% (-0.40 Gg CO2 / year). For 2022 the
changes per gas
are:

third party scenario (HISTTP):
Most important changes per time frame
For 2022 the following sector-gas combinations have the highest absolute impact on national total KyotoGHG (AR6GWP100) emissions in 2022 (top 5):
- 1: 1.B.1, CH4 with 5607.95 Gg CO2 / year (332.2%)
- 2: 1.A, CH4 with -2680.13 Gg CO2 / year (-48.9%)
- 3: 3.A, CH4 with -1650.42 Gg CO2 / year (-8.5%)
- 4: M.AG.ELV, N2O with -1097.51 Gg CO2 / year (-9.9%)
- 5: M.AG.ELV, CH4 with 346.56 Gg CO2 / year (48.1%)
For 1990-2022 the following sector-gas combinations have the highest absolute impact on national total KyotoGHG (AR6GWP100) emissions in 1990-2022 (top 5):
- 1: 1.B.1, CH4 with 4413.65 Gg CO2 / year (428.3%)
- 2: 1.A, CH4 with -1926.08 Gg CO2 / year (-49.0%)
- 3: M.AG.ELV, N2O with -568.11 Gg CO2 / year (-7.7%)
- 4: 1.A, N2O with -219.67 Gg CO2 / year (-39.7%)
- 5: 3.A, CH4 with -86.07 Gg CO2 / year (-0.8%)
Changes in the main sectors for aggregate KyotoGHG (AR6GWP100) are
- 1: Total sectoral emissions in 2022 are 16505.97 Gg
CO2 / year which is 30.3% of M.0.EL emissions. 2022 Emissions have
changed by 21.7% (2942.11 Gg CO2 /
year). 1990-2022 Emissions have changed by 29.2% (2356.08 Gg CO2 / year). For 2022
the changes per gas
are:
For 1990-2022 the changes per gas are: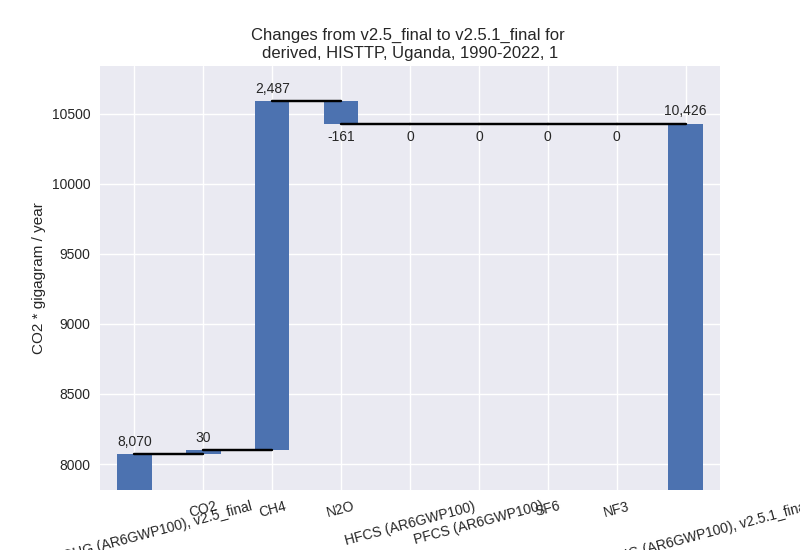
The changes come from the following subsectors:- 1.A: Total sectoral emissions in 2022 are 9112.98
Gg CO2 / year which is 55.2% of category 1 emissions. 2022 Emissions
have changed by -23.1% (-2739.76 Gg
CO2 / year). 1990-2022 Emissions have changed by -30.1% (-2115.99 Gg CO2 / year). For 2022
the changes per gas
are:

For 1990-2022 the changes per gas are:
There is no subsector information available in PRIMAP-hist. - 1.B.1: Total sectoral emissions in 2022 are 7392.99
Gg CO2 / year which is 44.8% of category 1 emissions. 2022 Emissions
have changed by 332.2% (5682.30 Gg
CO2 / year). 1990-2022 Emissions have changed by 428.3% (4472.16 Gg CO2 / year). For 2022
the changes per gas
are:

For 1990-2022 the changes per gas are:
There is no subsector information available in PRIMAP-hist. - 1.B.2: Total sectoral emissions in 2022 are nan Gg
CO2 / year which is nan% of category 1 emissions. 2022 Emissions have
changed by -100.0% (-0.43 Gg CO2 /
year). 1990-2022 Emissions have changed by -100.0% (-0.09 Gg CO2 / year). For 2022
the changes per gas
are:

For 1990-2022 the changes per gas are:
There is no subsector information available in PRIMAP-hist.
- 1.A: Total sectoral emissions in 2022 are 9112.98
Gg CO2 / year which is 55.2% of category 1 emissions. 2022 Emissions
have changed by -23.1% (-2739.76 Gg
CO2 / year). 1990-2022 Emissions have changed by -30.1% (-2115.99 Gg CO2 / year). For 2022
the changes per gas
are:
- 2: Total sectoral emissions in 2022 are 818.34 Gg
CO2 / year which is 1.5% of M.0.EL emissions. 2022 Emissions have
changed by -2.8% (-23.37 Gg CO2 /
year). 1990-2022 Emissions have changed by -5.5% (-19.87 Gg CO2 / year). For 2022 the
changes per gas
are:

For 1990-2022 the changes per gas are:
- M.AG: Total sectoral emissions in 2022 are 29180.85
Gg CO2 / year which is 53.6% of M.0.EL emissions. 2022 Emissions have
changed by -7.7% (-2422.05 Gg CO2 /
year). 1990-2022 Emissions have changed by -3.2% (-647.99 Gg CO2 / year). For 2022
the changes per gas
are:

For 1990-2022 the changes per gas are:
The changes come from the following subsectors:- 3.A: Total sectoral emissions in 2022 are 18172.57
Gg CO2 / year which is 62.3% of category M.AG emissions. 2022 Emissions
have changed by -8.4% (-1667.84 Gg
CO2 / year). 1990-2022 Emissions have changed by -0.8% (-87.84 Gg CO2 / year). For 2022 the
changes per gas
are:

There is no subsector information available in PRIMAP-hist. - M.AG.ELV: Total sectoral emissions in 2022 are
11008.28 Gg CO2 / year which is 37.7% of category M.AG emissions. 2022
Emissions have changed by -6.4%
(-754.21 Gg CO2 / year). 1990-2022 Emissions have changed by -6.6% (-560.16 Gg CO2 / year). For 2022
the changes per gas
are:
For 1990-2022 the changes per gas are: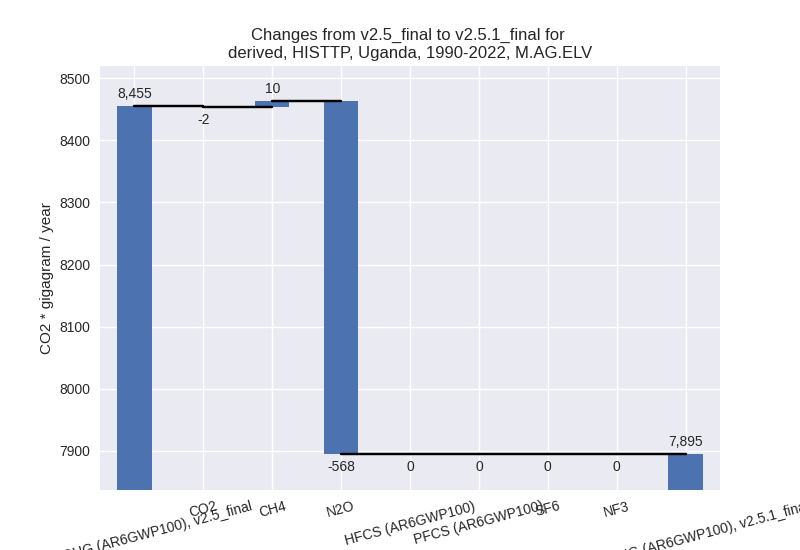
There is no subsector information available in PRIMAP-hist.
- 3.A: Total sectoral emissions in 2022 are 18172.57
Gg CO2 / year which is 62.3% of category M.AG emissions. 2022 Emissions
have changed by -8.4% (-1667.84 Gg
CO2 / year). 1990-2022 Emissions have changed by -0.8% (-87.84 Gg CO2 / year). For 2022 the
changes per gas
are:
- 4: Total sectoral emissions in 2022 are 7447.19 Gg CO2 / year which is 13.7% of M.0.EL emissions. 2022 Emissions have changed by 0.3% (19.20 Gg CO2 / year). 1990-2022 Emissions have changed by 0.0% (0.58 Gg CO2 / year).
- 5: Total sectoral emissions in 2022 are 449.81 Gg
CO2 / year which is 0.8% of M.0.EL emissions. 2022 Emissions have
changed by -2.8% (-13.12 Gg CO2 /
year). 1990-2022 Emissions have changed by -0.1% (-0.40 Gg CO2 / year). For 2022 the
changes per gas
are: