Changes in PRIMAP-hist v2.5.1_final compared to v2.5_final for Ukraine
2024-02-29
Johannes Gütschow
Change analysis for Ukraine for PRIMAP-hist v2.5.1_final compared to v2.5_final
Overview over emissions by sector and gas
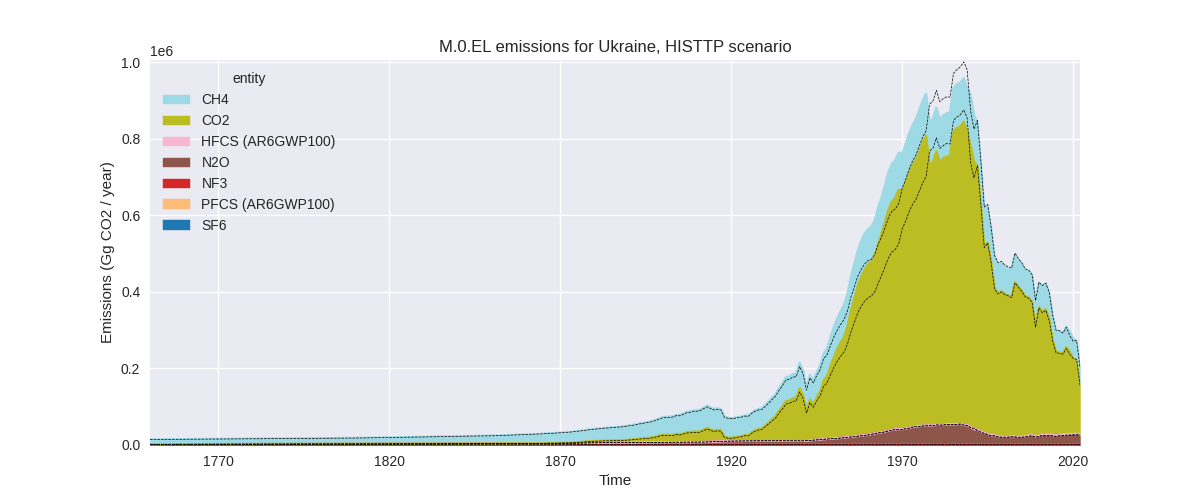
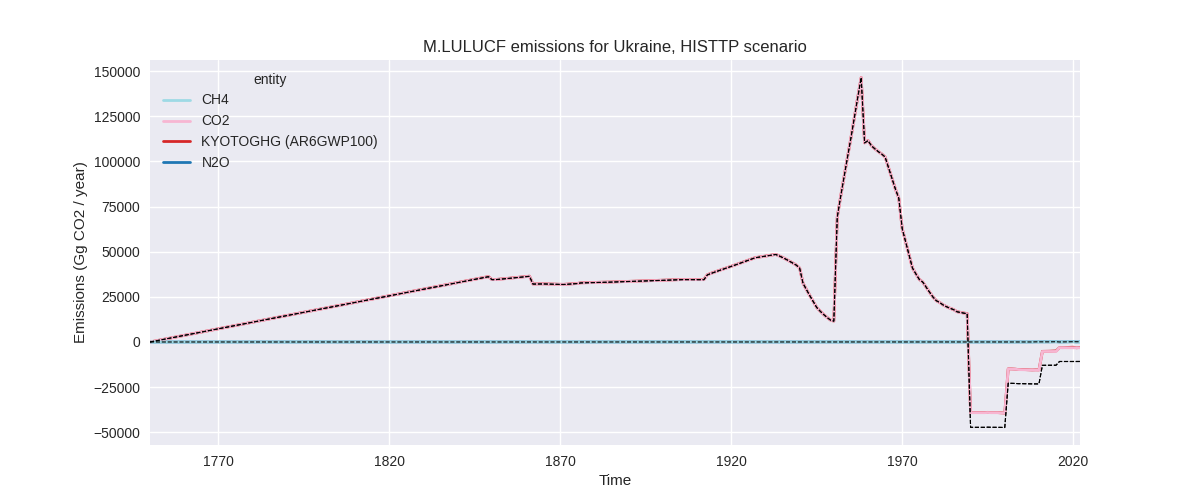
The following figures show the aggregate national total emissions excluding LULUCF AR6GWP100 for the country reported priority scenario. The dotted linesshow the v2.5_final data.

The following figures show the aggregate national total emissions excluding LULUCF AR6GWP100 for the third party priority scenario. The dotted linesshow the v2.5_final data.
Overview over changes
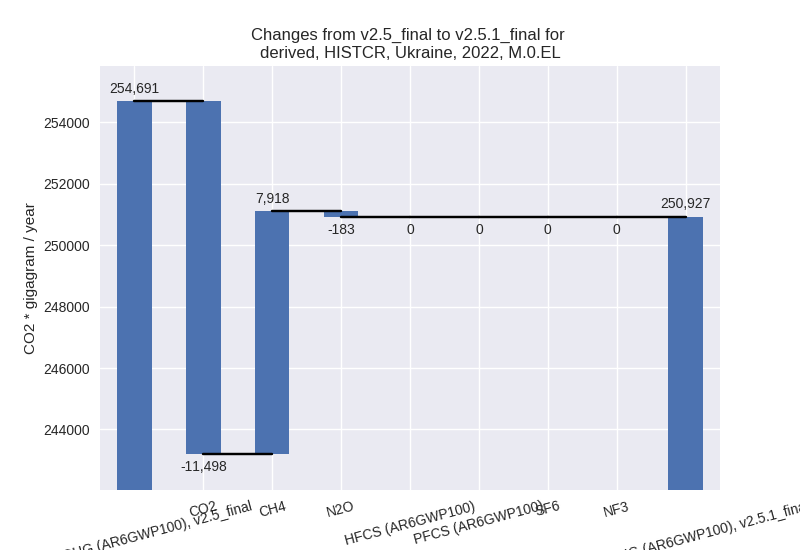
In the country reported priority scenario we have the following changes for aggregate Kyoto GHG and national total emissions excluding LULUCF (M.0.EL):
- Emissions in 2022 have changed by -1.5%% (-3763.62 Gg CO2 / year)
- Emissions in 1990-2022 have changed by -0.0%% (-114.01 Gg CO2 / year)
In the third party priority scenario we have the following changes for aggregate Kyoto GHG and national total emissions excluding LULUCF (M.0.EL):
- Emissions in 2022 have changed by 1.2%% (2419.60 Gg CO2 / year)
- Emissions in 1990-2022 have changed by -0.0%% (-55.13 Gg CO2 / year)
Most important changes per scenario and time frame
In the country reported priority scenario the following sector-gas combinations have the highest absolute impact on national total KyotoGHG (AR6GWP100) emissions in 2022 (top 5):
- 1: 2, CO2 with -11488.06 Gg CO2 / year (-27.0%)
- 2: 1.B.2, CH4 with 10679.41 Gg CO2 / year (34.0%)
- 3: 1.B.1, CH4 with -1253.88 Gg CO2 / year (-12.5%)
- 4: 3.A, CH4 with -961.99 Gg CO2 / year (-10.8%)
- 5: 2, N2O with 392.68 Gg CO2 / year (30.8%)
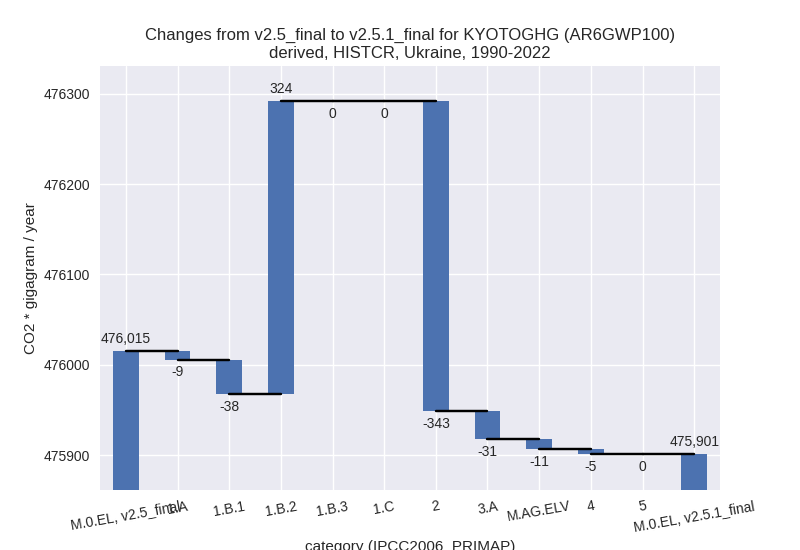
In the country reported priority scenario the following sector-gas combinations have the highest absolute impact on national total KyotoGHG (AR6GWP100) emissions in 1990-2022 (top 5):
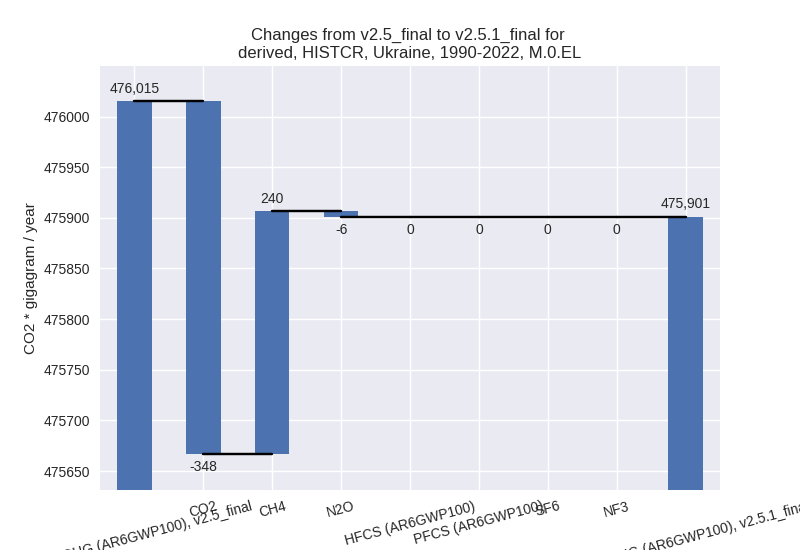
- 1: 2, CO2 with -348.12 Gg CO2 / year (-0.5%)
- 2: 1.B.2, CH4 with 323.62 Gg CO2 / year (0.7%)
- 3: 1.B.1, CH4 with -38.00 Gg CO2 / year (-0.1%)
- 4: 3.A, CH4 with -29.15 Gg CO2 / year (-0.1%)
- 5: 2, N2O with 11.90 Gg CO2 / year (0.4%)
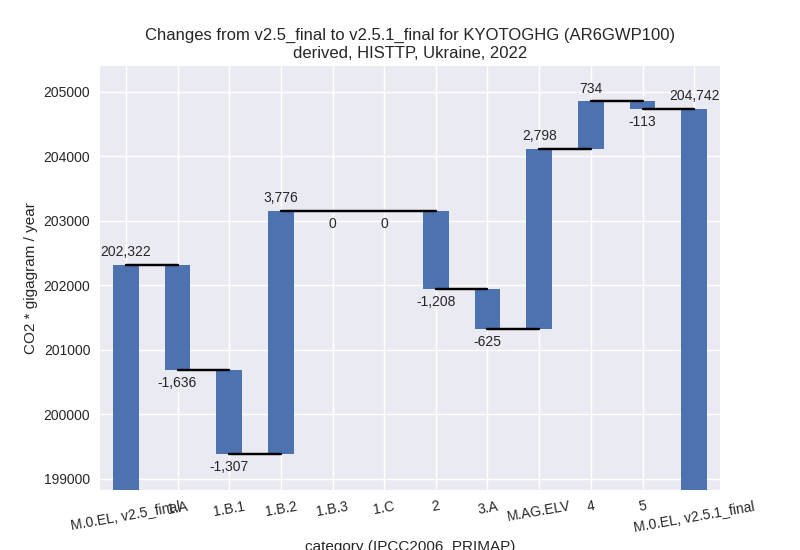
In the third party priority scenario the following sector-gas combinations have the highest absolute impact on national total KyotoGHG (AR6GWP100) emissions in 2022 (top 5):
- 1: 1.B.2, CH4 with 3776.67 Gg CO2 / year (17.9%)
- 2: 1.B.1, CH4 with -2408.64 Gg CO2 / year (-38.8%)
- 3: M.AG.ELV, CO2 with 1541.81 Gg CO2 / year (165.4%)
- 4: 1.A, CO2 with -1509.22 Gg CO2 / year (-1.4%)
- 5: M.AG.ELV, N2O with 1488.03 Gg CO2 / year (7.7%)
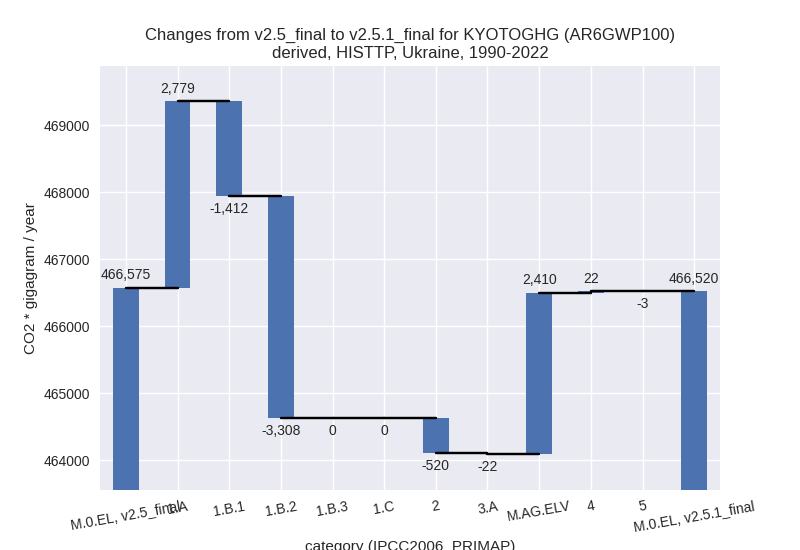
In the third party priority scenario the following sector-gas combinations have the highest absolute impact on national total KyotoGHG (AR6GWP100) emissions in 1990-2022 (top 5):
- 1: 1.B.2, CH4 with -3308.17 Gg CO2 / year (-15.9%)
- 2: 1.A, CO2 with 2779.85 Gg CO2 / year (0.9%)
- 3: M.AG.ELV, N2O with 1357.53 Gg CO2 / year (8.8%)
- 4: M.AG.ELV, CO2 with 1067.11 Gg CO2 / year (146.0%)
- 5: 1.B.1, CO2 with -769.95 Gg CO2 / year (-3.8%)
Notes on data changes
No country specific notes present for this changelog.
Changes by sector and gas
For each scenario and time frame the changes are displayed for all individual sectors and all individual gases. In the sector plot we use aggregate Kyoto GHGs in AR6GWP100. In the gas plot we usenational total emissions without LULUCF. ## country reported scenario
2022

1990-2022
third party scenario
2022

1990-2022

Detailed changes for the scenarios:
country reported scenario (HISTCR):
Most important changes per time frame
For 2022 the following sector-gas combinations have the highest absolute impact on national total KyotoGHG (AR6GWP100) emissions in 2022 (top 5):
- 1: 2, CO2 with -11488.06 Gg CO2 / year (-27.0%)
- 2: 1.B.2, CH4 with 10679.41 Gg CO2 / year (34.0%)
- 3: 1.B.1, CH4 with -1253.88 Gg CO2 / year (-12.5%)
- 4: 3.A, CH4 with -961.99 Gg CO2 / year (-10.8%)
- 5: 2, N2O with 392.68 Gg CO2 / year (30.8%)
For 1990-2022 the following sector-gas combinations have the highest absolute impact on national total KyotoGHG (AR6GWP100) emissions in 1990-2022 (top 5):
- 1: 2, CO2 with -348.12 Gg CO2 / year (-0.5%)
- 2: 1.B.2, CH4 with 323.62 Gg CO2 / year (0.7%)
- 3: 1.B.1, CH4 with -38.00 Gg CO2 / year (-0.1%)
- 4: 3.A, CH4 with -29.15 Gg CO2 / year (-0.1%)
- 5: 2, N2O with 11.90 Gg CO2 / year (0.4%)
Changes in the main sectors for aggregate KyotoGHG (AR6GWP100) are
- 1: Total sectoral emissions in 2022 are 156175.13
Gg CO2 / year which is 62.2% of M.0.EL emissions. 2022 Emissions have
changed by 6.2% (9126.76 Gg CO2 /
year). 1990-2022 Emissions have changed by 0.1% (276.61 Gg CO2 / year). For 2022 the
changes per gas
are:

The changes come from the following subsectors:- 1.A: Total sectoral emissions in 2022 are 103742.52 Gg CO2 / year which is 66.4% of category 1 emissions. 2022 Emissions have changed by -0.3% (-303.03 Gg CO2 / year). 1990-2022 Emissions have changed by -0.0% (-9.18 Gg CO2 / year).
- 1.B.1: Total sectoral emissions in 2022 are 8949.32
Gg CO2 / year which is 5.7% of category 1 emissions. 2022 Emissions have
changed by -12.3% (-1249.56 Gg CO2 /
year). 1990-2022 Emissions have changed by -0.1% (-37.82 Gg CO2 / year). For 2022 the
changes per gas
are:
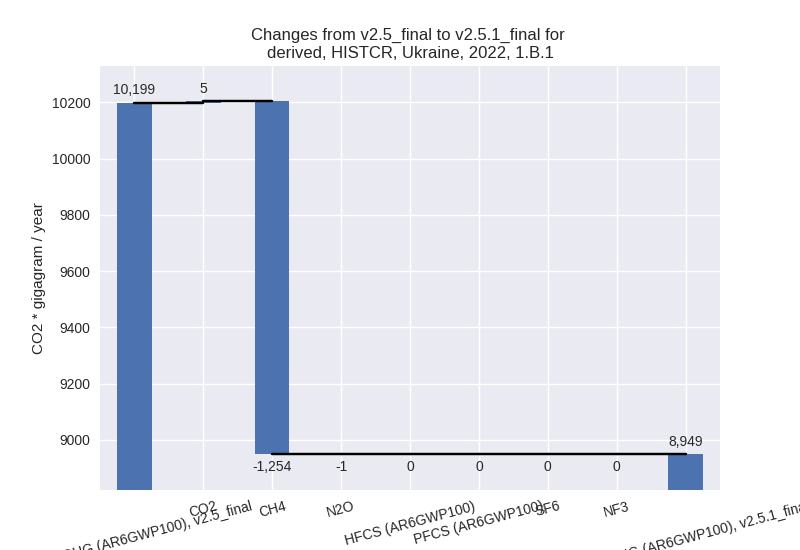
There is no subsector information available in PRIMAP-hist. - 1.B.2: Total sectoral emissions in 2022 are
43483.30 Gg CO2 / year which is 27.8% of category 1 emissions. 2022
Emissions have changed by 32.6%
(10679.36 Gg CO2 / year). 1990-2022 Emissions have changed by 0.6% (323.62 Gg CO2 / year). For 2022 the
changes per gas
are:

There is no subsector information available in PRIMAP-hist.
- 2: Total sectoral emissions in 2022 are 38016.03 Gg
CO2 / year which is 15.2% of M.0.EL emissions. 2022 Emissions have
changed by -22.9% (-11322.54 Gg CO2
/ year). 1990-2022 Emissions have changed by -0.5% (-343.11 Gg CO2 / year). For 2022
the changes per gas
are:

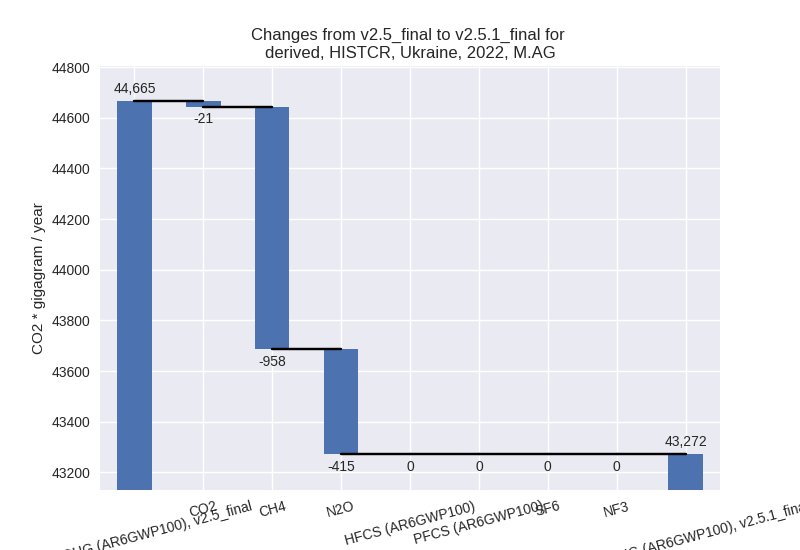
- M.AG: Total sectoral emissions in 2022 are 43272.05
Gg CO2 / year which is 17.2% of M.0.EL emissions. 2022 Emissions have
changed by -3.1% (-1392.98 Gg CO2 /
year). 1990-2022 Emissions have changed by -0.1% (-42.21 Gg CO2 / year). For 2022 the
changes per gas
are:
The changes come from the following subsectors:- 3.A: Total sectoral emissions in 2022 are 8371.97
Gg CO2 / year which is 19.3% of category M.AG emissions. 2022 Emissions
have changed by -10.9% (-1026.79 Gg
CO2 / year). 1990-2022 Emissions have changed by -0.1% (-31.11 Gg CO2 / year). For 2022 the
changes per gas
are:

There is no subsector information available in PRIMAP-hist. - M.AG.ELV: Total sectoral emissions in 2022 are 34900.08 Gg CO2 / year which is 80.7% of category M.AG emissions. 2022 Emissions have changed by -1.0% (-366.20 Gg CO2 / year). 1990-2022 Emissions have changed by -0.0% (-11.10 Gg CO2 / year).
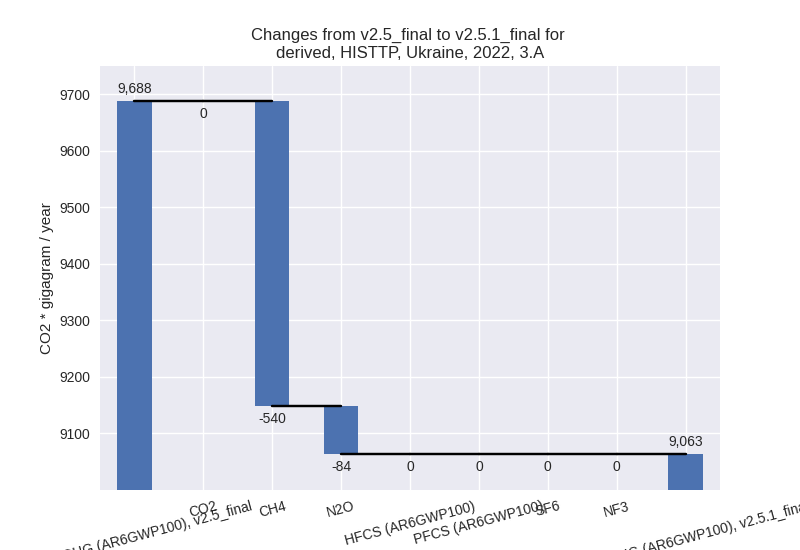
- 3.A: Total sectoral emissions in 2022 are 8371.97
Gg CO2 / year which is 19.3% of category M.AG emissions. 2022 Emissions
have changed by -10.9% (-1026.79 Gg
CO2 / year). 1990-2022 Emissions have changed by -0.1% (-31.11 Gg CO2 / year). For 2022 the
changes per gas
are:
- 4: Total sectoral emissions in 2022 are 13464.07 Gg CO2 / year which is 5.4% of M.0.EL emissions. 2022 Emissions have changed by -1.3% (-174.86 Gg CO2 / year). 1990-2022 Emissions have changed by -0.0% (-5.30 Gg CO2 / year).
- 5: No data
third party scenario (HISTTP):
Most important changes per time frame
For 2022 the following sector-gas combinations have the highest absolute impact on national total KyotoGHG (AR6GWP100) emissions in 2022 (top 5):
- 1: 1.B.2, CH4 with 3776.67 Gg CO2 / year (17.9%)
- 2: 1.B.1, CH4 with -2408.64 Gg CO2 / year (-38.8%)
- 3: M.AG.ELV, CO2 with 1541.81 Gg CO2 / year (165.4%)
- 4: 1.A, CO2 with -1509.22 Gg CO2 / year (-1.4%)
- 5: M.AG.ELV, N2O with 1488.03 Gg CO2 / year (7.7%)
For 1990-2022 the following sector-gas combinations have the highest absolute impact on national total KyotoGHG (AR6GWP100) emissions in 1990-2022 (top 5):
- 1: 1.B.2, CH4 with -3308.17 Gg CO2 / year (-15.9%)
- 2: 1.A, CO2 with 2779.85 Gg CO2 / year (0.9%)
- 3: M.AG.ELV, N2O with 1357.53 Gg CO2 / year (8.8%)
- 4: M.AG.ELV, CO2 with 1067.11 Gg CO2 / year (146.0%)
- 5: 1.B.1, CO2 with -769.95 Gg CO2 / year (-3.8%)
Changes in the main sectors for aggregate KyotoGHG (AR6GWP100) are
- 1: Total sectoral emissions in 2022 are 145396.75 Gg CO2 / year which is 71.0% of M.0.EL emissions. 2022 Emissions have changed by 0.6% (833.62 Gg CO2 / year). 1990-2022 Emissions have changed by -0.5% (-1941.50 Gg CO2 / year).
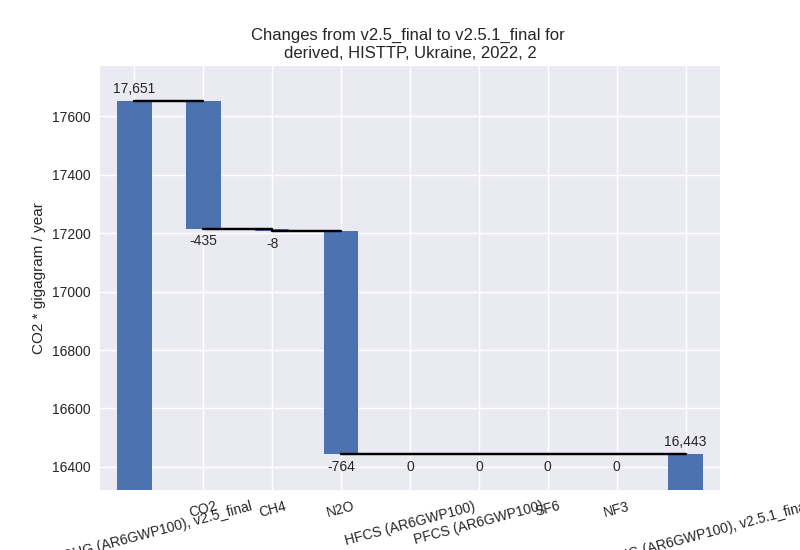
- 2: Total sectoral emissions in 2022 are 16443.45 Gg
CO2 / year which is 8.0% of M.0.EL emissions. 2022 Emissions have
changed by -6.8% (-1207.52 Gg CO2 /
year). 1990-2022 Emissions have changed by -1.9% (-520.45 Gg CO2 / year). For 2022
the changes per gas
are:
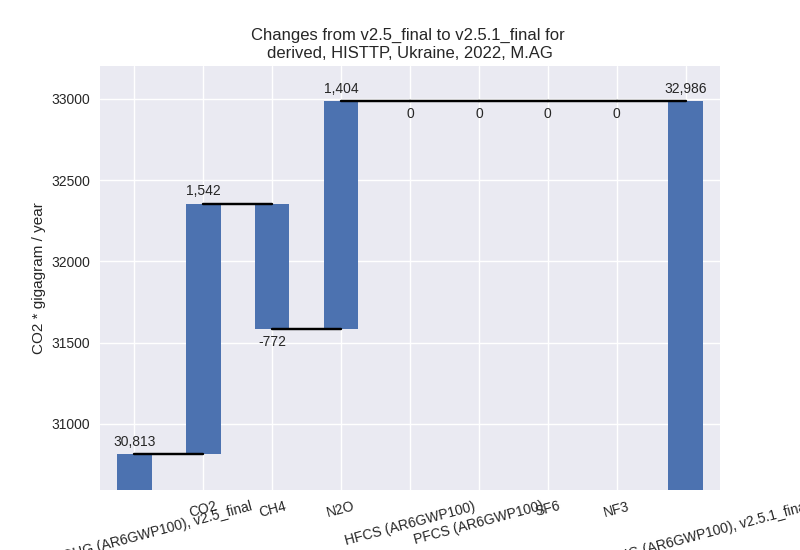
- M.AG: Total sectoral emissions in 2022 are 32985.56
Gg CO2 / year which is 16.1% of M.0.EL emissions. 2022 Emissions have
changed by 7.1% (2173.01 Gg CO2 /
year). 1990-2022 Emissions have changed by 5.3% (2388.09 Gg CO2 / year). For 2022 the
changes per gas
are:
For 1990-2022 the changes per gas are: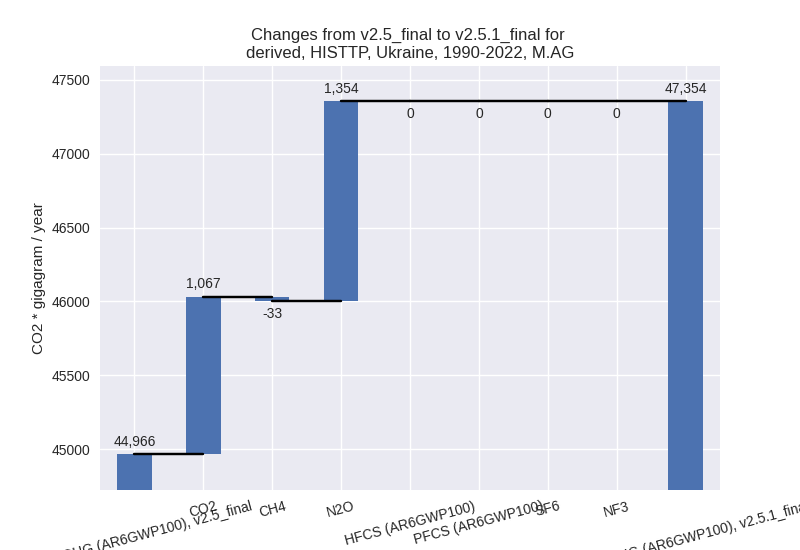
The changes come from the following subsectors:- 3.A: Total sectoral emissions in 2022 are 9063.32
Gg CO2 / year which is 27.5% of category M.AG emissions. 2022 Emissions
have changed by -6.4% (-624.54 Gg
CO2 / year). 1990-2022 Emissions have changed by -0.1% (-22.10 Gg CO2 / year). For 2022 the
changes per gas
are:
There is no subsector information available in PRIMAP-hist. - M.AG.ELV: Total sectoral emissions in 2022 are
23922.24 Gg CO2 / year which is 72.5% of category M.AG emissions. 2022
Emissions have changed by 13.2%
(2797.55 Gg CO2 / year). 1990-2022 Emissions have changed by 14.4% (2410.19 Gg CO2 / year). For 2022
the changes per gas
are:

For 1990-2022 the changes per gas are:
There is no subsector information available in PRIMAP-hist.
- 3.A: Total sectoral emissions in 2022 are 9063.32
Gg CO2 / year which is 27.5% of category M.AG emissions. 2022 Emissions
have changed by -6.4% (-624.54 Gg
CO2 / year). 1990-2022 Emissions have changed by -0.1% (-22.10 Gg CO2 / year). For 2022 the
changes per gas
are:
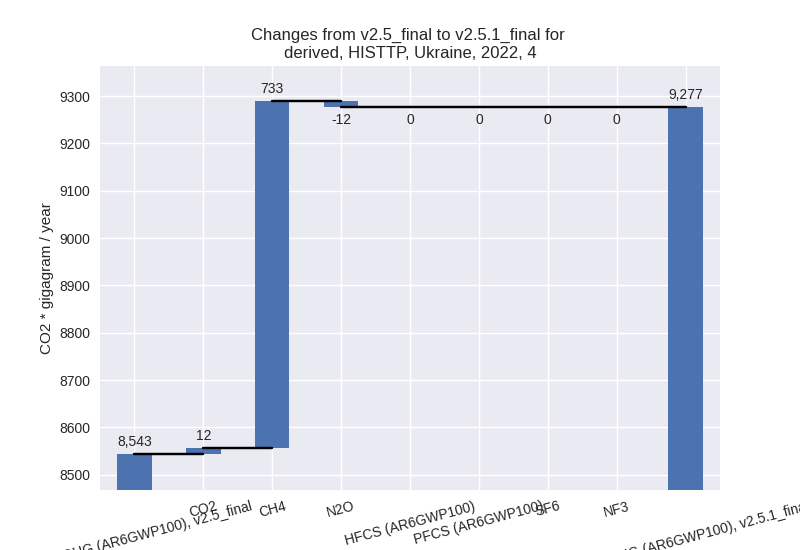
- 4: Total sectoral emissions in 2022 are 9277.01 Gg
CO2 / year which is 4.5% of M.0.EL emissions. 2022 Emissions have
changed by 8.6% (733.55 Gg CO2 /
year). 1990-2022 Emissions have changed by 0.2% (22.16 Gg CO2 / year). For 2022 the
changes per gas
are:
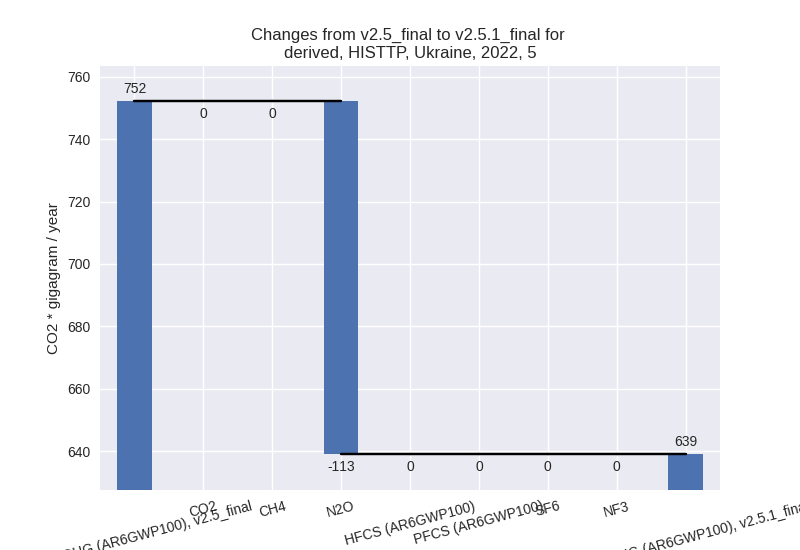
- 5: Total sectoral emissions in 2022 are 639.05 Gg
CO2 / year which is 0.3% of M.0.EL emissions. 2022 Emissions have
changed by -15.0% (-113.05 Gg CO2 /
year). 1990-2022 Emissions have changed by -0.3% (-3.43 Gg CO2 / year). For 2022 the
changes per gas
are: