Changes in PRIMAP-hist v2.5.1_final compared to v2.5_final for UMBRELLA
2024-02-29
Johannes Gütschow
Change analysis for UMBRELLA for PRIMAP-hist v2.5.1_final compared to v2.5_final
Overview over emissions by sector and gas
The following figures show the aggregate national total emissions excluding LULUCF AR6GWP100 for the country reported priority scenario. The dotted linesshow the v2.5_final data.
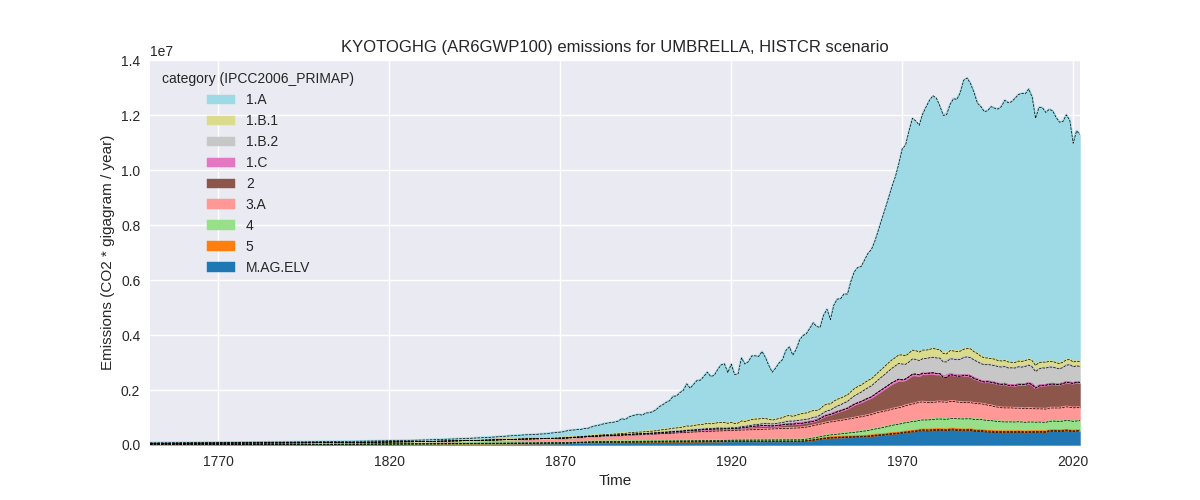
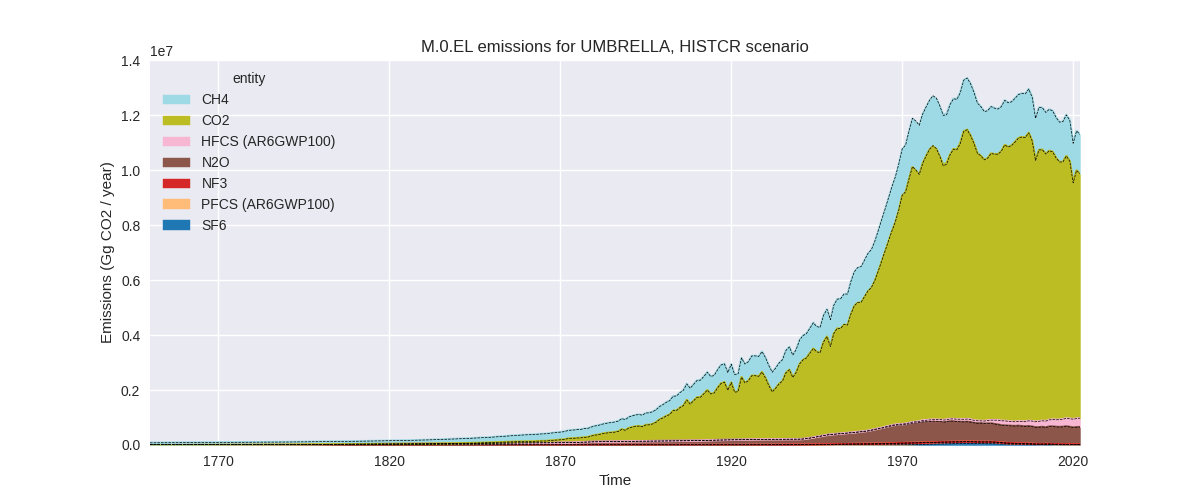
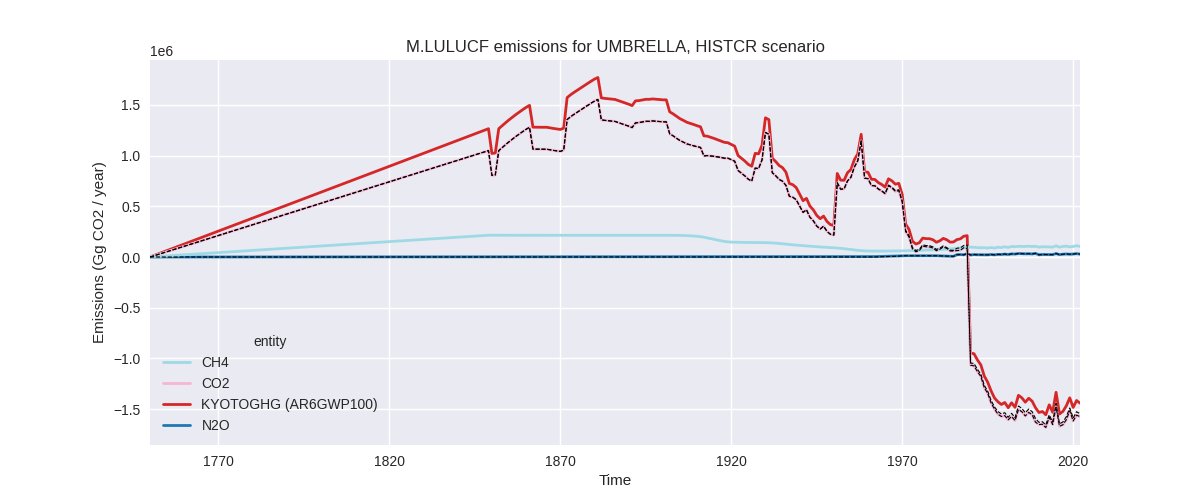
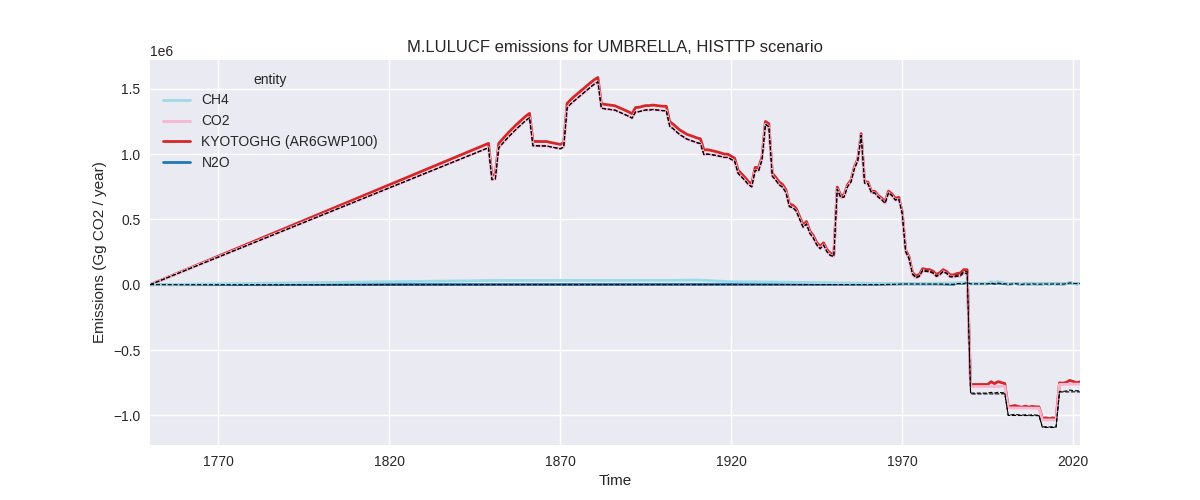
The following figures show the aggregate national total emissions excluding LULUCF AR6GWP100 for the third party priority scenario. The dotted linesshow the v2.5_final data.


Overview over changes
In the country reported priority scenario we have the following changes for aggregate Kyoto GHG and national total emissions excluding LULUCF (M.0.EL):
- Emissions in 2022 have changed by -0.0%% (-1721.00 Gg CO2 / year)
- Emissions in 1990-2022 have changed by -0.0%% (-211.91 Gg CO2 / year)
In the third party priority scenario we have the following changes for aggregate Kyoto GHG and national total emissions excluding LULUCF (M.0.EL):
- Emissions in 2022 have changed by 0.8%% (91398.00 Gg CO2 / year)
- Emissions in 1990-2022 have changed by -0.6%% (-75283.94 Gg CO2 / year)
Most important changes per scenario and time frame
In the country reported priority scenario the following sector-gas combinations have the highest absolute impact on national total KyotoGHG (AR6GWP100) emissions in 2022 (top 5):
- 1: 1.B.2, CH4 with 15066.11 Gg CO2 / year (3.5%)
- 2: M.AG.ELV, N2O with -12488.00 Gg CO2 / year (-2.7%)
- 3: 2, CO2 with -9083.29 Gg CO2 / year (-1.7%)
- 4: 1.A, N2O with 5008.80 Gg CO2 / year (9.3%)
- 5: 4, CH4 with 4888.64 Gg CO2 / year (1.6%)
In the country reported priority scenario the following sector-gas combinations have the highest absolute impact on national total KyotoGHG (AR6GWP100) emissions in 1990-2022 (top 5):
- 1: 1.B.2, CH4 with 456.55 Gg CO2 / year (0.1%)
- 2: M.AG.ELV, N2O with -378.42 Gg CO2 / year (-0.1%)
- 3: 2, CO2 with -275.25 Gg CO2 / year (-0.0%)
- 4: 1.B.1, CO2 with -154.18 Gg CO2 / year (-2.3%)
- 5: 1.A, N2O with 151.78 Gg CO2 / year (0.2%)
In the third party priority scenario the following sector-gas combinations have the highest absolute impact on national total KyotoGHG (AR6GWP100) emissions in 2022 (top 5):
- 1: 1.A, CO2 with 109887.60 Gg CO2 / year (1.3%)
- 2: 2, CO2 with -41159.07 Gg CO2 / year (-10.5%)
- 3: 4, CH4 with 13099.69 Gg CO2 / year (4.4%)
- 4: 1.B.1, CO2 with -9889.68 Gg CO2 / year (-10.4%)
- 5: M.AG.ELV, CO2 with 7423.08 Gg CO2 / year (43.4%)
In the third party priority scenario the following sector-gas combinations have the highest absolute impact on national total KyotoGHG (AR6GWP100) emissions in 1990-2022 (top 5):
- 1: 2, CO2 with -69466.33 Gg CO2 / year (-17.2%)
- 2: 1.B.2, CH4 with -19110.61 Gg CO2 / year (-3.7%)
- 3: 1.A, CO2 with 14152.44 Gg CO2 / year (0.2%)
- 4: 1.B.1, CO2 with -8446.96 Gg CO2 / year (-9.1%)
- 5: M.AG.ELV, N2O with 4144.98 Gg CO2 / year (1.3%)
Notes on data changes
No country specific notes present for this changelog.
Changes by sector and gas
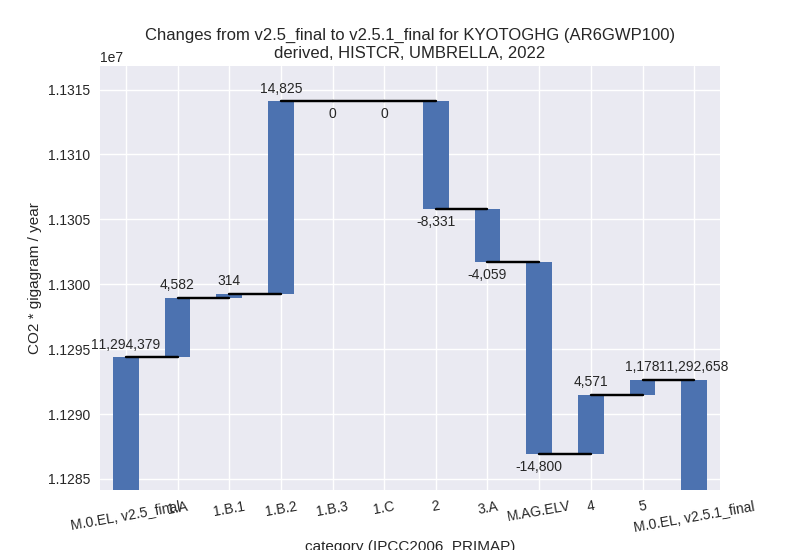
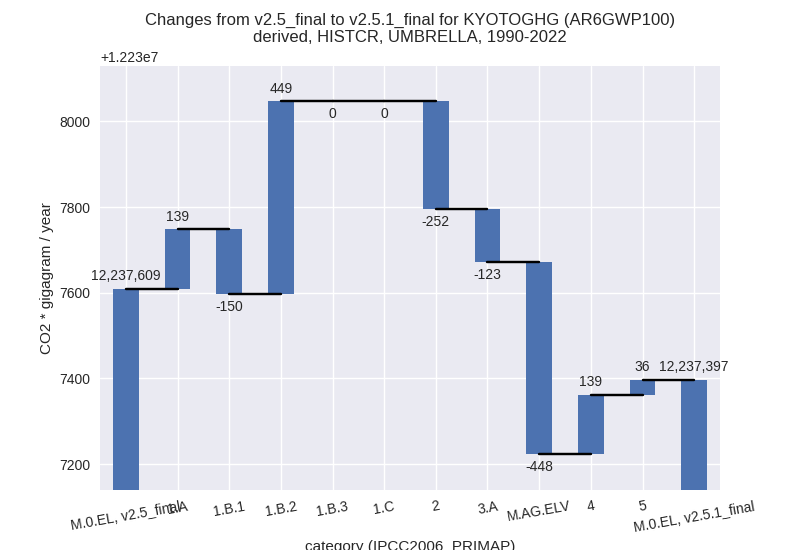
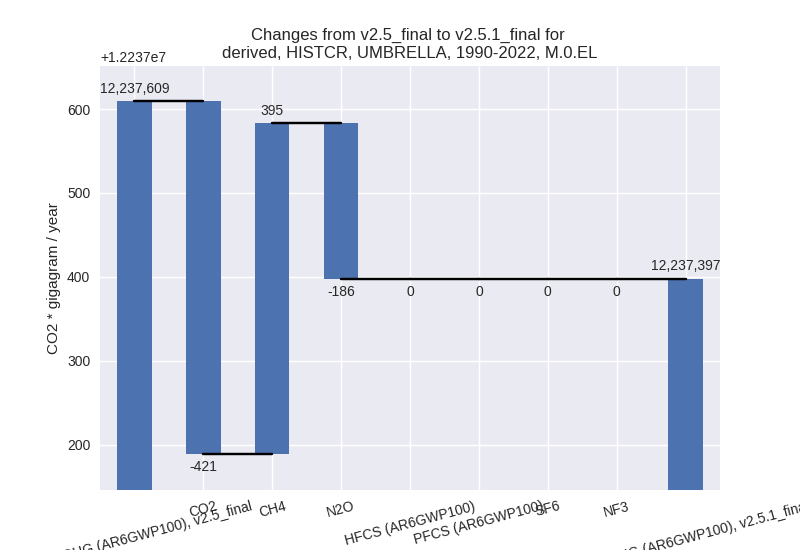
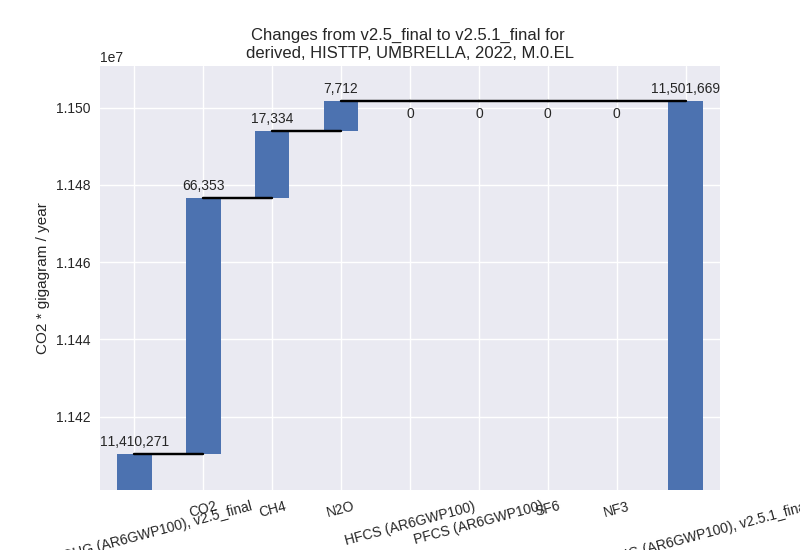
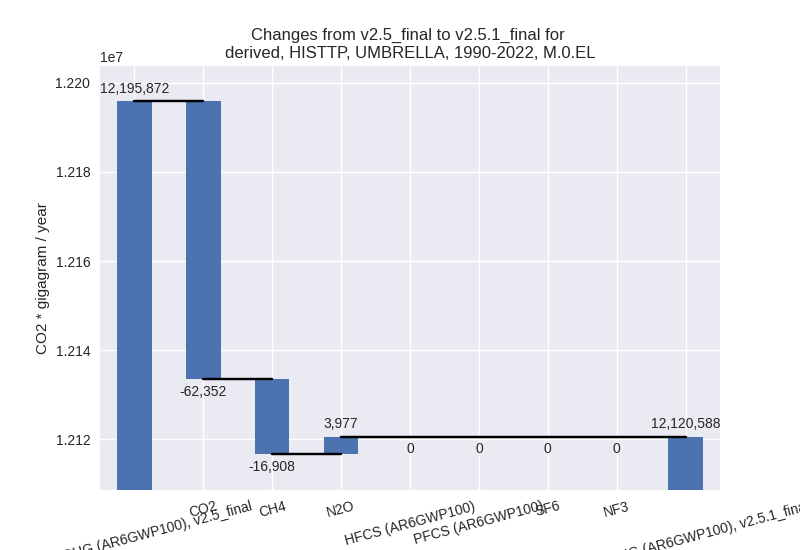
For each scenario and time frame the changes are displayed for all individual sectors and all individual gases. In the sector plot we use aggregate Kyoto GHGs in AR6GWP100. In the gas plot we usenational total emissions without LULUCF. ## country reported scenario
2022

1990-2022
third party scenario
2022
1990-2022
Detailed changes for the scenarios:
country reported scenario (HISTCR):
Most important changes per time frame
For 2022 the following sector-gas combinations have the highest absolute impact on national total KyotoGHG (AR6GWP100) emissions in 2022 (top 5):
- 1: 1.B.2, CH4 with 15066.11 Gg CO2 / year (3.5%)
- 2: M.AG.ELV, N2O with -12488.00 Gg CO2 / year (-2.7%)
- 3: 2, CO2 with -9083.29 Gg CO2 / year (-1.7%)
- 4: 1.A, N2O with 5008.80 Gg CO2 / year (9.3%)
- 5: 4, CH4 with 4888.64 Gg CO2 / year (1.6%)
For 1990-2022 the following sector-gas combinations have the highest absolute impact on national total KyotoGHG (AR6GWP100) emissions in 1990-2022 (top 5):
- 1: 1.B.2, CH4 with 456.55 Gg CO2 / year (0.1%)
- 2: M.AG.ELV, N2O with -378.42 Gg CO2 / year (-0.1%)
- 3: 2, CO2 with -275.25 Gg CO2 / year (-0.0%)
- 4: 1.B.1, CO2 with -154.18 Gg CO2 / year (-2.3%)
- 5: 1.A, N2O with 151.78 Gg CO2 / year (0.2%)
Changes in the main sectors for aggregate KyotoGHG (AR6GWP100) are
- 1: Total sectoral emissions in 2022 are 9034936.10 Gg CO2 / year which is 80.0% of M.0.EL emissions. 2022 Emissions have changed by 0.2% (19719.90 Gg CO2 / year). 1990-2022 Emissions have changed by 0.0% (437.78 Gg CO2 / year).
- 2: Total sectoral emissions in 2022 are 896788.77 Gg CO2 / year which is 7.9% of M.0.EL emissions. 2022 Emissions have changed by -0.9% (-8330.51 Gg CO2 / year). 1990-2022 Emissions have changed by -0.0% (-252.44 Gg CO2 / year).
- M.AG: Total sectoral emissions in 2022 are 979840.63 Gg CO2 / year which is 8.7% of M.0.EL emissions. 2022 Emissions have changed by -1.9% (-18859.02 Gg CO2 / year). 1990-2022 Emissions have changed by -0.1% (-571.49 Gg CO2 / year).
- 4: Total sectoral emissions in 2022 are 352379.14 Gg CO2 / year which is 3.1% of M.0.EL emissions. 2022 Emissions have changed by 1.3% (4570.80 Gg CO2 / year). 1990-2022 Emissions have changed by 0.0% (138.51 Gg CO2 / year).
- 5: Total sectoral emissions in 2022 are 28713.64 Gg
CO2 / year which is 0.3% of M.0.EL emissions. 2022 Emissions have
changed by 4.3% (1177.95 Gg CO2 /
year). 1990-2022 Emissions have changed by 0.1% (35.69 Gg CO2 / year). For 2022 the
changes per gas
are:

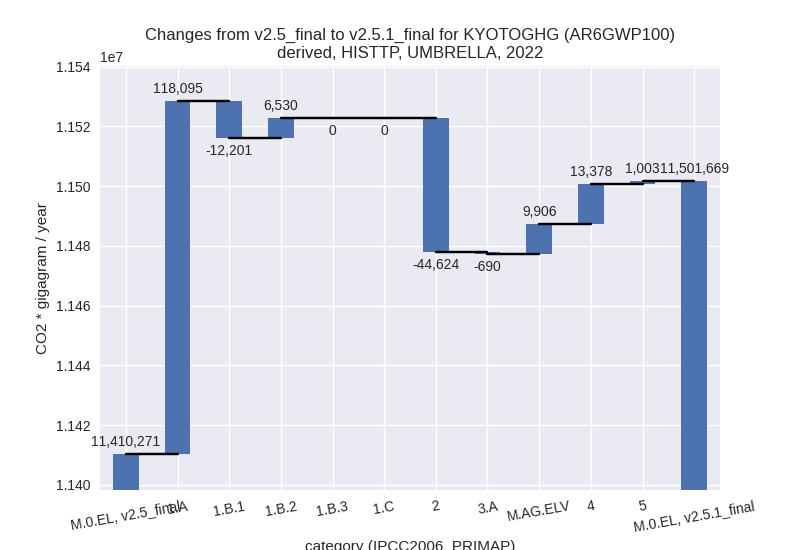
third party scenario (HISTTP):
Most important changes per time frame
For 2022 the following sector-gas combinations have the highest absolute impact on national total KyotoGHG (AR6GWP100) emissions in 2022 (top 5):
- 1: 1.A, CO2 with 109887.60 Gg CO2 / year (1.3%)
- 2: 2, CO2 with -41159.07 Gg CO2 / year (-10.5%)
- 3: 4, CH4 with 13099.69 Gg CO2 / year (4.4%)
- 4: 1.B.1, CO2 with -9889.68 Gg CO2 / year (-10.4%)
- 5: M.AG.ELV, CO2 with 7423.08 Gg CO2 / year (43.4%)
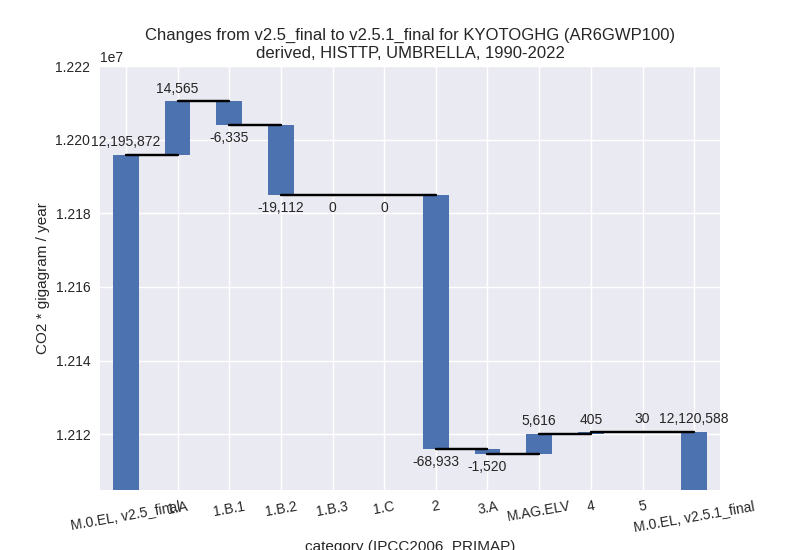
For 1990-2022 the following sector-gas combinations have the highest absolute impact on national total KyotoGHG (AR6GWP100) emissions in 1990-2022 (top 5):
- 1: 2, CO2 with -69466.33 Gg CO2 / year (-17.2%)
- 2: 1.B.2, CH4 with -19110.61 Gg CO2 / year (-3.7%)
- 3: 1.A, CO2 with 14152.44 Gg CO2 / year (0.2%)
- 4: 1.B.1, CO2 with -8446.96 Gg CO2 / year (-9.1%)
- 5: M.AG.ELV, N2O with 4144.98 Gg CO2 / year (1.3%)
Changes in the main sectors for aggregate KyotoGHG (AR6GWP100) are
- 1: Total sectoral emissions in 2022 are 9596247.60 Gg CO2 / year which is 83.4% of M.0.EL emissions. 2022 Emissions have changed by 1.2% (112424.00 Gg CO2 / year). 1990-2022 Emissions have changed by -0.1% (-10882.26 Gg CO2 / year).
- 2: Total sectoral emissions in 2022 are 734299.89
Gg CO2 / year which is 6.4% of M.0.EL emissions. 2022 Emissions have
changed by -5.7% (-44624.27 Gg CO2 /
year). 1990-2022 Emissions have changed by -9.5% (-68932.90 Gg CO2 / year). For 2022
the changes per gas
are:

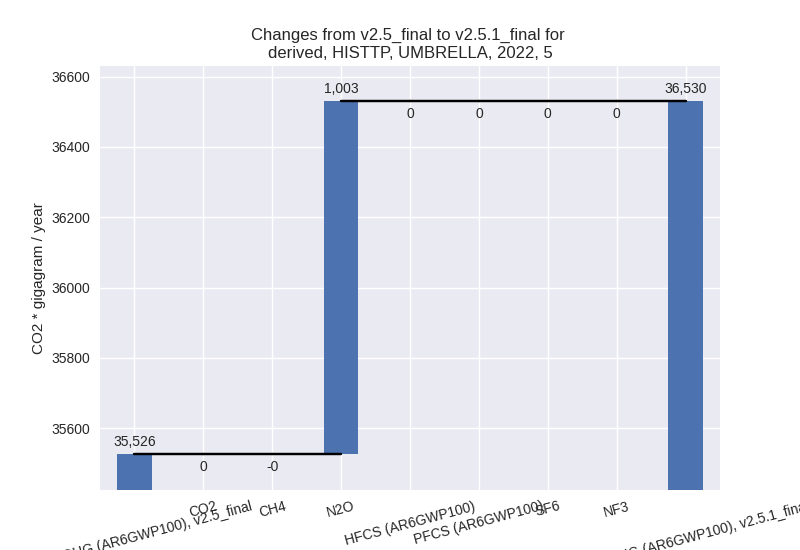
For 1990-2022 the changes per gas are: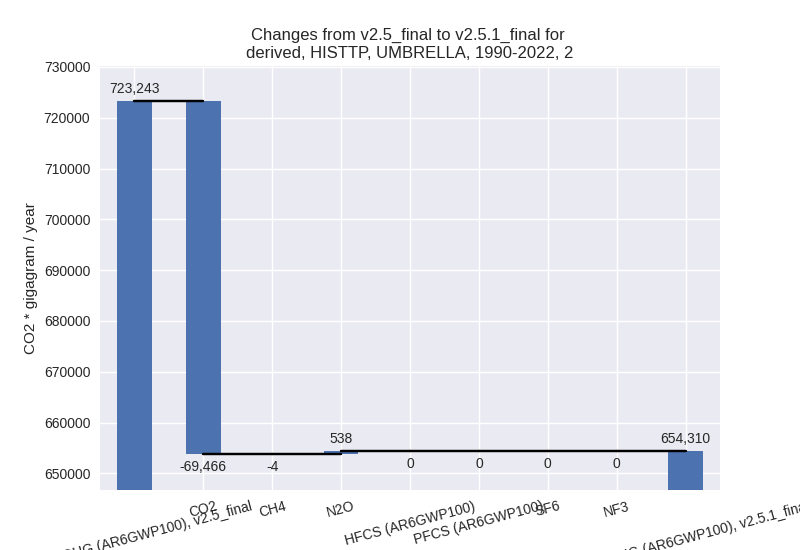
- M.AG: Total sectoral emissions in 2022 are 803456.38 Gg CO2 / year which is 7.0% of M.0.EL emissions. 2022 Emissions have changed by 1.2% (9216.51 Gg CO2 / year). 1990-2022 Emissions have changed by 0.5% (4095.55 Gg CO2 / year).
- 4: Total sectoral emissions in 2022 are 331135.06
Gg CO2 / year which is 2.9% of M.0.EL emissions. 2022 Emissions have
changed by 4.2% (13378.32 Gg CO2 /
year). 1990-2022 Emissions have changed by 0.1% (405.33 Gg CO2 / year). For 2022 the
changes per gas
are:

- 5: Total sectoral emissions in 2022 are 36529.76 Gg
CO2 / year which is 0.3% of M.0.EL emissions. 2022 Emissions have
changed by 2.8% (1003.46 Gg CO2 /
year). 1990-2022 Emissions have changed by 0.1% (30.41 Gg CO2 / year). For 2022 the
changes per gas
are: