Changes in PRIMAP-hist v2.5.1_final compared to v2.5_final for Uruguay
2024-02-29
Johannes Gütschow
Change analysis for Uruguay for PRIMAP-hist v2.5.1_final compared to v2.5_final
Overview over emissions by sector and gas
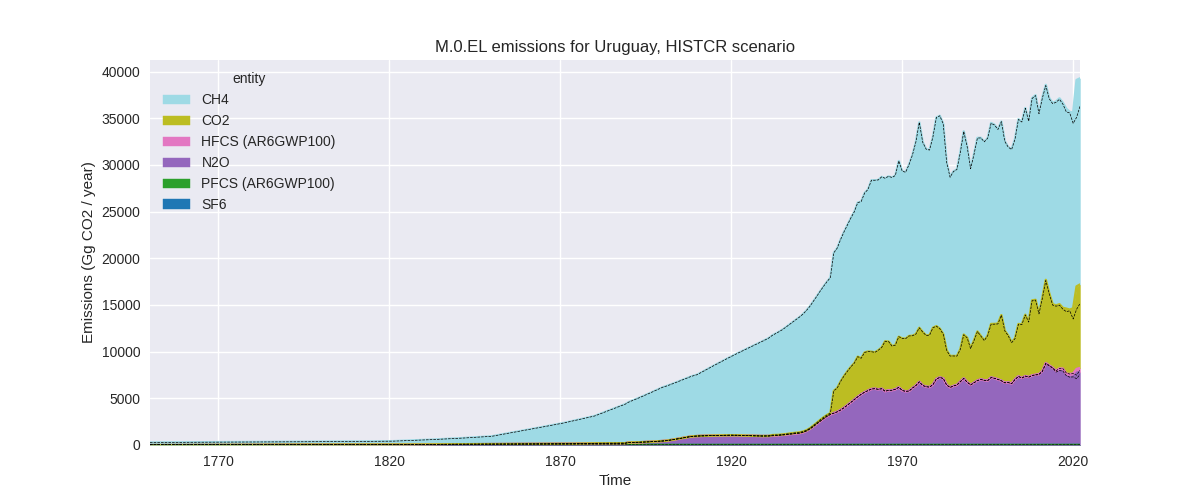
The following figures show the aggregate national total emissions excluding LULUCF AR6GWP100 for the country reported priority scenario. The dotted linesshow the v2.5_final data.


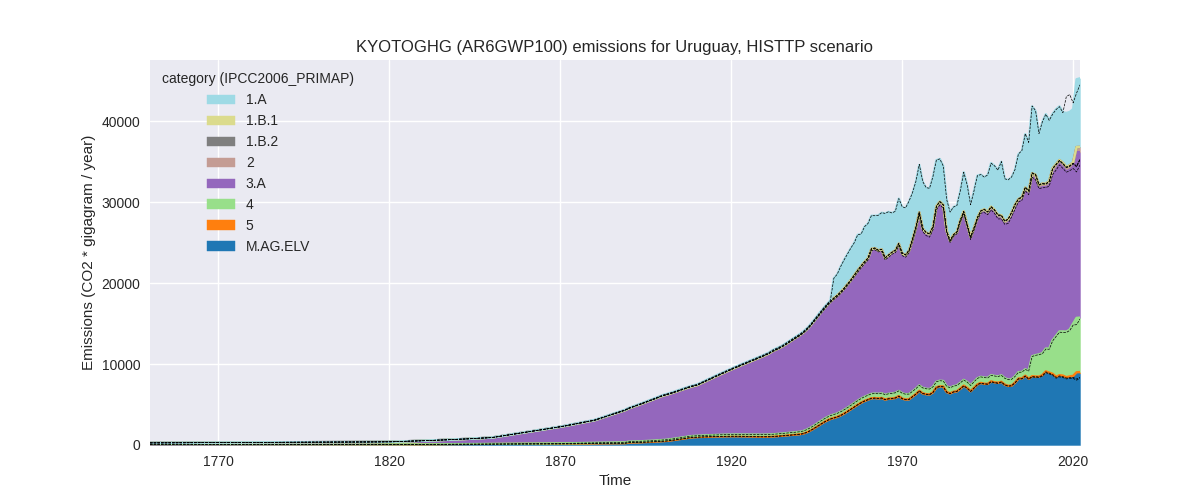
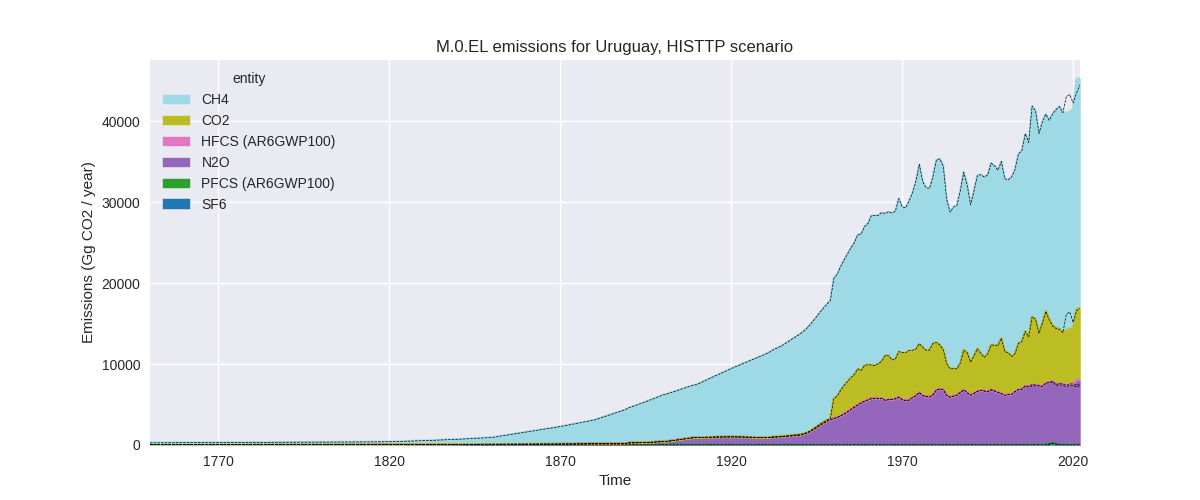
The following figures show the aggregate national total emissions excluding LULUCF AR6GWP100 for the third party priority scenario. The dotted linesshow the v2.5_final data.
Overview over changes
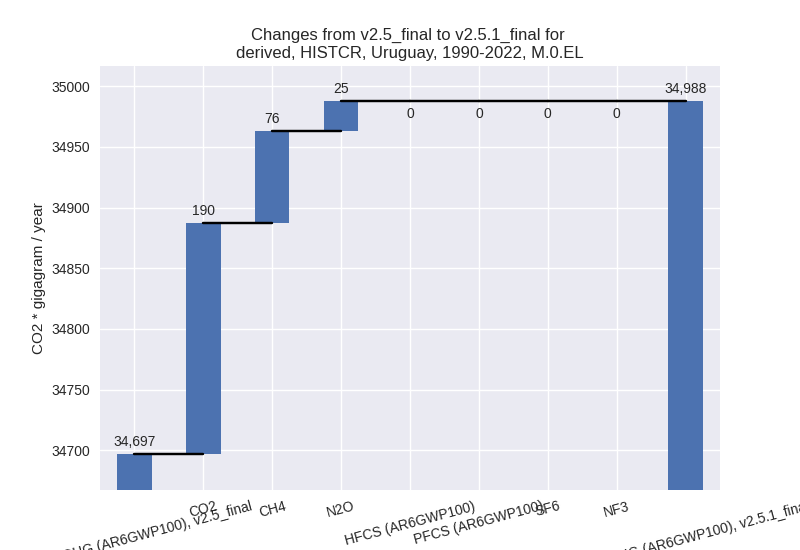
In the country reported priority scenario we have the following changes for aggregate Kyoto GHG and national total emissions excluding LULUCF (M.0.EL):
- Emissions in 2022 have changed by 8.2%% (2993.25 Gg CO2 / year)
- Emissions in 1990-2022 have changed by 0.8%% (290.77 Gg CO2 / year)
In the third party priority scenario we have the following changes for aggregate Kyoto GHG and national total emissions excluding LULUCF (M.0.EL):
- Emissions in 2022 have changed by 1.8%% (800.22 Gg CO2 / year)
- Emissions in 1990-2022 have changed by -0.2%% (-87.68 Gg CO2 / year)
Most important changes per scenario and time frame
In the country reported priority scenario the following sector-gas combinations have the highest absolute impact on national total KyotoGHG (AR6GWP100) emissions in 2022 (top 5):
- 1: 1.A, CO2 with 1609.29 Gg CO2 / year (25.0%)
- 2: 3.A, CH4 with 877.68 Gg CO2 / year (4.6%)
- 3: M.AG.ELV, N2O with 241.61 Gg CO2 / year (3.4%)
- 4: M.AG.ELV, CO2 with 211.94 Gg CO2 / year (139.7%)
- 5: 4, CH4 with 112.08 Gg CO2 / year (7.3%)
In the country reported priority scenario the following sector-gas combinations have the highest absolute impact on national total KyotoGHG (AR6GWP100) emissions in 1990-2022 (top 5):
- 1: 1.A, CO2 with 132.32 Gg CO2 / year (2.3%)
- 2: 3.A, CH4 with 74.07 Gg CO2 / year (0.4%)
- 3: M.AG.ELV, CO2 with 58.51 Gg CO2 / year (67.3%)
- 4: M.AG.ELV, N2O with 24.64 Gg CO2 / year (0.4%)
- 5: 4, CH4 with 3.40 Gg CO2 / year (0.3%)
In the third party priority scenario the following sector-gas combinations have the highest absolute impact on national total KyotoGHG (AR6GWP100) emissions in 2022 (top 5):
- 1: 3.A, CH4 with 1406.87 Gg CO2 / year (7.4%)
- 2: 1.A, CO2 with -675.15 Gg CO2 / year (-7.7%)
- 3: M.AG.ELV, N2O with 516.94 Gg CO2 / year (7.5%)
- 4: 4, CH4 with -470.31 Gg CO2 / year (-6.6%)
- 5: M.AG.ELV, CO2 with 211.94 Gg CO2 / year (139.7%)
In the third party priority scenario the following sector-gas combinations have the highest absolute impact on national total KyotoGHG (AR6GWP100) emissions in 1990-2022 (top 5):
- 1: 1.A, CO2 with -196.19 Gg CO2 / year (-3.3%)
- 2: 3.A, CH4 with 91.10 Gg CO2 / year (0.5%)
- 3: M.AG.ELV, CO2 with 58.51 Gg CO2 / year (67.3%)
- 4: 2, CO2 with -26.11 Gg CO2 / year (-7.1%)
- 5: M.AG.ELV, N2O with 25.85 Gg CO2 / year (0.4%)
Notes on data changes
Here we list notes explaining important emissions changes for the country. ’' means that the following text only applies to the TP time series, while means that it only applies to the CR scenario. Otherwise the note applies to both scenarios.
- 1.A, CO2: CDIAC 2023 data don’t show the 2020 emissions drop present in EI 2023 data leading to higher emissions for the last years in PRIMAMP-hist.
- 3.A, CH4: FAO 2023 data show a steep emissions increase in 2021 leading to higher 2022 emissions in PRIMAP-hist.
Changes by sector and gas
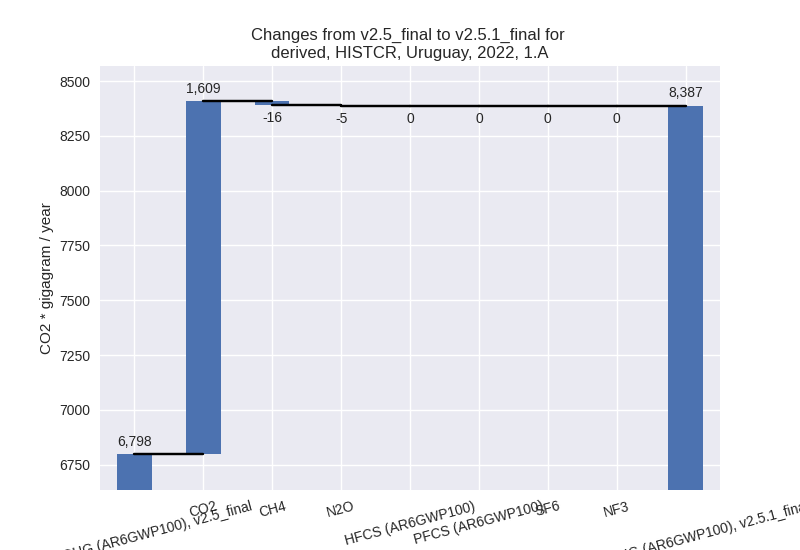
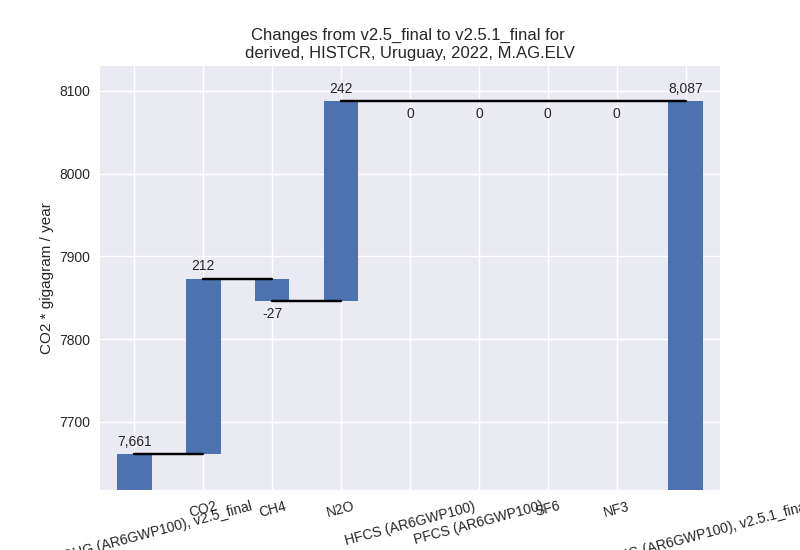
For each scenario and time frame the changes are displayed for all individual sectors and all individual gases. In the sector plot we use aggregate Kyoto GHGs in AR6GWP100. In the gas plot we usenational total emissions without LULUCF. ## country reported scenario
2022

1990-2022

third party scenario
2022


1990-2022

Detailed changes for the scenarios:
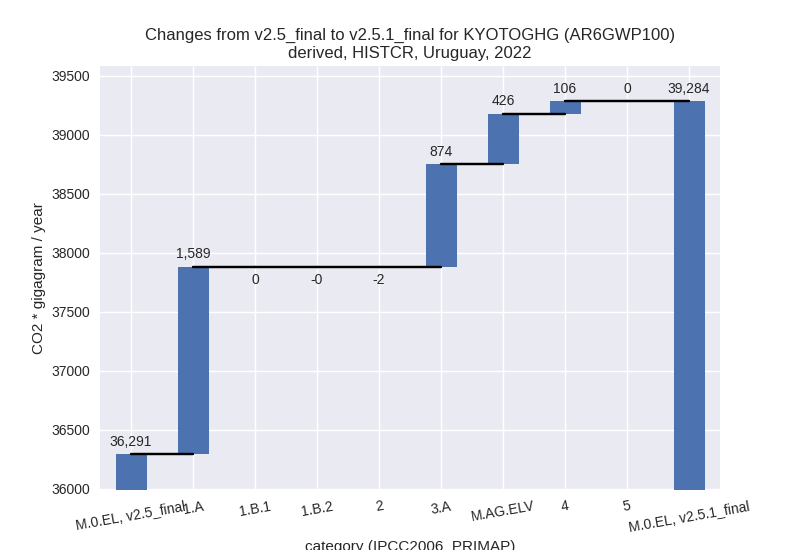
country reported scenario (HISTCR):
Most important changes per time frame
For 2022 the following sector-gas combinations have the highest absolute impact on national total KyotoGHG (AR6GWP100) emissions in 2022 (top 5):
- 1: 1.A, CO2 with 1609.29 Gg CO2 / year (25.0%)
- 2: 3.A, CH4 with 877.68 Gg CO2 / year (4.6%)
- 3: M.AG.ELV, N2O with 241.61 Gg CO2 / year (3.4%)
- 4: M.AG.ELV, CO2 with 211.94 Gg CO2 / year (139.7%)
- 5: 4, CH4 with 112.08 Gg CO2 / year (7.3%)
For 1990-2022 the following sector-gas combinations have the highest absolute impact on national total KyotoGHG (AR6GWP100) emissions in 1990-2022 (top 5):
- 1: 1.A, CO2 with 132.32 Gg CO2 / year (2.3%)
- 2: 3.A, CH4 with 74.07 Gg CO2 / year (0.4%)
- 3: M.AG.ELV, CO2 with 58.51 Gg CO2 / year (67.3%)
- 4: M.AG.ELV, N2O with 24.64 Gg CO2 / year (0.4%)
- 5: 4, CH4 with 3.40 Gg CO2 / year (0.3%)
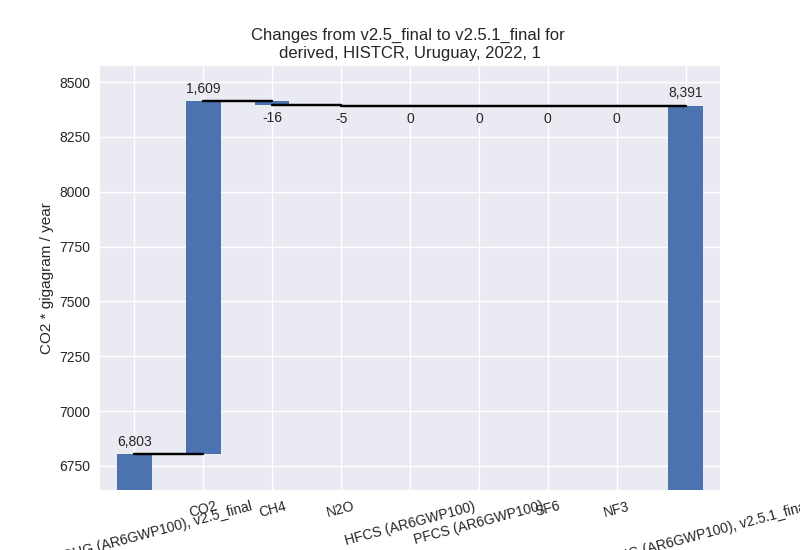
Changes in the main sectors for aggregate KyotoGHG (AR6GWP100) are
- 1: Total sectoral emissions in 2022 are 8391.22 Gg
CO2 / year which is 21.4% of M.0.EL emissions. 2022 Emissions have
changed by 23.3% (1588.04 Gg CO2 /
year). 1990-2022 Emissions have changed by 2.2% (131.93 Gg CO2 / year). For 2022 the
changes per gas
are:
For 1990-2022 the changes per gas are: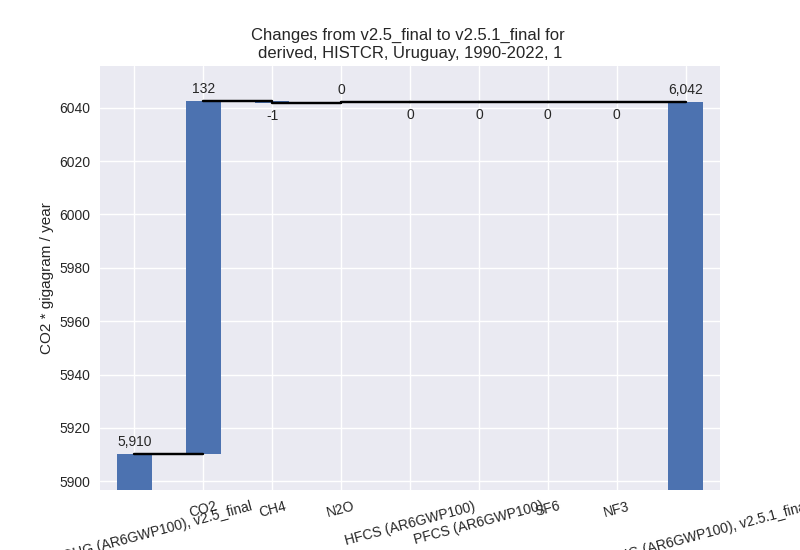
The changes come from the following subsectors:- 1.A: Total sectoral emissions in 2022 are 8386.71
Gg CO2 / year which is 99.9% of category 1 emissions. 2022 Emissions
have changed by 23.4% (1588.52 Gg
CO2 / year). 1990-2022 Emissions have changed by 2.2% (131.96 Gg CO2 / year). For 2022 the
changes per gas
are:
For 1990-2022 the changes per gas are: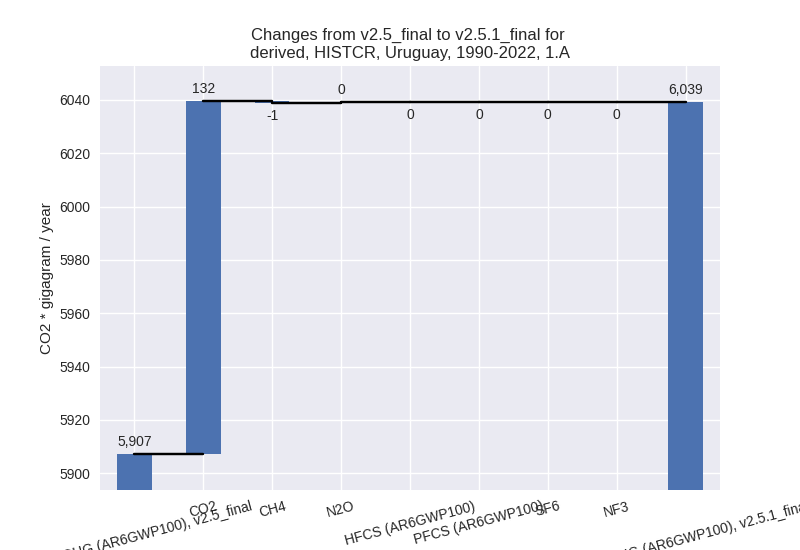
There is no subsector information available in PRIMAP-hist. - 1.B.1: Total sectoral emissions in 2022 are 0.00 Gg CO2 / year which is 0.0% of category 1 emissions. 2022 Emissions have changed by 0.0% (0.00 Gg CO2 / year). 1990-2022 Emissions have changed by 0.0% (0.00 Gg CO2 / year).
- 1.B.2: Total sectoral emissions in 2022 are 4.51 Gg
CO2 / year which is 0.1% of category 1 emissions. 2022 Emissions have
changed by -9.7% (-0.48 Gg CO2 /
year). 1990-2022 Emissions have changed by -1.0% (-0.03 Gg CO2 / year). For 2022 the
changes per gas
are:

There is no subsector information available in PRIMAP-hist.
- 1.A: Total sectoral emissions in 2022 are 8386.71
Gg CO2 / year which is 99.9% of category 1 emissions. 2022 Emissions
have changed by 23.4% (1588.52 Gg
CO2 / year). 1990-2022 Emissions have changed by 2.2% (131.96 Gg CO2 / year). For 2022 the
changes per gas
are:
- 2: Total sectoral emissions in 2022 are 997.82 Gg CO2 / year which is 2.5% of M.0.EL emissions. 2022 Emissions have changed by -0.2% (-1.75 Gg CO2 / year). 1990-2022 Emissions have changed by -0.1% (-0.53 Gg CO2 / year).
- M.AG: Total sectoral emissions in 2022 are 28028.81
Gg CO2 / year which is 71.3% of M.0.EL emissions. 2022 Emissions have
changed by 4.9% (1300.88 Gg CO2 /
year). 1990-2022 Emissions have changed by 0.6% (156.16 Gg CO2 / year). For 2022 the
changes per gas
are:

The changes come from the following subsectors:- 3.A: Total sectoral emissions in 2022 are 19941.37
Gg CO2 / year which is 71.1% of category M.AG emissions. 2022 Emissions
have changed by 4.6% (874.41 Gg CO2
/ year). 1990-2022 Emissions have changed by 0.4% (73.95 Gg CO2 / year). For 2022 the
changes per gas
are:

There is no subsector information available in PRIMAP-hist. - M.AG.ELV: Total sectoral emissions in 2022 are
8087.43 Gg CO2 / year which is 28.9% of category M.AG emissions. 2022
Emissions have changed by 5.6%
(426.47 Gg CO2 / year). 1990-2022 Emissions have changed by 1.1% (82.21 Gg CO2 / year). For 2022 the
changes per gas
are:
There is no subsector information available in PRIMAP-hist.
- 3.A: Total sectoral emissions in 2022 are 19941.37
Gg CO2 / year which is 71.1% of category M.AG emissions. 2022 Emissions
have changed by 4.6% (874.41 Gg CO2
/ year). 1990-2022 Emissions have changed by 0.4% (73.95 Gg CO2 / year). For 2022 the
changes per gas
are:
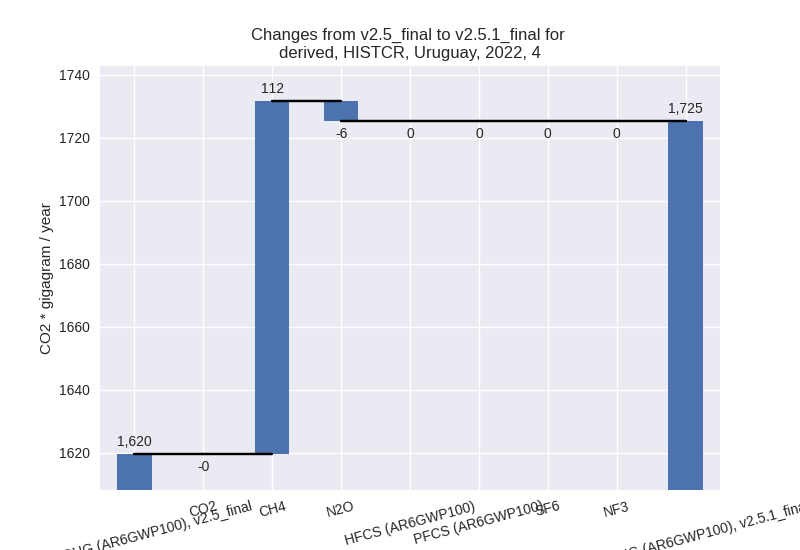
- 4: Total sectoral emissions in 2022 are 1725.30 Gg
CO2 / year which is 4.4% of M.0.EL emissions. 2022 Emissions have
changed by 6.5% (105.78 Gg CO2 /
year). 1990-2022 Emissions have changed by 0.3% (3.21 Gg CO2 / year). For 2022 the
changes per gas
are:
- 5: Total sectoral emissions in 2022 are 141.13 Gg CO2 / year which is 0.4% of M.0.EL emissions. 2022 Emissions have changed by 0.2% (0.31 Gg CO2 / year). 1990-2022 Emissions have changed by 0.0% (0.01 Gg CO2 / year).
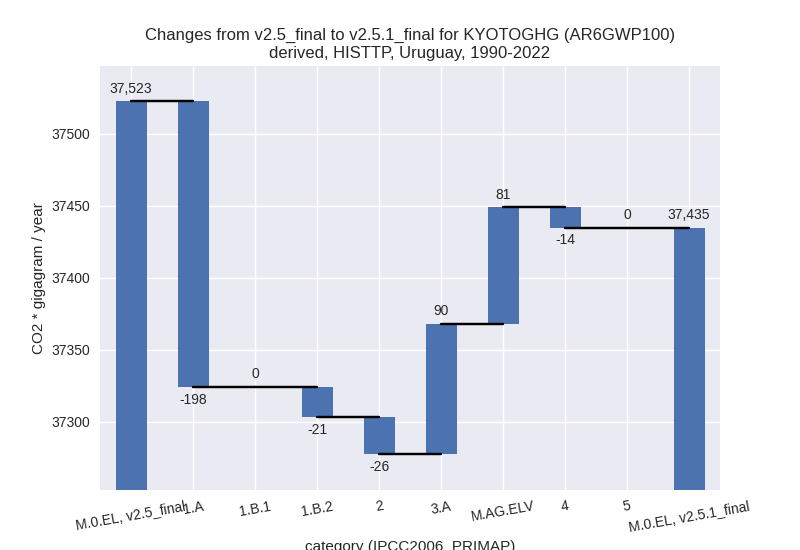
third party scenario (HISTTP):
Most important changes per time frame
For 2022 the following sector-gas combinations have the highest absolute impact on national total KyotoGHG (AR6GWP100) emissions in 2022 (top 5):
- 1: 3.A, CH4 with 1406.87 Gg CO2 / year (7.4%)
- 2: 1.A, CO2 with -675.15 Gg CO2 / year (-7.7%)
- 3: M.AG.ELV, N2O with 516.94 Gg CO2 / year (7.5%)
- 4: 4, CH4 with -470.31 Gg CO2 / year (-6.6%)
- 5: M.AG.ELV, CO2 with 211.94 Gg CO2 / year (139.7%)
For 1990-2022 the following sector-gas combinations have the highest absolute impact on national total KyotoGHG (AR6GWP100) emissions in 1990-2022 (top 5):
- 1: 1.A, CO2 with -196.19 Gg CO2 / year (-3.3%)
- 2: 3.A, CH4 with 91.10 Gg CO2 / year (0.5%)
- 3: M.AG.ELV, CO2 with 58.51 Gg CO2 / year (67.3%)
- 4: 2, CO2 with -26.11 Gg CO2 / year (-7.1%)
- 5: M.AG.ELV, N2O with 25.85 Gg CO2 / year (0.4%)
Changes in the main sectors for aggregate KyotoGHG (AR6GWP100) are
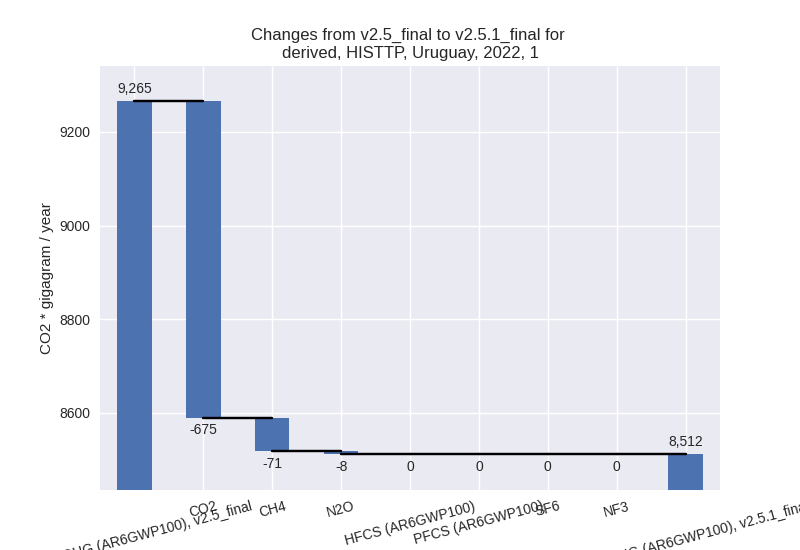
- 1: Total sectoral emissions in 2022 are 8511.84 Gg
CO2 / year which is 18.8% of M.0.EL emissions. 2022 Emissions have
changed by -8.1% (-753.46 Gg CO2 /
year). 1990-2022 Emissions have changed by -3.4% (-219.05 Gg CO2 / year). For 2022
the changes per gas
are:
For 1990-2022 the changes per gas are:
The changes come from the following subsectors:- 1.A: Total sectoral emissions in 2022 are 8474.06
Gg CO2 / year which is 99.6% of category 1 emissions. 2022 Emissions
have changed by -7.8% (-718.54 Gg
CO2 / year). 1990-2022 Emissions have changed by -3.2% (-198.41 Gg CO2 / year). For 2022
the changes per gas
are:
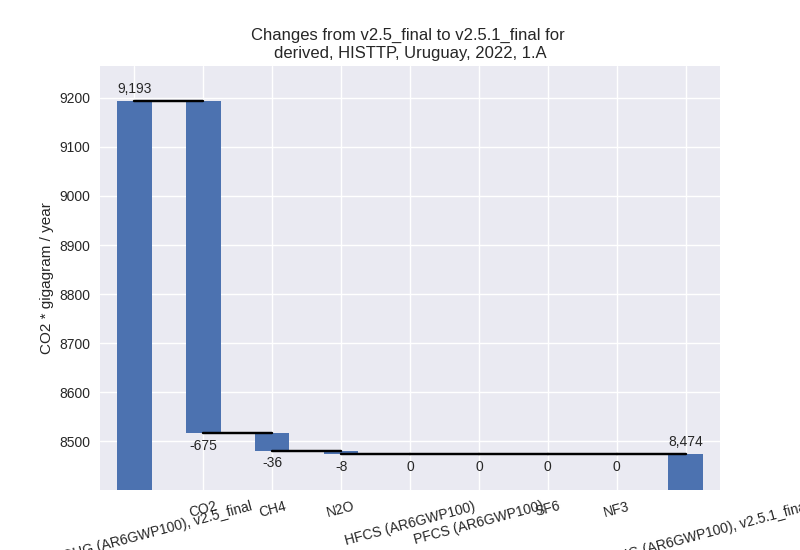
For 1990-2022 the changes per gas are:
There is no subsector information available in PRIMAP-hist. - 1.B.1: Total sectoral emissions in 2022 are 0.00 Gg CO2 / year which is 0.0% of category 1 emissions. 2022 Emissions have changed by 0.0% (0.00 Gg CO2 / year). 1990-2022 Emissions have changed by 0.0% (0.00 Gg CO2 / year).
- 1.B.2: Total sectoral emissions in 2022 are 37.78
Gg CO2 / year which is 0.4% of category 1 emissions. 2022 Emissions have
changed by -48.0% (-34.92 Gg CO2 /
year). 1990-2022 Emissions have changed by -44.6% (-20.64 Gg CO2 / year). For 2022
the changes per gas
are:

For 1990-2022 the changes per gas are: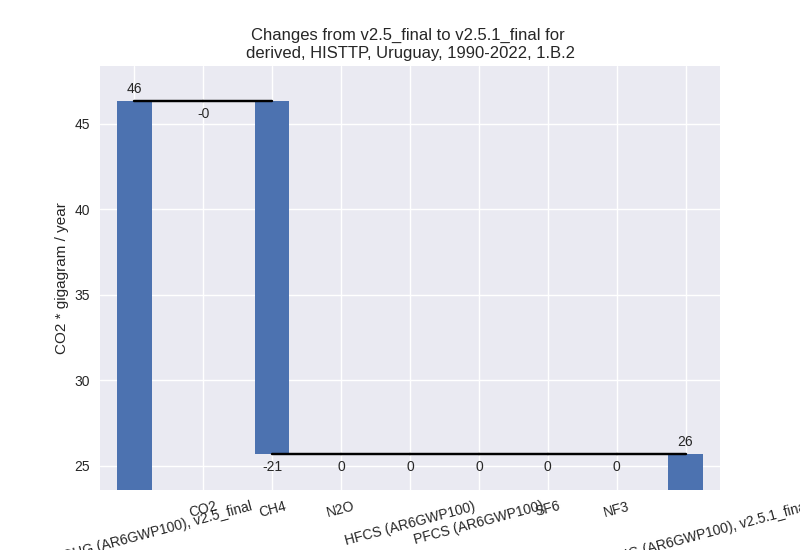
There is no subsector information available in PRIMAP-hist.
- 1.A: Total sectoral emissions in 2022 are 8474.06
Gg CO2 / year which is 99.6% of category 1 emissions. 2022 Emissions
have changed by -7.8% (-718.54 Gg
CO2 / year). 1990-2022 Emissions have changed by -3.2% (-198.41 Gg CO2 / year). For 2022
the changes per gas
are:
- 2: Total sectoral emissions in 2022 are 615.11 Gg
CO2 / year which is 1.4% of M.0.EL emissions. 2022 Emissions have
changed by -2.8% (-17.56 Gg CO2 /
year). 1990-2022 Emissions have changed by -5.8% (-26.11 Gg CO2 / year). For 2022 the
changes per gas
are:

For 1990-2022 the changes per gas are: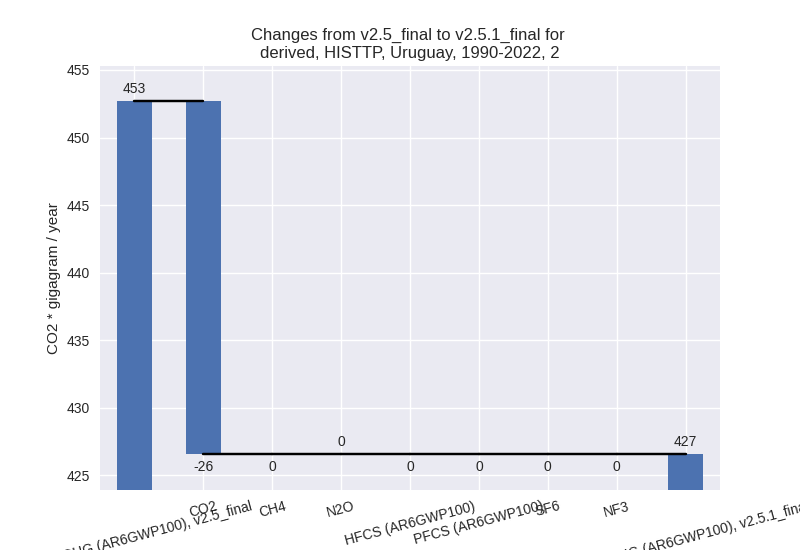
- M.AG: Total sectoral emissions in 2022 are 29323.38
Gg CO2 / year which is 64.7% of M.0.EL emissions. 2022 Emissions have
changed by 7.5% (2040.28 Gg CO2 /
year). 1990-2022 Emissions have changed by 0.6% (171.69 Gg CO2 / year). For 2022 the
changes per gas
are:

The changes come from the following subsectors:- 3.A: Total sectoral emissions in 2022 are 20452.19
Gg CO2 / year which is 69.7% of category M.AG emissions. 2022 Emissions
have changed by 7.4% (1402.19 Gg CO2
/ year). 1990-2022 Emissions have changed by 0.4% (90.49 Gg CO2 / year). For 2022 the
changes per gas
are:

There is no subsector information available in PRIMAP-hist. - M.AG.ELV: Total sectoral emissions in 2022 are
8871.20 Gg CO2 / year which is 30.3% of category M.AG emissions. 2022
Emissions have changed by 7.8%
(638.09 Gg CO2 / year). 1990-2022 Emissions have changed by 1.0% (81.20 Gg CO2 / year). For 2022 the
changes per gas
are:

There is no subsector information available in PRIMAP-hist.
- 3.A: Total sectoral emissions in 2022 are 20452.19
Gg CO2 / year which is 69.7% of category M.AG emissions. 2022 Emissions
have changed by 7.4% (1402.19 Gg CO2
/ year). 1990-2022 Emissions have changed by 0.4% (90.49 Gg CO2 / year). For 2022 the
changes per gas
are:
- 4: Total sectoral emissions in 2022 are 6726.10 Gg
CO2 / year which is 14.8% of M.0.EL emissions. 2022 Emissions have
changed by -6.5% (-469.34 Gg CO2 /
year). 1990-2022 Emissions have changed by -0.6% (-14.22 Gg CO2 / year). For 2022 the
changes per gas
are:

- 5: Total sectoral emissions in 2022 are 141.13 Gg CO2 / year which is 0.3% of M.0.EL emissions. 2022 Emissions have changed by 0.2% (0.31 Gg CO2 / year). 1990-2022 Emissions have changed by 0.0% (0.01 Gg CO2 / year).