Changes in PRIMAP-hist v2.5.1_final compared to v2.5_final for Holy See (Vatican City State)
2024-02-29
Johannes Gütschow
Change analysis for Holy See (Vatican City State) for PRIMAP-hist v2.5.1_final compared to v2.5_final
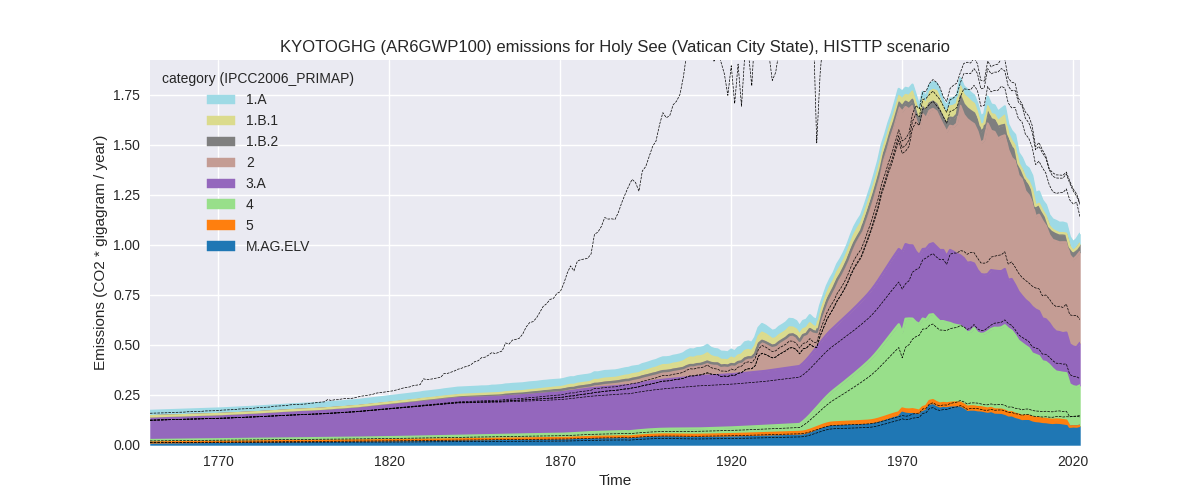
Overview over emissions by sector and gas
The following figures show the aggregate national total emissions excluding LULUCF AR6GWP100 for the country reported priority scenario. The dotted linesshow the v2.5_final data.

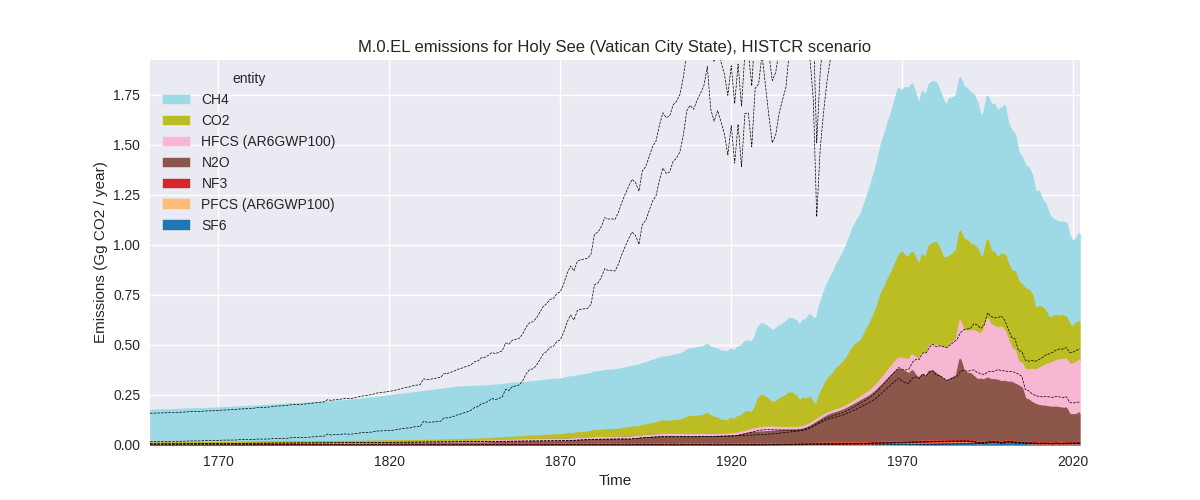
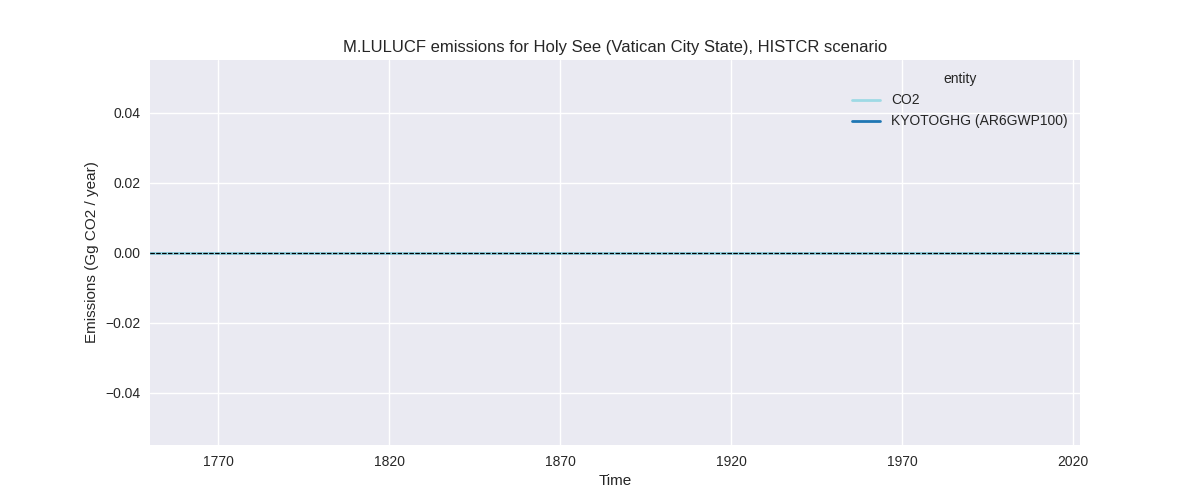
The following figures show the aggregate national total emissions excluding LULUCF AR6GWP100 for the third party priority scenario. The dotted linesshow the v2.5_final data.


Overview over changes
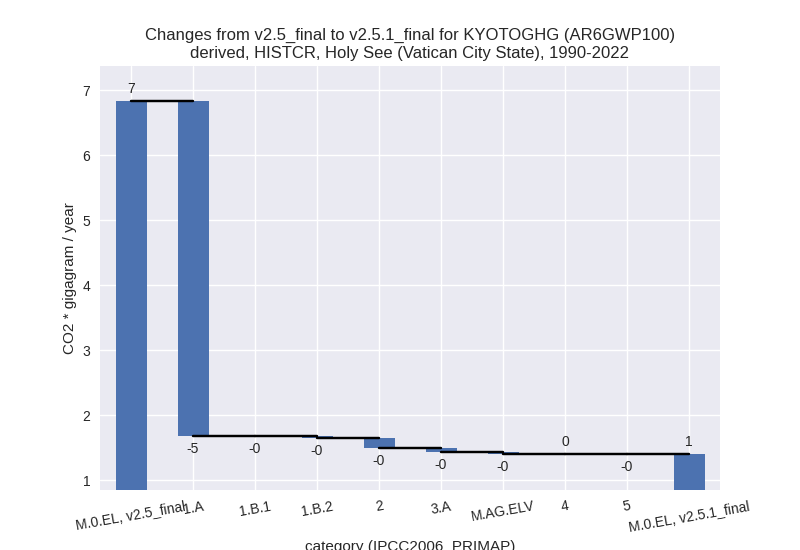
In the country reported priority scenario we have the following changes for aggregate Kyoto GHG and national total emissions excluding LULUCF (M.0.EL):
- Emissions in 2022 have changed by -77.7%% (-3.68 Gg CO2 / year)
- Emissions in 1990-2022 have changed by -79.5%% (-5.43 Gg CO2 / year)
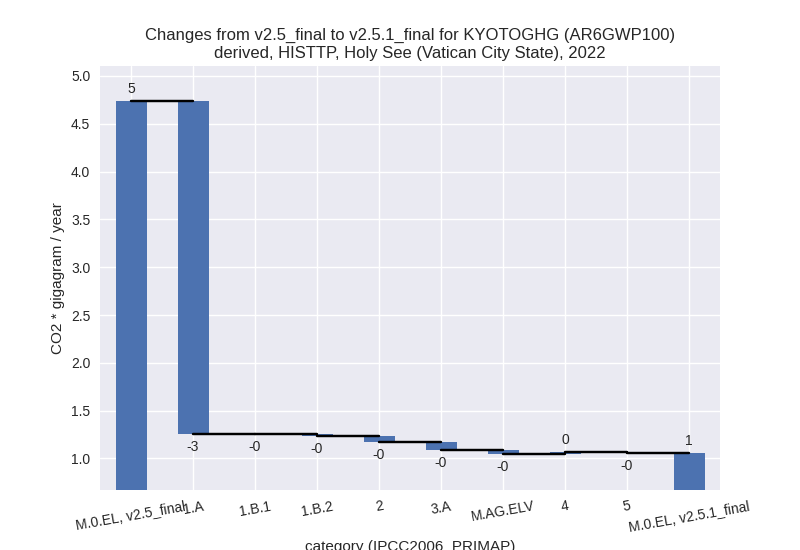
In the third party priority scenario we have the following changes for aggregate Kyoto GHG and national total emissions excluding LULUCF (M.0.EL):
- Emissions in 2022 have changed by -77.7%% (-3.68 Gg CO2 / year)
- Emissions in 1990-2022 have changed by -79.5%% (-5.43 Gg CO2 / year)
Most important changes per scenario and time frame
In the country reported priority scenario the following sector-gas combinations have the highest absolute impact on national total KyotoGHG (AR6GWP100) emissions in 2022 (top 5):
- 1: 1.A, CO2 with -3.46 Gg CO2 / year (-100.0%)
- 2: 3.A, CH4 with -0.08 Gg CO2 / year (-28.1%)
- 3: 2, CO2 with -0.06 Gg CO2 / year (-25.3%)
- 4: M.AG.ELV, N2O with -0.04 Gg CO2 / year (-33.3%)
- 5: 1.B.2, CH4 with -0.02 Gg CO2 / year (-38.5%)
In the country reported priority scenario the following sector-gas combinations have the highest absolute impact on national total KyotoGHG (AR6GWP100) emissions in 1990-2022 (top 5):
- 1: 1.A, CO2 with -5.13 Gg CO2 / year (-100.0%)
- 2: 2, CO2 with -0.13 Gg CO2 / year (-31.9%)
- 3: 3.A, CH4 with -0.06 Gg CO2 / year (-21.5%)
- 4: 1.B.2, CH4 with -0.03 Gg CO2 / year (-41.0%)
- 5: M.AG.ELV, N2O with -0.03 Gg CO2 / year (-23.8%)
In the third party priority scenario the following sector-gas combinations have the highest absolute impact on national total KyotoGHG (AR6GWP100) emissions in 2022 (top 5):
- 1: 1.A, CO2 with -3.46 Gg CO2 / year (-100.0%)
- 2: 3.A, CH4 with -0.08 Gg CO2 / year (-28.1%)
- 3: 2, CO2 with -0.06 Gg CO2 / year (-25.3%)
- 4: M.AG.ELV, N2O with -0.04 Gg CO2 / year (-33.3%)
- 5: 1.B.2, CH4 with -0.02 Gg CO2 / year (-38.5%)
In the third party priority scenario the following sector-gas combinations have the highest absolute impact on national total KyotoGHG (AR6GWP100) emissions in 1990-2022 (top 5):
- 1: 1.A, CO2 with -5.13 Gg CO2 / year (-100.0%)
- 2: 2, CO2 with -0.13 Gg CO2 / year (-31.9%)
- 3: 3.A, CH4 with -0.06 Gg CO2 / year (-21.5%)
- 4: 1.B.2, CH4 with -0.03 Gg CO2 / year (-41.0%)
- 5: M.AG.ELV, N2O with -0.03 Gg CO2 / year (-23.8%)
Notes on data changes
Here we list notes explaining important emissions changes for the country. ’' means that the following text only applies to the TP time series, while means that it only applies to the CR scenario. Otherwise the note applies to both scenarios.
General note: We have no country reported data for Vatican City State, thus the CR and TP time-series are identical except for LULUCF.
- 1.A, CO2: Emissions are sourced from EDGAR 8.0 where data for the Vatican City State is combined with data for Italy and downscaled using UN World Population Prospects data. We use WPP2022 in PRIMAP-hist 2.5.1 which shows a decline in population which was not present in older versions. Thus the downscaled emissions are lower and in consequence emissions in PRIMAP-hist are lower than in older versions.
- 2, CO2: See 1.A, CO2
- 3.A, CH4: See 1.A, CO2
- M.AG.ELV, N2O: See 1.A, CO2
- 1.A, CO2: PRIMAP-hist v2.5.1 has no energy CO2 data for the Vatican as the only data source was EDGAR.
Changes by sector and gas
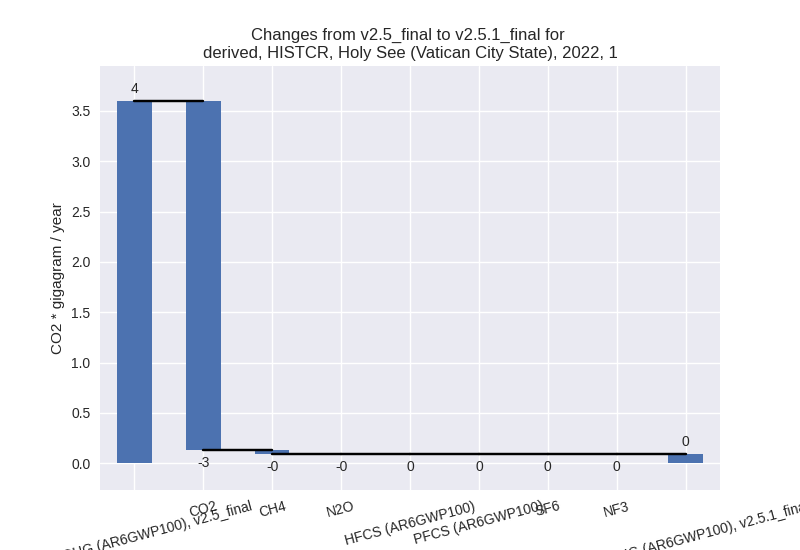
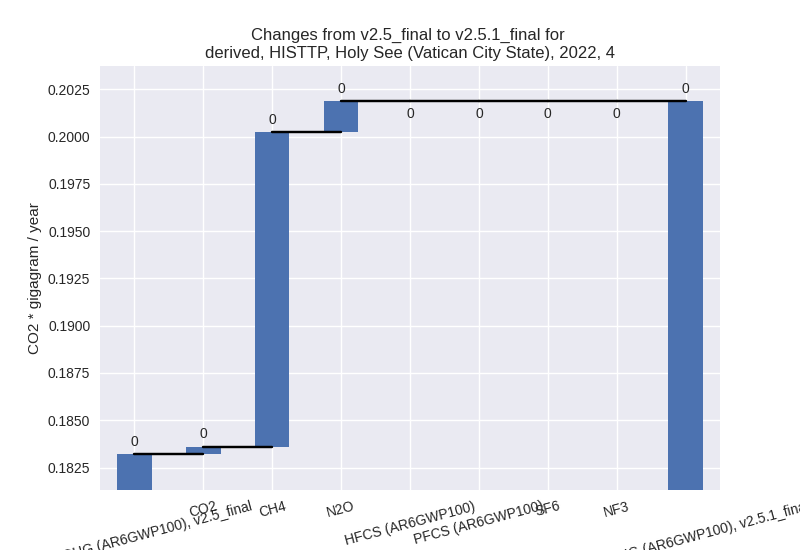
For each scenario and time frame the changes are displayed for all individual sectors and all individual gases. In the sector plot we use aggregate Kyoto GHGs in AR6GWP100. In the gas plot we usenational total emissions without LULUCF. ## country reported scenario
2022


1990-2022

third party scenario
2022

1990-2022

Detailed changes for the scenarios:
country reported scenario (HISTCR):
Most important changes per time frame
For 2022 the following sector-gas combinations have the highest absolute impact on national total KyotoGHG (AR6GWP100) emissions in 2022 (top 5):
- 1: 1.A, CO2 with -3.46 Gg CO2 / year (-100.0%)
- 2: 3.A, CH4 with -0.08 Gg CO2 / year (-28.1%)
- 3: 2, CO2 with -0.06 Gg CO2 / year (-25.3%)
- 4: M.AG.ELV, N2O with -0.04 Gg CO2 / year (-33.3%)
- 5: 1.B.2, CH4 with -0.02 Gg CO2 / year (-38.5%)
For 1990-2022 the following sector-gas combinations have the highest absolute impact on national total KyotoGHG (AR6GWP100) emissions in 1990-2022 (top 5):
- 1: 1.A, CO2 with -5.13 Gg CO2 / year (-100.0%)
- 2: 2, CO2 with -0.13 Gg CO2 / year (-31.9%)
- 3: 3.A, CH4 with -0.06 Gg CO2 / year (-21.5%)
- 4: 1.B.2, CH4 with -0.03 Gg CO2 / year (-41.0%)
- 5: M.AG.ELV, N2O with -0.03 Gg CO2 / year (-23.8%)
Changes in the main sectors for aggregate KyotoGHG (AR6GWP100) are
- 1: Total sectoral emissions in 2022 are 0.09 Gg CO2
/ year which is 8.6% of M.0.EL emissions. 2022 Emissions have changed by
-97.5% (-3.50 Gg CO2 / year).
1990-2022 Emissions have changed by -97.8% (-5.19 Gg CO2 / year). For 2022 the
changes per gas
are:
For 1990-2022 the changes per gas are:
The changes come from the following subsectors:- 1.A: Total sectoral emissions in 2022 are 0.05 Gg
CO2 / year which is 54.4% of category 1 emissions. 2022 Emissions have
changed by -98.6% (-3.48 Gg CO2 /
year). 1990-2022 Emissions have changed by -99.0% (-5.15 Gg CO2 / year). For 2022 the
changes per gas
are:

For 1990-2022 the changes per gas are: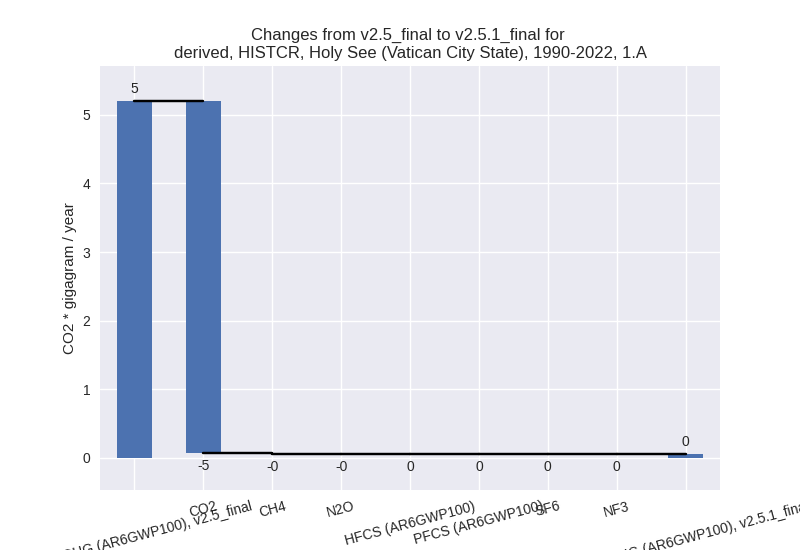
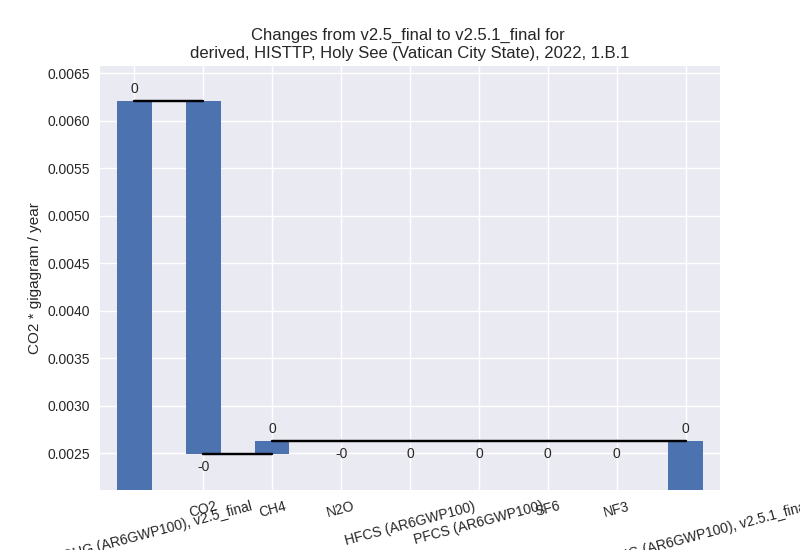
There is no subsector information available in PRIMAP-hist. - 1.B.1: Total sectoral emissions in 2022 are 0.00 Gg
CO2 / year which is 2.9% of category 1 emissions. 2022 Emissions have
changed by -57.6% (-0.00 Gg CO2 /
year). 1990-2022 Emissions have changed by -28.1% (-0.01 Gg CO2 / year). For 2022 the
changes per gas
are:

For 1990-2022 the changes per gas are: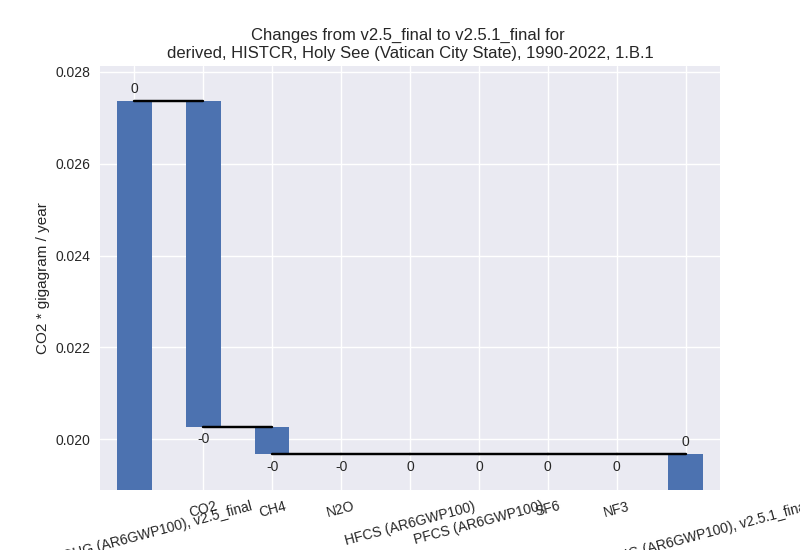
There is no subsector information available in PRIMAP-hist. - 1.B.2: Total sectoral emissions in 2022 are 0.04 Gg
CO2 / year which is 42.7% of category 1 emissions. 2022 Emissions have
changed by -37.2% (-0.02 Gg CO2 /
year). 1990-2022 Emissions have changed by -40.0% (-0.03 Gg CO2 / year). For 2022 the
changes per gas
are:
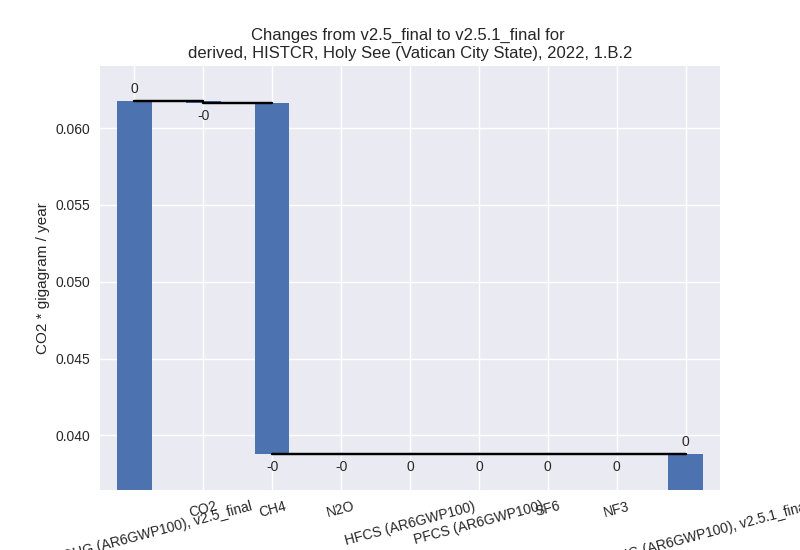
For 1990-2022 the changes per gas are:
There is no subsector information available in PRIMAP-hist.
- 1.A: Total sectoral emissions in 2022 are 0.05 Gg
CO2 / year which is 54.4% of category 1 emissions. 2022 Emissions have
changed by -98.6% (-3.48 Gg CO2 /
year). 1990-2022 Emissions have changed by -99.0% (-5.15 Gg CO2 / year). For 2022 the
changes per gas
are:
- 2: Total sectoral emissions in 2022 are 0.45 Gg CO2
/ year which is 43.1% of M.0.EL emissions. 2022 Emissions have changed
by -11.5% (-0.06 Gg CO2 / year).
1990-2022 Emissions have changed by -20.2% (-0.14 Gg CO2 / year). For 2022 the
changes per gas
are:
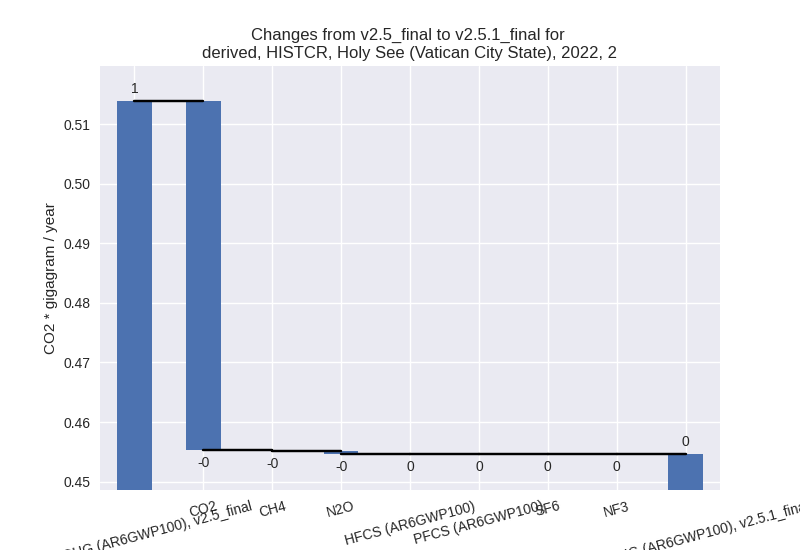
For 1990-2022 the changes per gas are: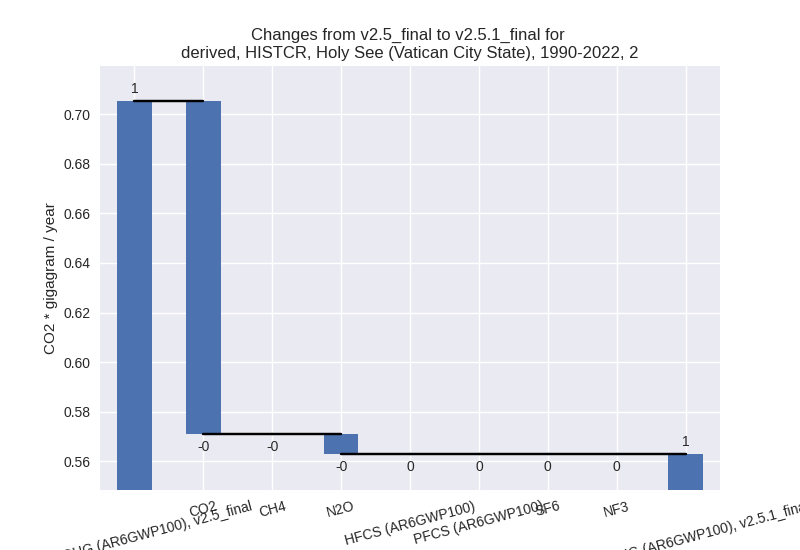
- M.AG: Total sectoral emissions in 2022 are 0.31 Gg
CO2 / year which is 29.2% of M.0.EL emissions. 2022 Emissions have
changed by -29.2% (-0.13 Gg CO2 /
year). 1990-2022 Emissions have changed by -21.2% (-0.10 Gg CO2 / year). For 2022 the
changes per gas
are:

For 1990-2022 the changes per gas are:
The changes come from the following subsectors:- 3.A: Total sectoral emissions in 2022 are 0.21 Gg
CO2 / year which is 68.9% of category M.AG emissions. 2022 Emissions
have changed by -28.1% (-0.08 Gg CO2
/ year). 1990-2022 Emissions have changed by -21.5% (-0.07 Gg CO2 / year). For 2022 the
changes per gas
are:

For 1990-2022 the changes per gas are:
There is no subsector information available in PRIMAP-hist. - M.AG.ELV: Total sectoral emissions in 2022 are 0.10
Gg CO2 / year which is 31.1% of category M.AG emissions. 2022 Emissions
have changed by -31.6% (-0.04 Gg CO2
/ year). 1990-2022 Emissions have changed by -20.7% (-0.03 Gg CO2 / year). For 2022 the
changes per gas
are:

For 1990-2022 the changes per gas are:
There is no subsector information available in PRIMAP-hist.
- 3.A: Total sectoral emissions in 2022 are 0.21 Gg
CO2 / year which is 68.9% of category M.AG emissions. 2022 Emissions
have changed by -28.1% (-0.08 Gg CO2
/ year). 1990-2022 Emissions have changed by -21.5% (-0.07 Gg CO2 / year). For 2022 the
changes per gas
are:
- 4: Total sectoral emissions in 2022 are 0.20 Gg CO2
/ year which is 19.1% of M.0.EL emissions. 2022 Emissions have changed
by 10.2% (0.02 Gg CO2 / year).
1990-2022 Emissions have changed by 0.2% (0.00 Gg CO2 / year). For 2022 the
changes per gas
are:

- 5: Total sectoral emissions in 2022 are 0.00 Gg CO2
/ year which is 0.0% of M.0.EL emissions. 2022 Emissions have changed by
-100.0% (-0.01 Gg CO2 / year).
1990-2022 Emissions have changed by -1.0% (-0.00 Gg CO2 / year). For 2022 the
changes per gas
are:

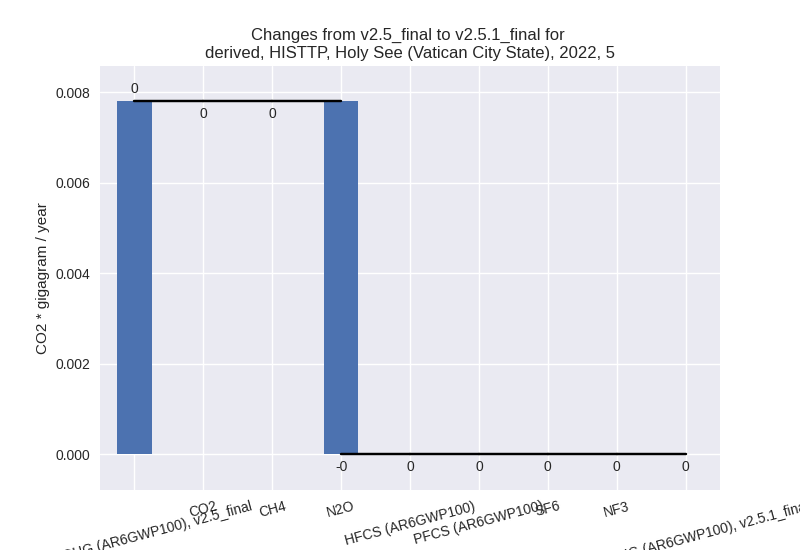
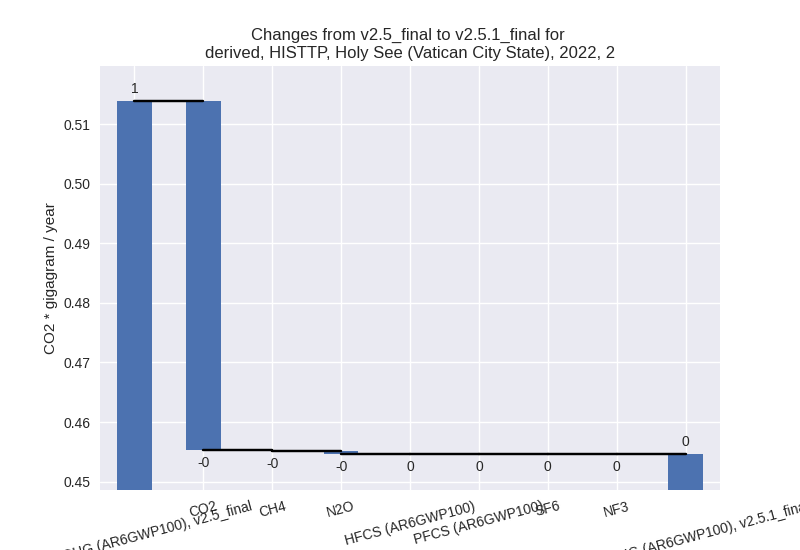
third party scenario (HISTTP):
Most important changes per time frame
For 2022 the following sector-gas combinations have the highest absolute impact on national total KyotoGHG (AR6GWP100) emissions in 2022 (top 5):
- 1: 1.A, CO2 with -3.46 Gg CO2 / year (-100.0%)
- 2: 3.A, CH4 with -0.08 Gg CO2 / year (-28.1%)
- 3: 2, CO2 with -0.06 Gg CO2 / year (-25.3%)
- 4: M.AG.ELV, N2O with -0.04 Gg CO2 / year (-33.3%)
- 5: 1.B.2, CH4 with -0.02 Gg CO2 / year (-38.5%)
For 1990-2022 the following sector-gas combinations have the highest absolute impact on national total KyotoGHG (AR6GWP100) emissions in 1990-2022 (top 5):
- 1: 1.A, CO2 with -5.13 Gg CO2 / year (-100.0%)
- 2: 2, CO2 with -0.13 Gg CO2 / year (-31.9%)
- 3: 3.A, CH4 with -0.06 Gg CO2 / year (-21.5%)
- 4: 1.B.2, CH4 with -0.03 Gg CO2 / year (-41.0%)
- 5: M.AG.ELV, N2O with -0.03 Gg CO2 / year (-23.8%)
Changes in the main sectors for aggregate KyotoGHG (AR6GWP100) are
- 1: Total sectoral emissions in 2022 are 0.09 Gg CO2
/ year which is 8.6% of M.0.EL emissions. 2022 Emissions have changed by
-97.5% (-3.50 Gg CO2 / year).
1990-2022 Emissions have changed by -97.8% (-5.19 Gg CO2 / year). For 2022 the
changes per gas
are:

For 1990-2022 the changes per gas are:
The changes come from the following subsectors:- 1.A: Total sectoral emissions in 2022 are 0.05 Gg
CO2 / year which is 54.4% of category 1 emissions. 2022 Emissions have
changed by -98.6% (-3.48 Gg CO2 /
year). 1990-2022 Emissions have changed by -99.0% (-5.15 Gg CO2 / year). For 2022 the
changes per gas
are:

For 1990-2022 the changes per gas are: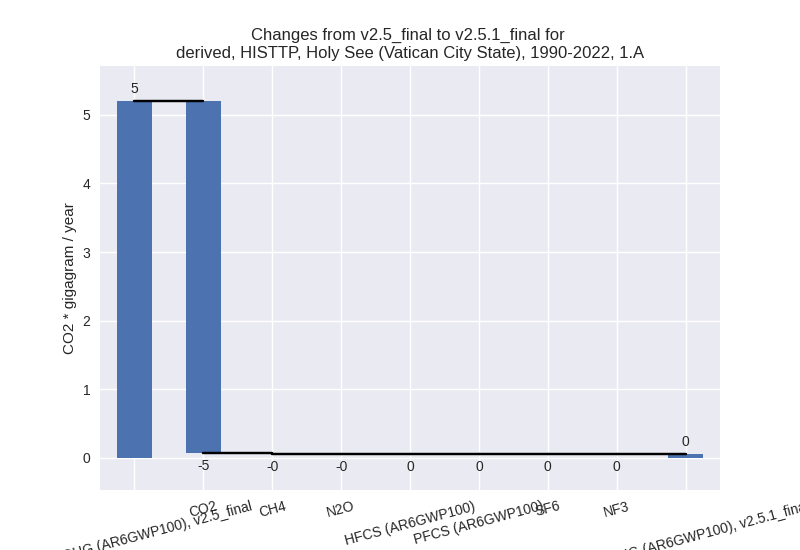
There is no subsector information available in PRIMAP-hist. - 1.B.1: Total sectoral emissions in 2022 are 0.00 Gg
CO2 / year which is 2.9% of category 1 emissions. 2022 Emissions have
changed by -57.6% (-0.00 Gg CO2 /
year). 1990-2022 Emissions have changed by -28.1% (-0.01 Gg CO2 / year). For 2022 the
changes per gas
are:
For 1990-2022 the changes per gas are:
There is no subsector information available in PRIMAP-hist. - 1.B.2: Total sectoral emissions in 2022 are 0.04 Gg
CO2 / year which is 42.7% of category 1 emissions. 2022 Emissions have
changed by -37.2% (-0.02 Gg CO2 /
year). 1990-2022 Emissions have changed by -40.0% (-0.03 Gg CO2 / year). For 2022 the
changes per gas
are:

For 1990-2022 the changes per gas are: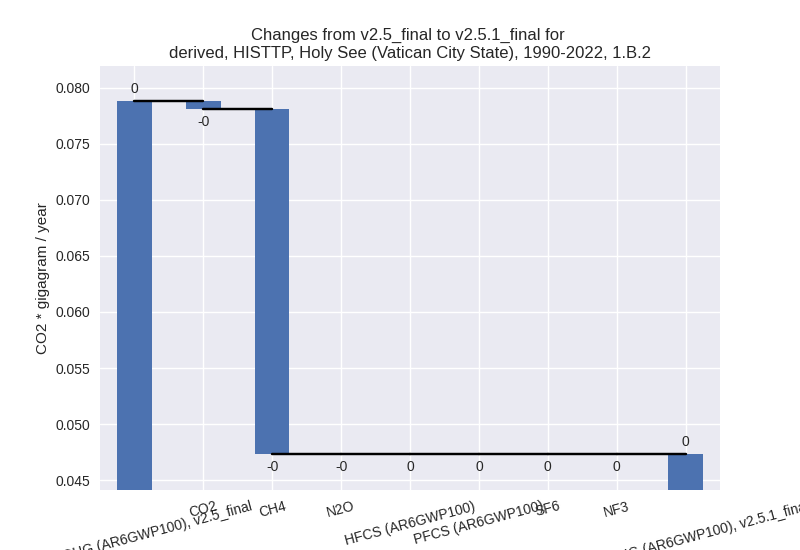
There is no subsector information available in PRIMAP-hist.
- 1.A: Total sectoral emissions in 2022 are 0.05 Gg
CO2 / year which is 54.4% of category 1 emissions. 2022 Emissions have
changed by -98.6% (-3.48 Gg CO2 /
year). 1990-2022 Emissions have changed by -99.0% (-5.15 Gg CO2 / year). For 2022 the
changes per gas
are:
- 2: Total sectoral emissions in 2022 are 0.45 Gg CO2
/ year which is 43.1% of M.0.EL emissions. 2022 Emissions have changed
by -11.5% (-0.06 Gg CO2 / year).
1990-2022 Emissions have changed by -20.2% (-0.14 Gg CO2 / year). For 2022 the
changes per gas
are:
For 1990-2022 the changes per gas are:
- M.AG: Total sectoral emissions in 2022 are 0.31 Gg
CO2 / year which is 29.2% of M.0.EL emissions. 2022 Emissions have
changed by -29.2% (-0.13 Gg CO2 /
year). 1990-2022 Emissions have changed by -21.2% (-0.10 Gg CO2 / year). For 2022 the
changes per gas
are:
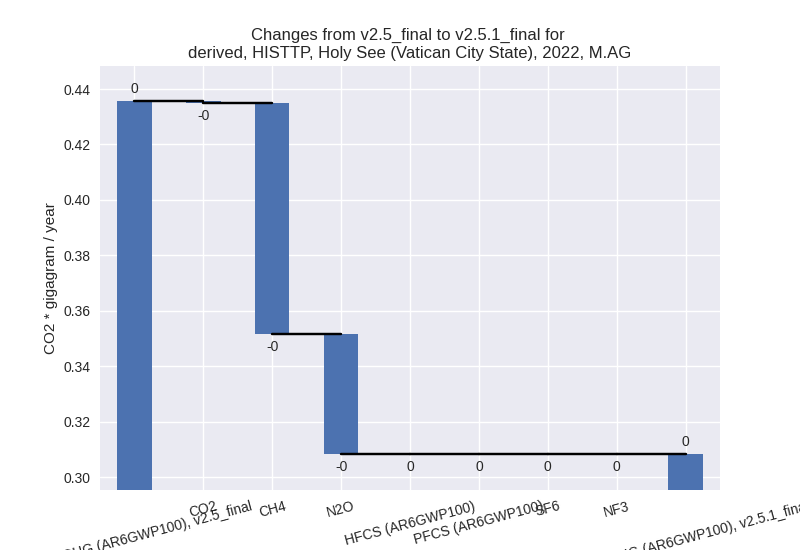
For 1990-2022 the changes per gas are:
The changes come from the following subsectors:- 3.A: Total sectoral emissions in 2022 are 0.21 Gg
CO2 / year which is 68.9% of category M.AG emissions. 2022 Emissions
have changed by -28.1% (-0.08 Gg CO2
/ year). 1990-2022 Emissions have changed by -21.5% (-0.07 Gg CO2 / year). For 2022 the
changes per gas
are:

For 1990-2022 the changes per gas are: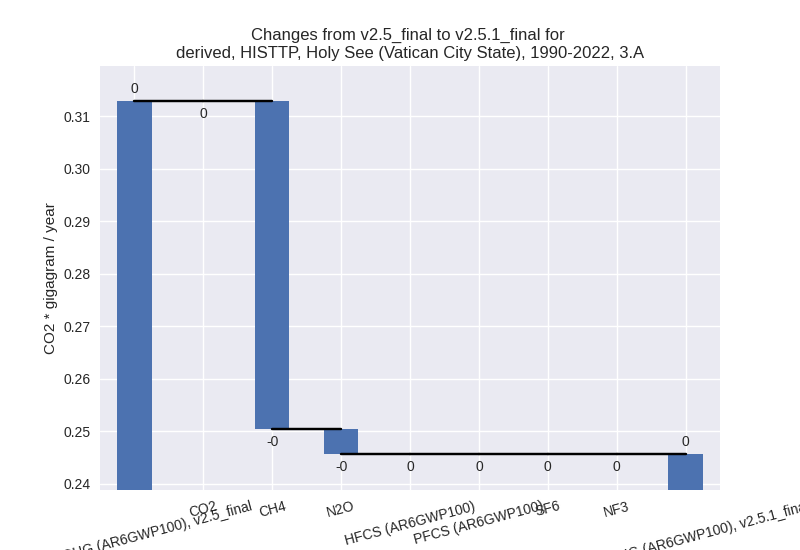
There is no subsector information available in PRIMAP-hist. - M.AG.ELV: Total sectoral emissions in 2022 are 0.10
Gg CO2 / year which is 31.1% of category M.AG emissions. 2022 Emissions
have changed by -31.6% (-0.04 Gg CO2
/ year). 1990-2022 Emissions have changed by -20.7% (-0.03 Gg CO2 / year). For 2022 the
changes per gas
are:
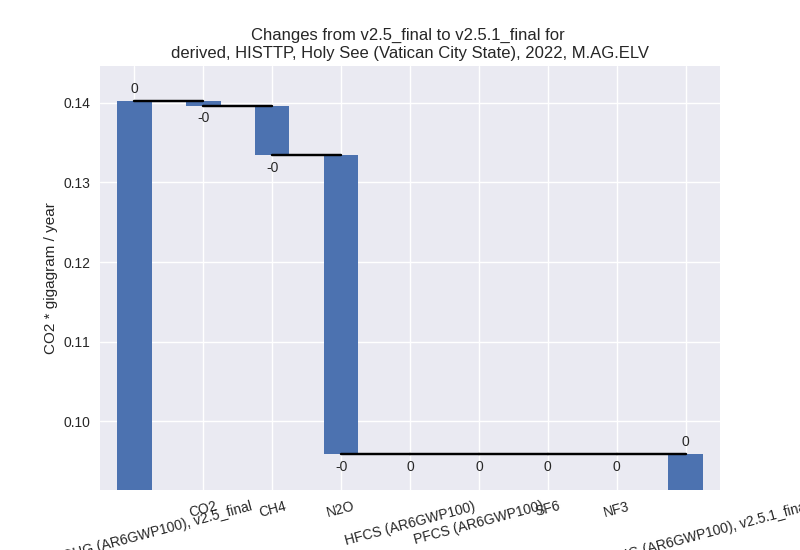
For 1990-2022 the changes per gas are:
There is no subsector information available in PRIMAP-hist.
- 3.A: Total sectoral emissions in 2022 are 0.21 Gg
CO2 / year which is 68.9% of category M.AG emissions. 2022 Emissions
have changed by -28.1% (-0.08 Gg CO2
/ year). 1990-2022 Emissions have changed by -21.5% (-0.07 Gg CO2 / year). For 2022 the
changes per gas
are:
- 4: Total sectoral emissions in 2022 are 0.20 Gg CO2
/ year which is 19.1% of M.0.EL emissions. 2022 Emissions have changed
by 10.2% (0.02 Gg CO2 / year).
1990-2022 Emissions have changed by 0.2% (0.00 Gg CO2 / year). For 2022 the
changes per gas
are:
- 5: Total sectoral emissions in 2022 are 0.00 Gg CO2
/ year which is 0.0% of M.0.EL emissions. 2022 Emissions have changed by
-100.0% (-0.01 Gg CO2 / year).
1990-2022 Emissions have changed by -1.0% (-0.00 Gg CO2 / year). For 2022 the
changes per gas
are: