Changes in PRIMAP-hist v2.5.1_final compared to v2.5_final for Viet Nam
2024-02-29
Johannes Gütschow
Change analysis for Viet Nam for PRIMAP-hist v2.5.1_final compared to v2.5_final
Overview over emissions by sector and gas
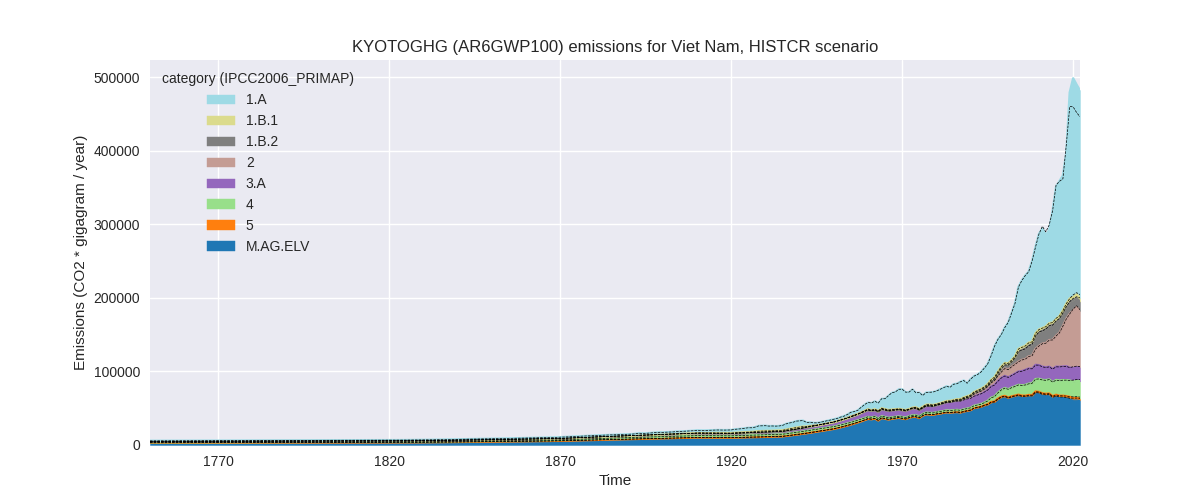
The following figures show the aggregate national total emissions excluding LULUCF AR6GWP100 for the country reported priority scenario. The dotted linesshow the v2.5_final data.

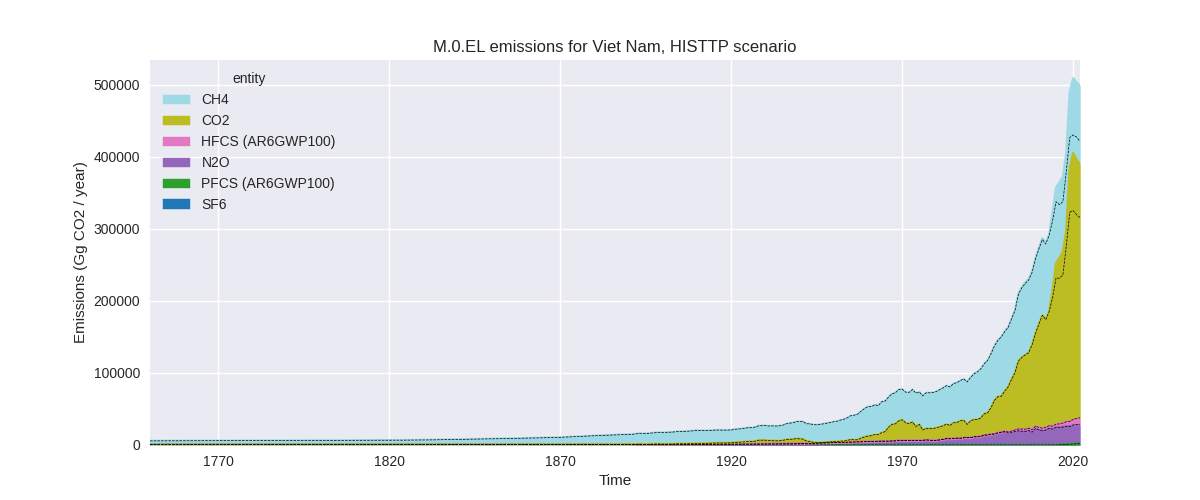
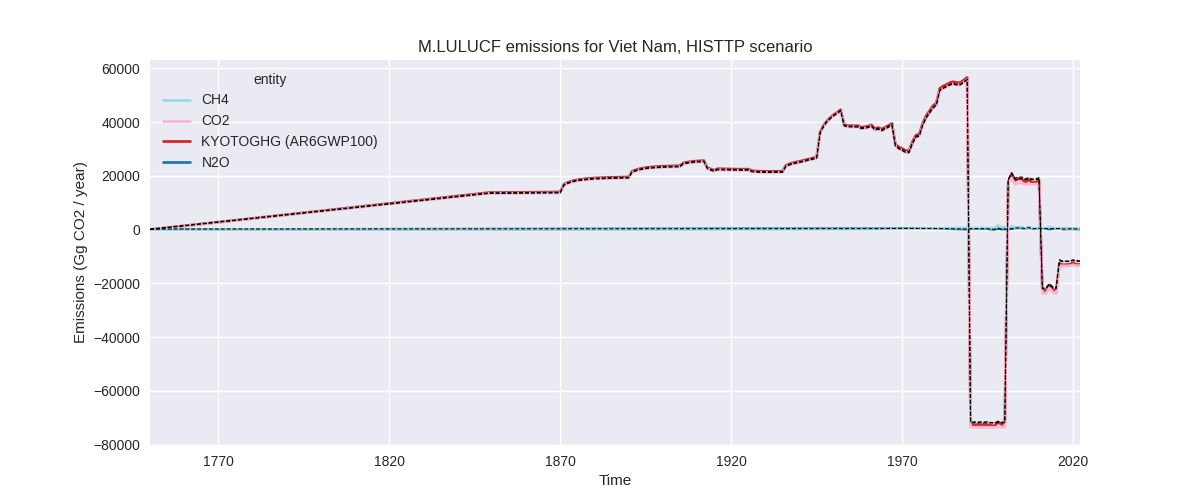
The following figures show the aggregate national total emissions excluding LULUCF AR6GWP100 for the third party priority scenario. The dotted linesshow the v2.5_final data.

Overview over changes
In the country reported priority scenario we have the following changes for aggregate Kyoto GHG and national total emissions excluding LULUCF (M.0.EL):
- Emissions in 2022 have changed by 8.0%% (35737.31 Gg CO2 / year)
- Emissions in 1990-2022 have changed by 1.3%% (3269.08 Gg CO2 / year)
In the third party priority scenario we have the following changes for aggregate Kyoto GHG and national total emissions excluding LULUCF (M.0.EL):
- Emissions in 2022 have changed by 18.3%% (76903.87 Gg CO2 / year)
- Emissions in 1990-2022 have changed by 5.5%% (12984.47 Gg CO2 / year)
Most important changes per scenario and time frame
In the country reported priority scenario the following sector-gas combinations have the highest absolute impact on national total KyotoGHG (AR6GWP100) emissions in 2022 (top 5):
- 1: 1.A, CO2 with 39982.42 Gg CO2 / year (16.7%)
- 2: 1.B.2, CH4 with -3524.84 Gg CO2 / year (-23.3%)
- 3: M.AG.ELV, CO2 with -1351.42 Gg CO2 / year (-52.0%)
- 4: 3.A, CH4 with 1258.43 Gg CO2 / year (8.8%)
- 5: M.AG.ELV, N2O with -927.79 Gg CO2 / year (-6.8%)
In the country reported priority scenario the following sector-gas combinations have the highest absolute impact on national total KyotoGHG (AR6GWP100) emissions in 1990-2022 (top 5):
- 1: 1.A, CO2 with 3610.61 Gg CO2 / year (3.4%)
- 2: 1.B.2, CH4 with -157.04 Gg CO2 / year (-1.6%)
- 3: M.AG.ELV, CO2 with -88.18 Gg CO2 / year (-6.9%)
- 4: M.AG.ELV, N2O with -87.18 Gg CO2 / year (-0.8%)
- 5: 3.A, CH4 with 47.21 Gg CO2 / year (0.3%)
In the third party priority scenario the following sector-gas combinations have the highest absolute impact on national total KyotoGHG (AR6GWP100) emissions in 2022 (top 5):
- 1: 1.A, CO2 with 79253.89 Gg CO2 / year (38.3%)
- 2: 1.B.1, CH4 with 4096.38 Gg CO2 / year (21.5%)
- 3: M.AG.ELV, CO2 with -2943.49 Gg CO2 / year (-60.0%)
- 4: M.AG.ELV, N2O with -2097.53 Gg CO2 / year (-11.1%)
- 5: M.AG.ELV, CH4 with -1658.51 Gg CO2 / year (-4.4%)
In the third party priority scenario the following sector-gas combinations have the highest absolute impact on national total KyotoGHG (AR6GWP100) emissions in 1990-2022 (top 5):
- 1: 1.A, CO2 with 12720.58 Gg CO2 / year (13.2%)
- 2: 1.B.1, CH4 with 964.26 Gg CO2 / year (8.4%)
- 3: M.AG.ELV, N2O with -480.15 Gg CO2 / year (-3.5%)
- 4: M.AG.ELV, CO2 with -315.57 Gg CO2 / year (-12.9%)
- 5: 1.A, CH4 with 174.16 Gg CO2 / year (5.0%)
Notes on data changes
Here we list notes explaining important emissions changes for the country. ’' means that the following text only applies to the TP time series, while means that it only applies to the CR scenario. Otherwise the note applies to both scenarios.
- 1.A, CO2: Updated CDIAC data has higher emissions for 2015-2017 leading to higher emissions in PRIMAP-hist especially in the TP time-series. The CR and TP time-series are very similar in PRIMAP-hist v2.5.1 as CDIAC and country reported data are very similar.
- 1.B.2, CH4: Extrapolated data for 2022 has been replaced by EDGAR 8.0
- 1.B.1, CH4: Extrapolated data for 2022 has been replaced by EDGAR 8.0.
- M.AG.ELV, N2O: New FAO data are lower for 2020 leading too lower emissions for the latest years in PRIMAP-hist.
- M.AG.ELV, CH4: New FAO and EDGAR data change 2021 and 2022 emissions.
- M.AG.ELV, CO2: EDGAR 8.0 emissions are lower than EDGAR 7.0 starting 2013 leading to much lower post 2013 emissions in PRIMAP-hist. This also affects (to a lesser extent) the CR time-series as the last year with country reported data is 2013.
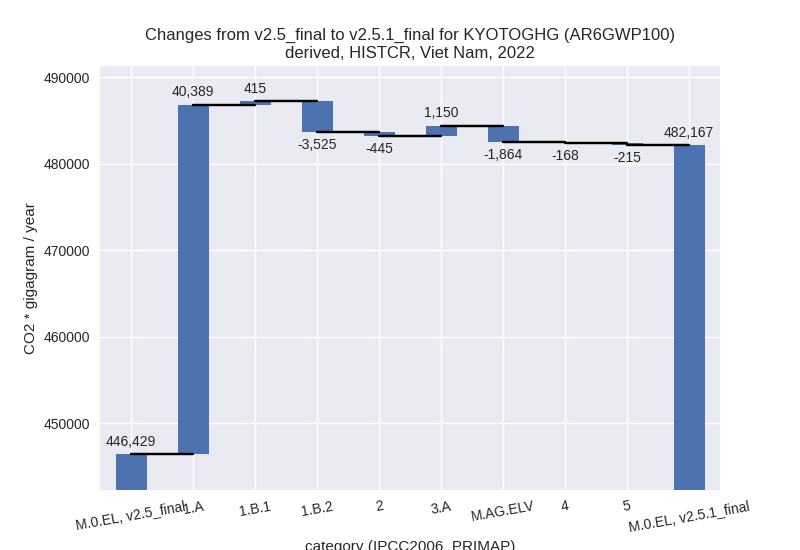
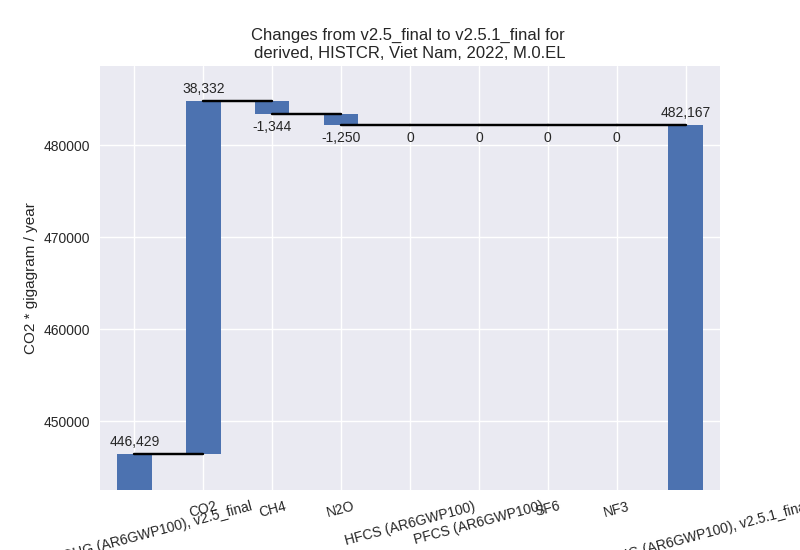
Changes by sector and gas
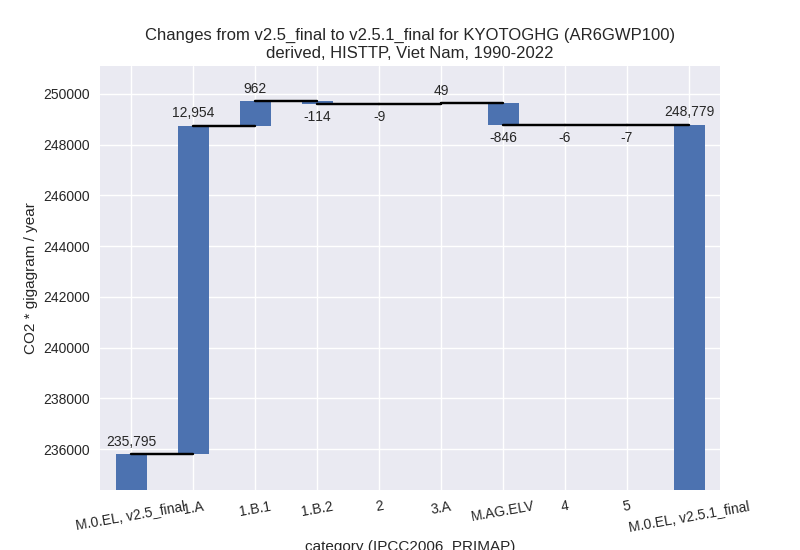
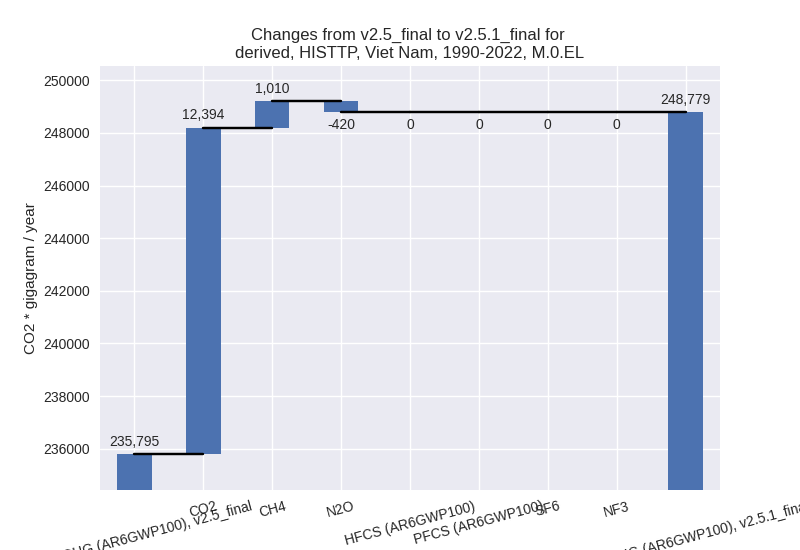
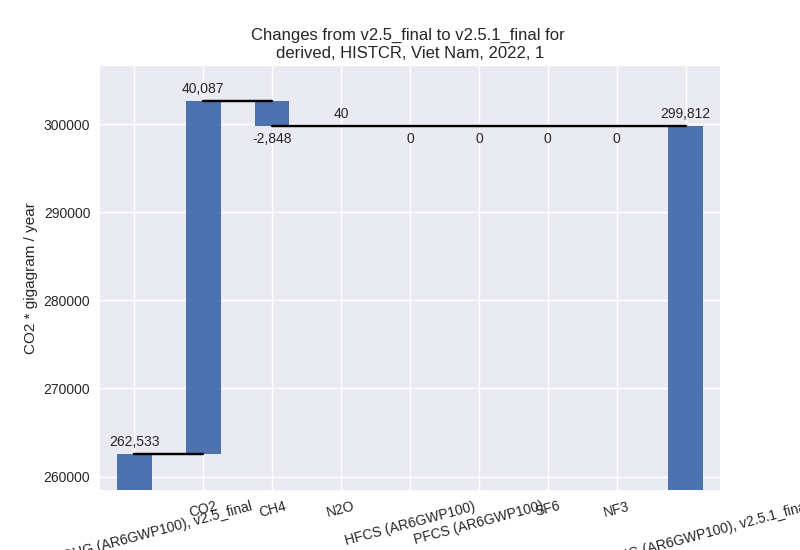
For each scenario and time frame the changes are displayed for all individual sectors and all individual gases. In the sector plot we use aggregate Kyoto GHGs in AR6GWP100. In the gas plot we usenational total emissions without LULUCF. ## country reported scenario
2022
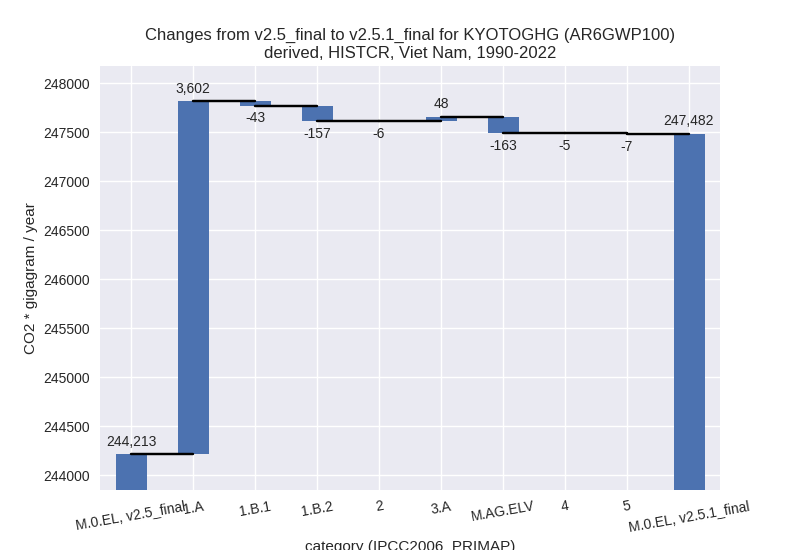
1990-2022

third party scenario
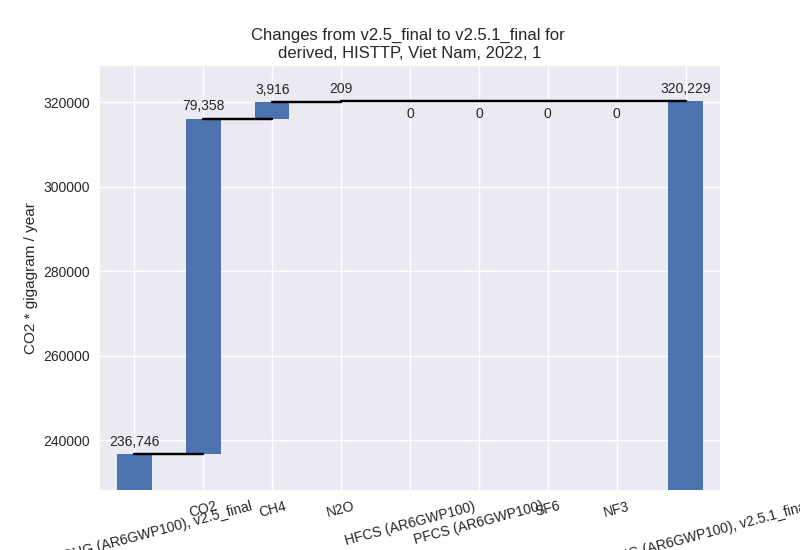
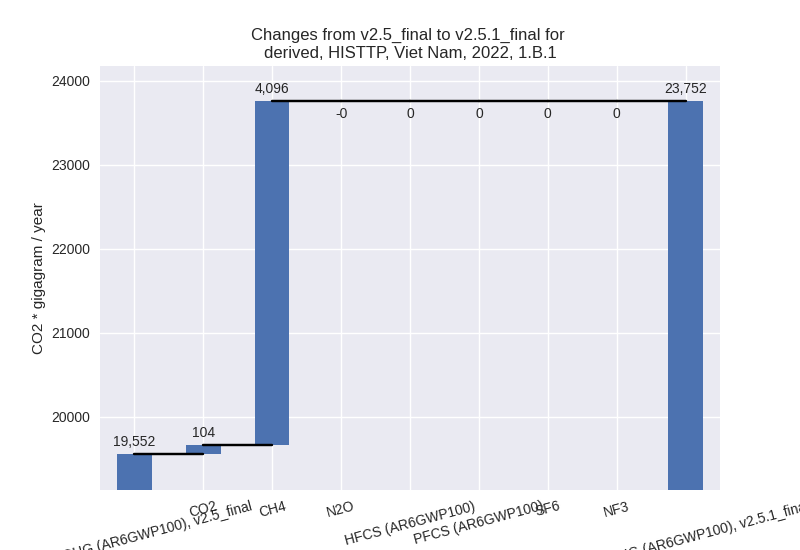
2022


1990-2022
Detailed changes for the scenarios:
country reported scenario (HISTCR):
Most important changes per time frame
For 2022 the following sector-gas combinations have the highest absolute impact on national total KyotoGHG (AR6GWP100) emissions in 2022 (top 5):
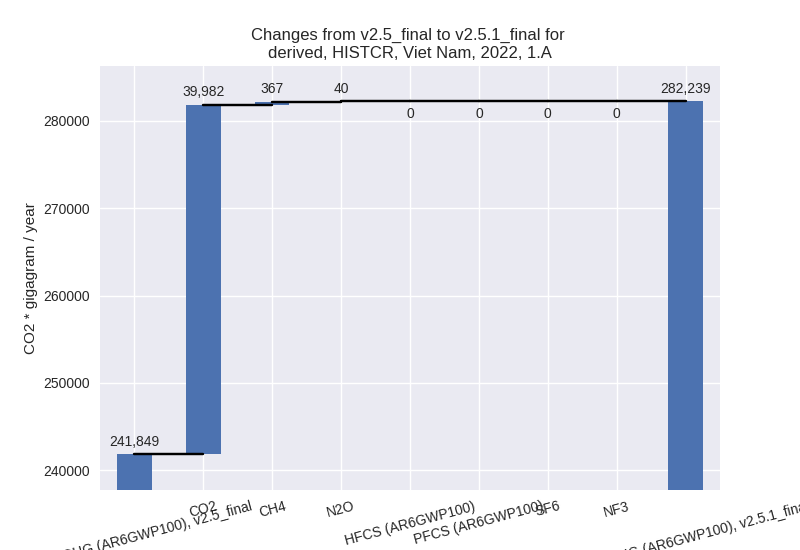
- 1: 1.A, CO2 with 39982.42 Gg CO2 / year (16.7%)
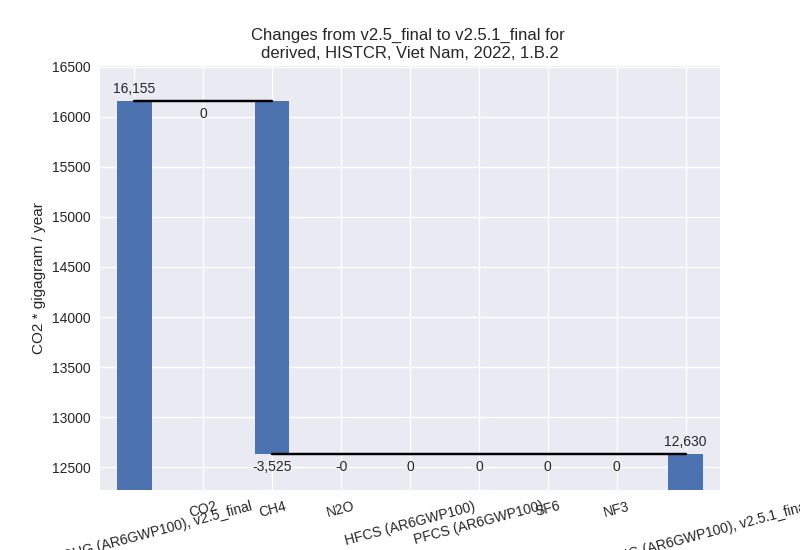
- 2: 1.B.2, CH4 with -3524.84 Gg CO2 / year (-23.3%)
- 3: M.AG.ELV, CO2 with -1351.42 Gg CO2 / year (-52.0%)
- 4: 3.A, CH4 with 1258.43 Gg CO2 / year (8.8%)
- 5: M.AG.ELV, N2O with -927.79 Gg CO2 / year (-6.8%)
For 1990-2022 the following sector-gas combinations have the highest absolute impact on national total KyotoGHG (AR6GWP100) emissions in 1990-2022 (top 5):
- 1: 1.A, CO2 with 3610.61 Gg CO2 / year (3.4%)
- 2: 1.B.2, CH4 with -157.04 Gg CO2 / year (-1.6%)
- 3: M.AG.ELV, CO2 with -88.18 Gg CO2 / year (-6.9%)
- 4: M.AG.ELV, N2O with -87.18 Gg CO2 / year (-0.8%)
- 5: 3.A, CH4 with 47.21 Gg CO2 / year (0.3%)
Changes in the main sectors for aggregate KyotoGHG (AR6GWP100) are
- 1: Total sectoral emissions in 2022 are 299811.83
Gg CO2 / year which is 62.2% of M.0.EL emissions. 2022 Emissions have
changed by 14.2% (37278.85 Gg CO2 /
year). 1990-2022 Emissions have changed by 2.8% (3401.68 Gg CO2 / year). For 2022 the
changes per gas
are:
For 1990-2022 the changes per gas are: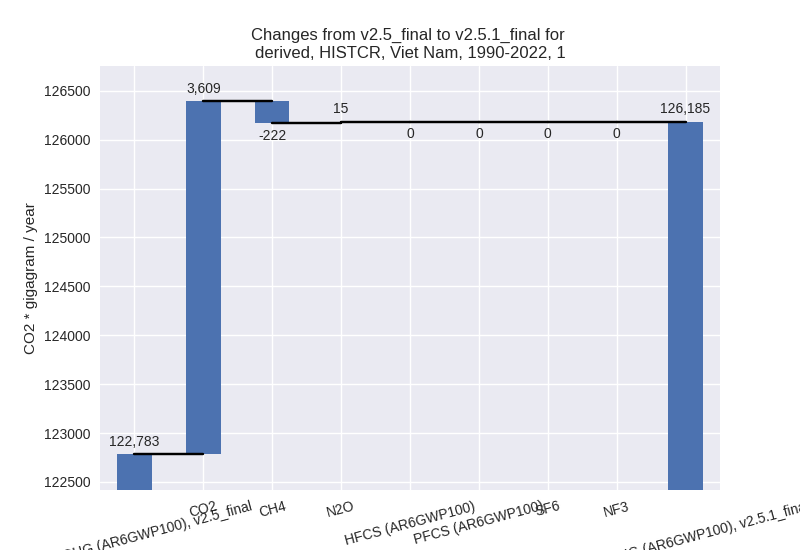
The changes come from the following subsectors:- 1.A: Total sectoral emissions in 2022 are 282238.59
Gg CO2 / year which is 94.1% of category 1 emissions. 2022 Emissions
have changed by 16.7% (40389.35 Gg
CO2 / year). 1990-2022 Emissions have changed by 3.3% (3601.68 Gg CO2 / year). For 2022 the
changes per gas
are:
For 1990-2022 the changes per gas are: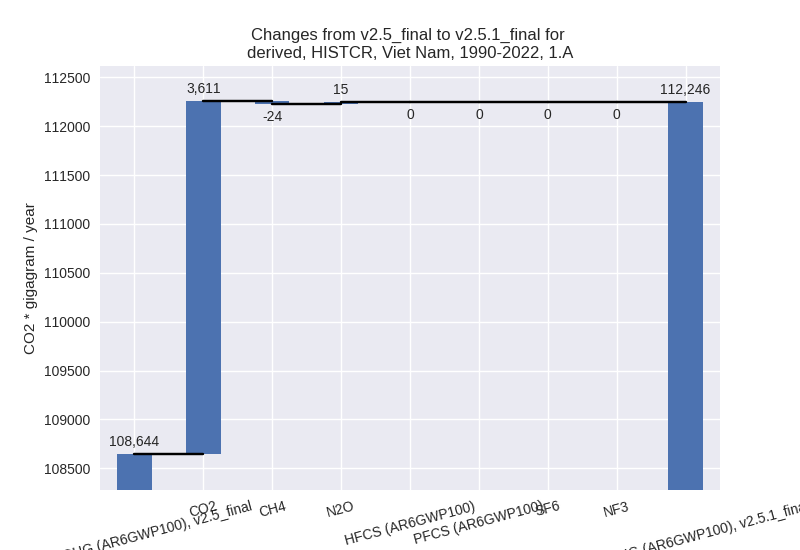
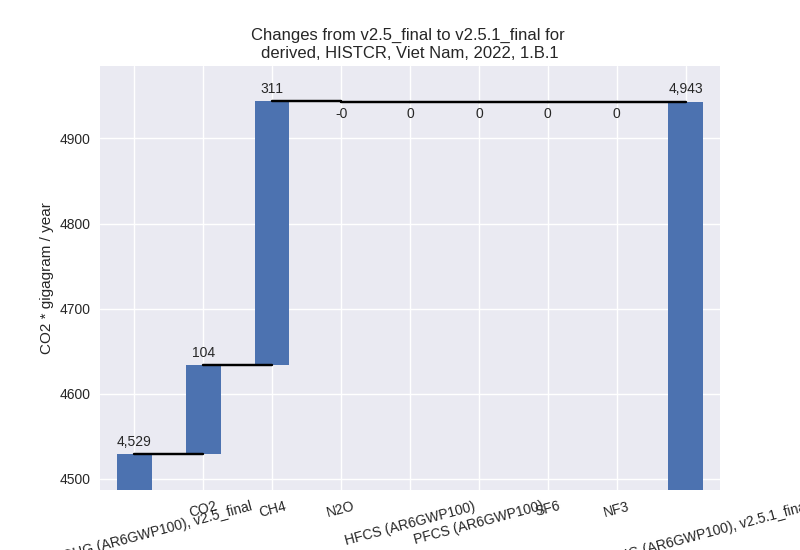
There is no subsector information available in PRIMAP-hist. - 1.B.1: Total sectoral emissions in 2022 are 4943.45
Gg CO2 / year which is 1.6% of category 1 emissions. 2022 Emissions have
changed by 9.2% (414.54 Gg CO2 /
year). 1990-2022 Emissions have changed by -1.5% (-42.98 Gg CO2 / year). For 2022 the
changes per gas
are:
There is no subsector information available in PRIMAP-hist. - 1.B.2: Total sectoral emissions in 2022 are
12629.80 Gg CO2 / year which is 4.2% of category 1 emissions. 2022
Emissions have changed by -21.8%
(-3525.03 Gg CO2 / year). 1990-2022 Emissions have changed by -1.4% (-157.02 Gg CO2 / year). For 2022
the changes per gas
are:
There is no subsector information available in PRIMAP-hist.
- 1.A: Total sectoral emissions in 2022 are 282238.59
Gg CO2 / year which is 94.1% of category 1 emissions. 2022 Emissions
have changed by 16.7% (40389.35 Gg
CO2 / year). 1990-2022 Emissions have changed by 3.3% (3601.68 Gg CO2 / year). For 2022 the
changes per gas
are:
- 2: Total sectoral emissions in 2022 are 76816.64 Gg CO2 / year which is 15.9% of M.0.EL emissions. 2022 Emissions have changed by -0.6% (-444.51 Gg CO2 / year). 1990-2022 Emissions have changed by -0.0% (-6.02 Gg CO2 / year).
- M.AG: Total sectoral emissions in 2022 are 80038.21 Gg CO2 / year which is 16.6% of M.0.EL emissions. 2022 Emissions have changed by -0.9% (-714.01 Gg CO2 / year). 1990-2022 Emissions have changed by -0.1% (-114.98 Gg CO2 / year).
- 4: Total sectoral emissions in 2022 are 23697.08 Gg CO2 / year which is 4.9% of M.0.EL emissions. 2022 Emissions have changed by -0.7% (-167.73 Gg CO2 / year). 1990-2022 Emissions have changed by -0.0% (-5.08 Gg CO2 / year).
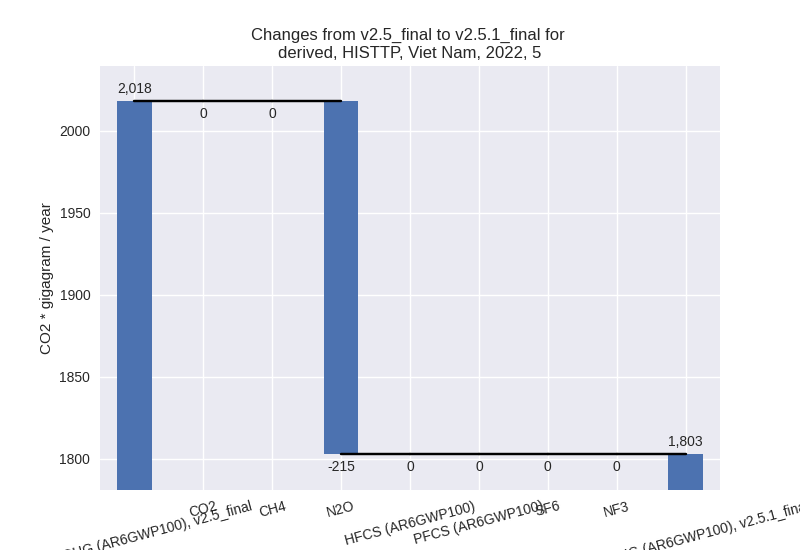
- 5: Total sectoral emissions in 2022 are 1802.78 Gg
CO2 / year which is 0.4% of M.0.EL emissions. 2022 Emissions have
changed by -10.7% (-215.29 Gg CO2 /
year). 1990-2022 Emissions have changed by -0.6% (-6.52 Gg CO2 / year). For 2022 the
changes per gas
are:

third party scenario (HISTTP):
Most important changes per time frame
For 2022 the following sector-gas combinations have the highest absolute impact on national total KyotoGHG (AR6GWP100) emissions in 2022 (top 5):
- 1: 1.A, CO2 with 79253.89 Gg CO2 / year (38.3%)
- 2: 1.B.1, CH4 with 4096.38 Gg CO2 / year (21.5%)
- 3: M.AG.ELV, CO2 with -2943.49 Gg CO2 / year (-60.0%)
- 4: M.AG.ELV, N2O with -2097.53 Gg CO2 / year (-11.1%)
- 5: M.AG.ELV, CH4 with -1658.51 Gg CO2 / year (-4.4%)
For 1990-2022 the following sector-gas combinations have the highest absolute impact on national total KyotoGHG (AR6GWP100) emissions in 1990-2022 (top 5):
- 1: 1.A, CO2 with 12720.58 Gg CO2 / year (13.2%)
- 2: 1.B.1, CH4 with 964.26 Gg CO2 / year (8.4%)
- 3: M.AG.ELV, N2O with -480.15 Gg CO2 / year (-3.5%)
- 4: M.AG.ELV, CO2 with -315.57 Gg CO2 / year (-12.9%)
- 5: 1.A, CH4 with 174.16 Gg CO2 / year (5.0%)
Changes in the main sectors for aggregate KyotoGHG (AR6GWP100) are
- 1: Total sectoral emissions in 2022 are 320228.77
Gg CO2 / year which is 64.3% of M.0.EL emissions. 2022 Emissions have
changed by 35.3% (83483.02 Gg CO2 /
year). 1990-2022 Emissions have changed by 11.5% (13802.49 Gg CO2 / year). For 2022
the changes per gas
are:
For 1990-2022 the changes per gas are:
The changes come from the following subsectors:- 1.A: Total sectoral emissions in 2022 are 290201.85
Gg CO2 / year which is 90.6% of category 1 emissions. 2022 Emissions
have changed by 38.5% (80664.92 Gg
CO2 / year). 1990-2022 Emissions have changed by 12.9% (12954.13 Gg CO2 / year). For 2022
the changes per gas
are:

For 1990-2022 the changes per gas are: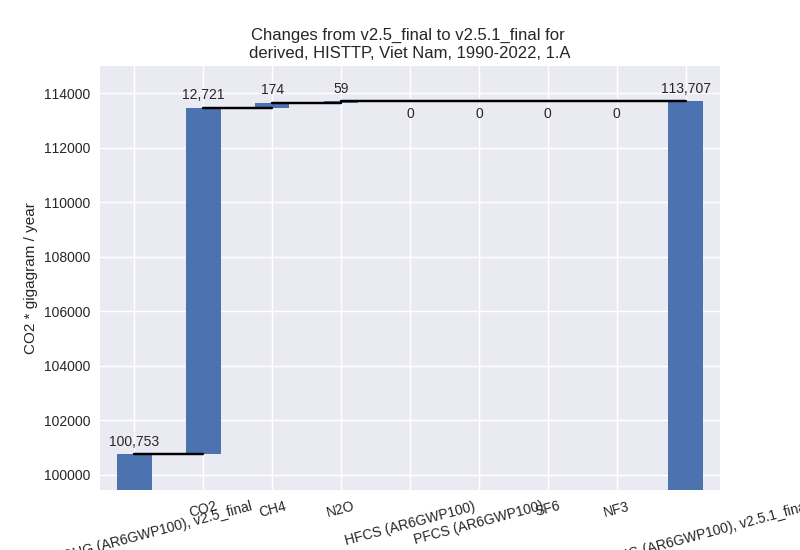
There is no subsector information available in PRIMAP-hist. - 1.B.1: Total sectoral emissions in 2022 are
23752.25 Gg CO2 / year which is 7.4% of category 1 emissions. 2022
Emissions have changed by 21.5%
(4200.38 Gg CO2 / year). 1990-2022 Emissions have changed by 8.2% (962.13 Gg CO2 / year). For 2022 the
changes per gas
are:
For 1990-2022 the changes per gas are: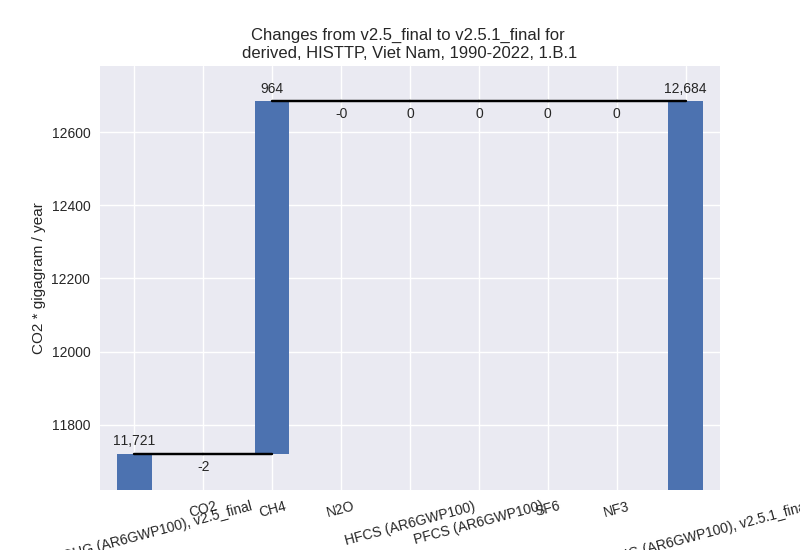
There is no subsector information available in PRIMAP-hist. - 1.B.2: Total sectoral emissions in 2022 are 6274.68
Gg CO2 / year which is 2.0% of category 1 emissions. 2022 Emissions have
changed by -18.1% (-1382.27 Gg CO2 /
year). 1990-2022 Emissions have changed by -1.5% (-113.77 Gg CO2 / year). For 2022
the changes per gas
are:

There is no subsector information available in PRIMAP-hist.
- 1.A: Total sectoral emissions in 2022 are 290201.85
Gg CO2 / year which is 90.6% of category 1 emissions. 2022 Emissions
have changed by 38.5% (80664.92 Gg
CO2 / year). 1990-2022 Emissions have changed by 12.9% (12954.13 Gg CO2 / year). For 2022
the changes per gas
are:
- 2: Total sectoral emissions in 2022 are 74028.30 Gg CO2 / year which is 14.9% of M.0.EL emissions. 2022 Emissions have changed by -0.9% (-661.63 Gg CO2 / year). 1990-2022 Emissions have changed by -0.0% (-9.06 Gg CO2 / year).
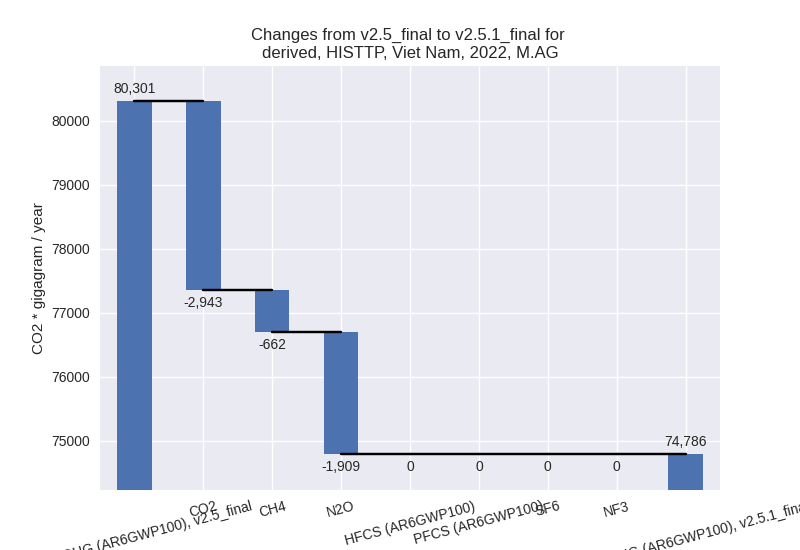
- M.AG: Total sectoral emissions in 2022 are 74785.90
Gg CO2 / year which is 15.0% of M.0.EL emissions. 2022 Emissions have
changed by -6.9% (-5515.17 Gg CO2 /
year). 1990-2022 Emissions have changed by -1.1% (-796.76 Gg CO2 / year). For 2022
the changes per gas
are:
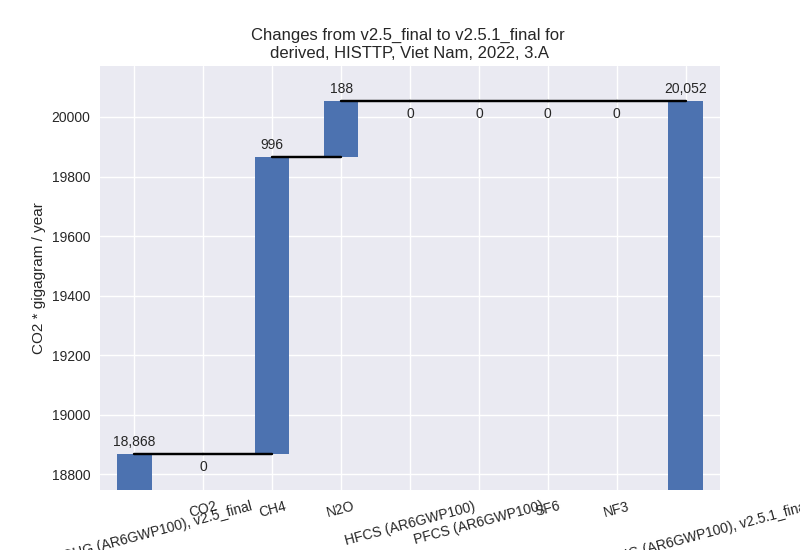
The changes come from the following subsectors:- 3.A: Total sectoral emissions in 2022 are 20052.44
Gg CO2 / year which is 26.8% of category M.AG emissions. 2022 Emissions
have changed by 6.3% (1184.36 Gg CO2
/ year). 1990-2022 Emissions have changed by 0.3% (49.04 Gg CO2 / year). For 2022 the
changes per gas
are:
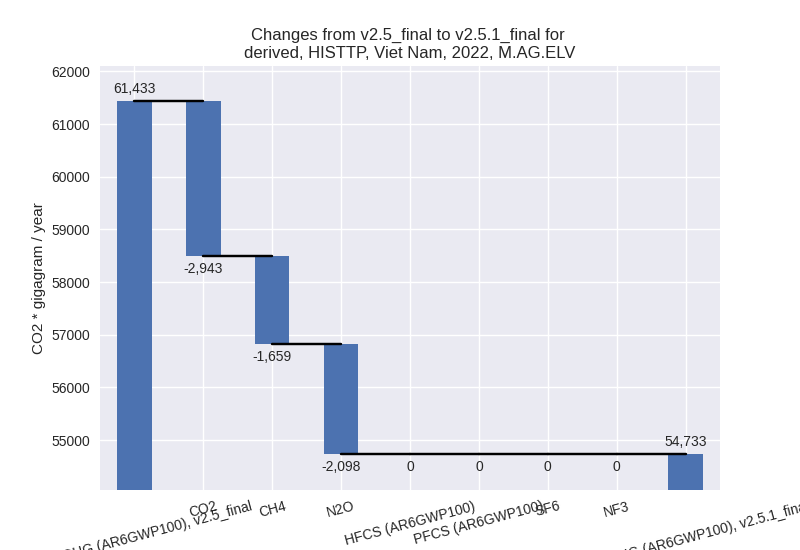
There is no subsector information available in PRIMAP-hist. - M.AG.ELV: Total sectoral emissions in 2022 are
54733.46 Gg CO2 / year which is 73.2% of category M.AG emissions. 2022
Emissions have changed by -10.9%
(-6699.53 Gg CO2 / year). 1990-2022 Emissions have changed by -1.6% (-845.80 Gg CO2 / year). For 2022
the changes per gas
are:
There is no subsector information available in PRIMAP-hist.
- 3.A: Total sectoral emissions in 2022 are 20052.44
Gg CO2 / year which is 26.8% of category M.AG emissions. 2022 Emissions
have changed by 6.3% (1184.36 Gg CO2
/ year). 1990-2022 Emissions have changed by 0.3% (49.04 Gg CO2 / year). For 2022 the
changes per gas
are:
- 4: Total sectoral emissions in 2022 are 27149.36 Gg CO2 / year which is 5.5% of M.0.EL emissions. 2022 Emissions have changed by -0.7% (-187.06 Gg CO2 / year). 1990-2022 Emissions have changed by -0.0% (-5.67 Gg CO2 / year).
- 5: Total sectoral emissions in 2022 are 1802.78 Gg
CO2 / year which is 0.4% of M.0.EL emissions. 2022 Emissions have
changed by -10.7% (-215.29 Gg CO2 /
year). 1990-2022 Emissions have changed by -0.6% (-6.52 Gg CO2 / year). For 2022 the
changes per gas
are: