Changes in PRIMAP-hist v2.5.1_final compared to v2.5_final for Yemen
2024-02-29
Johannes Gütschow
Change analysis for Yemen for PRIMAP-hist v2.5.1_final compared to v2.5_final
Overview over emissions by sector and gas
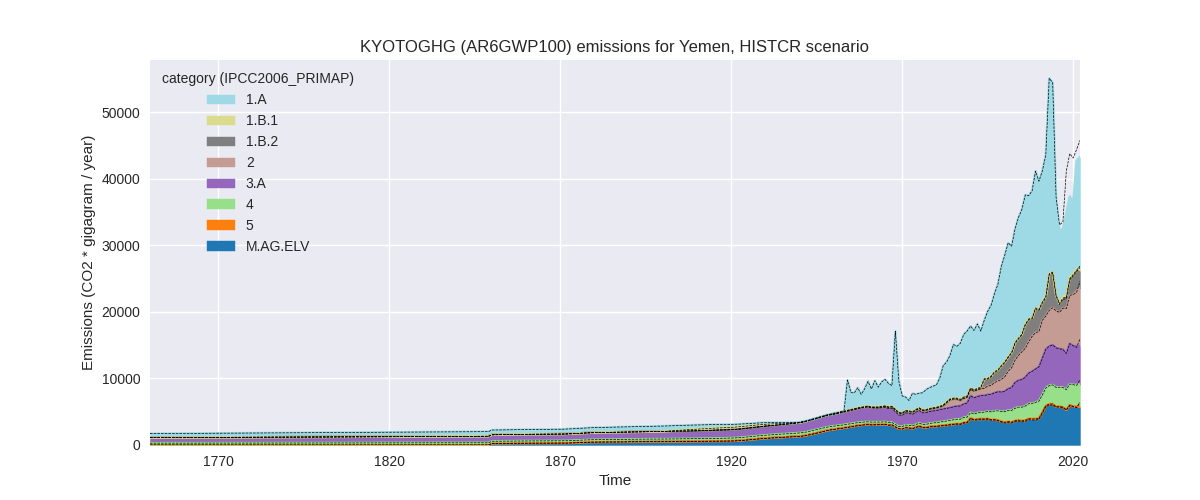
The following figures show the aggregate national total emissions excluding LULUCF AR6GWP100 for the country reported priority scenario. The dotted linesshow the v2.5_final data.

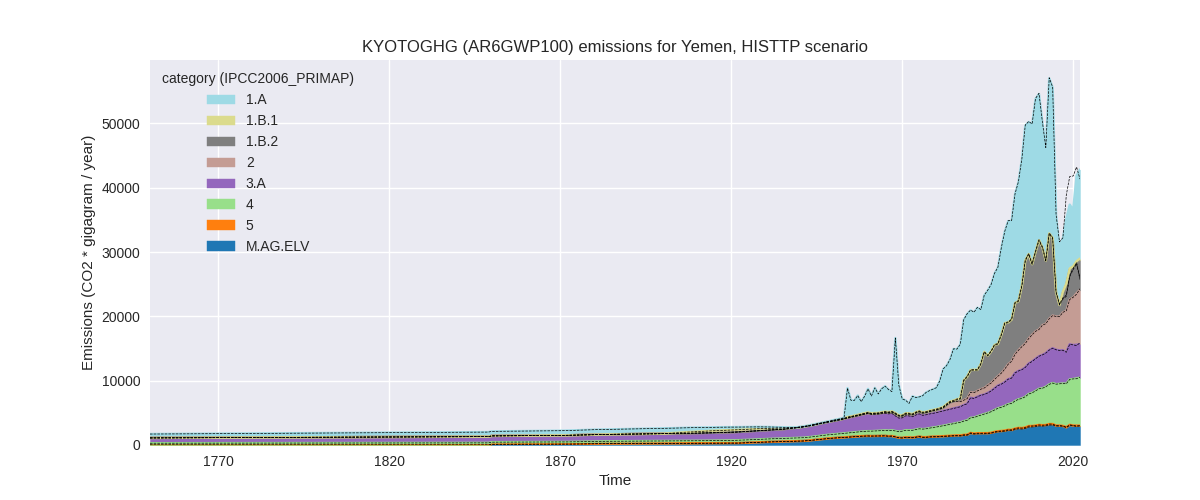
The following figures show the aggregate national total emissions excluding LULUCF AR6GWP100 for the third party priority scenario. The dotted linesshow the v2.5_final data.


Overview over changes
In the country reported priority scenario we have the following changes for aggregate Kyoto GHG and national total emissions excluding LULUCF (M.0.EL):
- Emissions in 2022 have changed by -5.5%% (-2521.91 Gg CO2 / year)
- Emissions in 1990-2022 have changed by -2.4%% (-787.50 Gg CO2 / year)
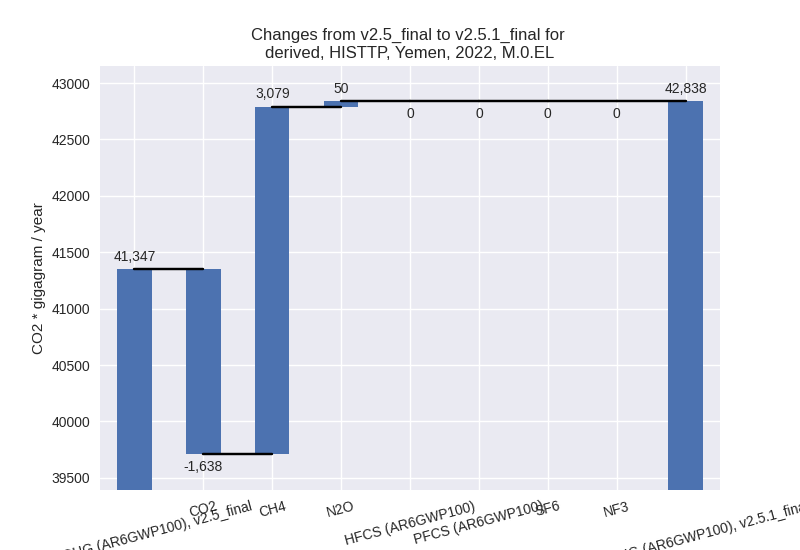
In the third party priority scenario we have the following changes for aggregate Kyoto GHG and national total emissions excluding LULUCF (M.0.EL):
- Emissions in 2022 have changed by 3.6%% (1491.26 Gg CO2 / year)
- Emissions in 1990-2022 have changed by -1.3%% (-486.53 Gg CO2 / year)
Most important changes per scenario and time frame
In the country reported priority scenario the following sector-gas combinations have the highest absolute impact on national total KyotoGHG (AR6GWP100) emissions in 2022 (top 5):
- 1: 1.A, CO2 with -2015.81 Gg CO2 / year (-10.7%)
- 2: M.AG.ELV, N2O with -695.88 Gg CO2 / year (-10.9%)
- 3: 1.B.2, CH4 with 513.87 Gg CO2 / year (295.5%)
- 4: 3.A, CH4 with -363.84 Gg CO2 / year (-5.9%)
- 5: 5, N2O with 27.88 Gg CO2 / year (61.3%)
In the country reported priority scenario the following sector-gas combinations have the highest absolute impact on national total KyotoGHG (AR6GWP100) emissions in 1990-2022 (top 5):
- 1: 1.A, CO2 with -797.47 Gg CO2 / year (-5.0%)
- 2: 1.B.2, CH4 with 41.18 Gg CO2 / year (5.1%)
- 3: M.AG.ELV, N2O with -19.82 Gg CO2 / year (-0.5%)
- 4: 3.A, CH4 with -8.93 Gg CO2 / year (-0.2%)
- 5: M.AG.ELV, CO2 with -4.38 Gg CO2 / year (-100.0%)
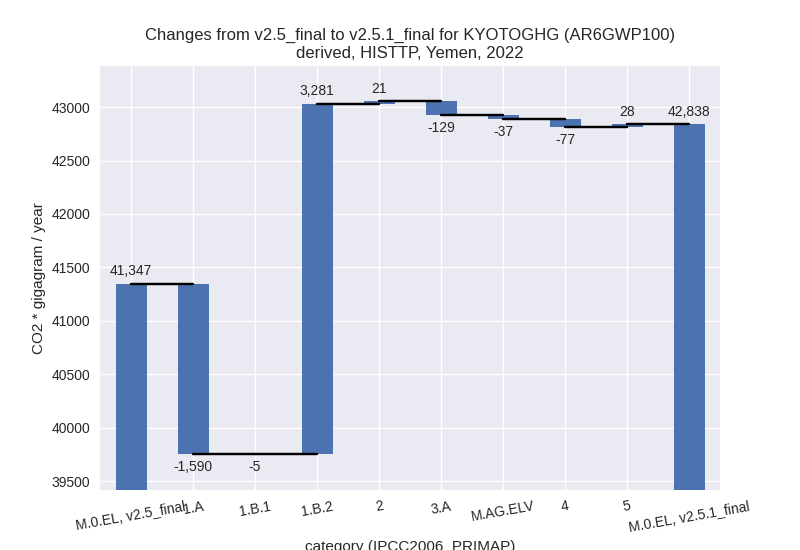
In the third party priority scenario the following sector-gas combinations have the highest absolute impact on national total KyotoGHG (AR6GWP100) emissions in 2022 (top 5):
- 1: 1.B.2, CH4 with 3278.86 Gg CO2 / year (inf%)
- 2: 1.A, CO2 with -1653.46 Gg CO2 / year (-10.7%)
- 3: 3.A, CH4 with -128.60 Gg CO2 / year (-2.4%)
- 4: 4, CH4 with -74.71 Gg CO2 / year (-1.0%)
- 5: 1.A, N2O with 56.12 Gg CO2 / year (inf%)
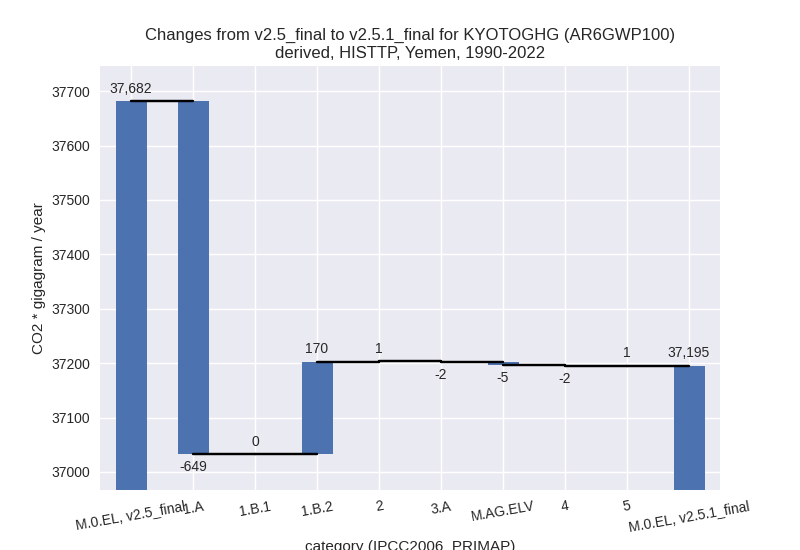
In the third party priority scenario the following sector-gas combinations have the highest absolute impact on national total KyotoGHG (AR6GWP100) emissions in 1990-2022 (top 5):
- 1: 1.A, CO2 with -650.44 Gg CO2 / year (-4.3%)
- 2: 1.B.2, CH4 with 169.60 Gg CO2 / year (2.9%)
- 3: M.AG.ELV, CO2 with -4.38 Gg CO2 / year (-100.0%)
- 4: 4, CH4 with -2.26 Gg CO2 / year (-0.0%)
- 5: 3.A, CH4 with -2.01 Gg CO2 / year (-0.0%)
Notes on data changes
Here we list notes explaining important emissions changes for the country. ’' means that the following text only applies to the TP time series, while means that it only applies to the CR scenario. Otherwise the note applies to both scenarios.
- 1.A, CO2: While EI 2023 data shows emissions bouncing back after 2017, CDIAC 2023 shows persistent low emissions levels leading to lower emissions in PRIMAP-hist v2.5.1.
- M.AG.ELV, N2O: Due to new FAO and EDGAR data emissions for 2022 are lower.
- 1.B.2, CH4: EDGAR 8.0 emissions are higher for the last years.
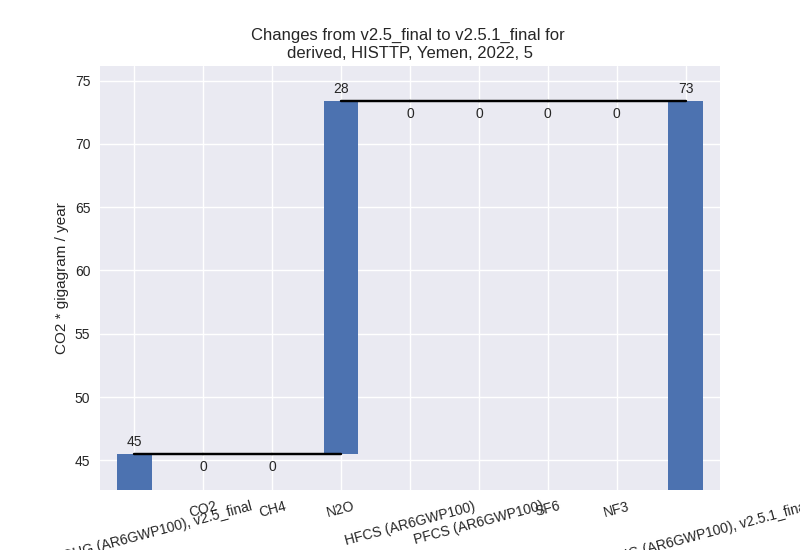
Changes by sector and gas
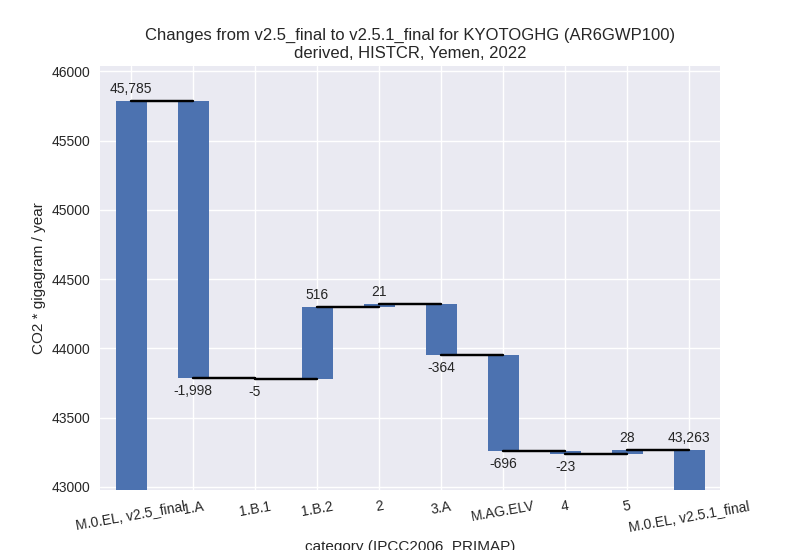
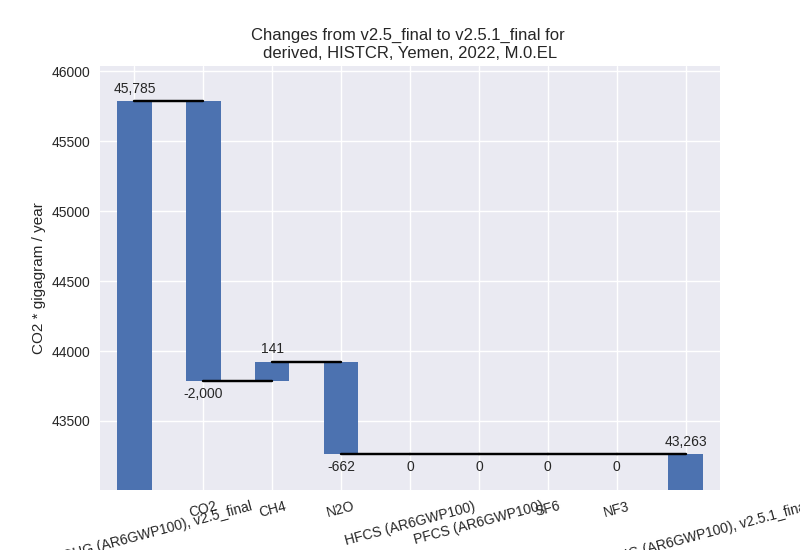
For each scenario and time frame the changes are displayed for all individual sectors and all individual gases. In the sector plot we use aggregate Kyoto GHGs in AR6GWP100. In the gas plot we usenational total emissions without LULUCF. ## country reported scenario
2022
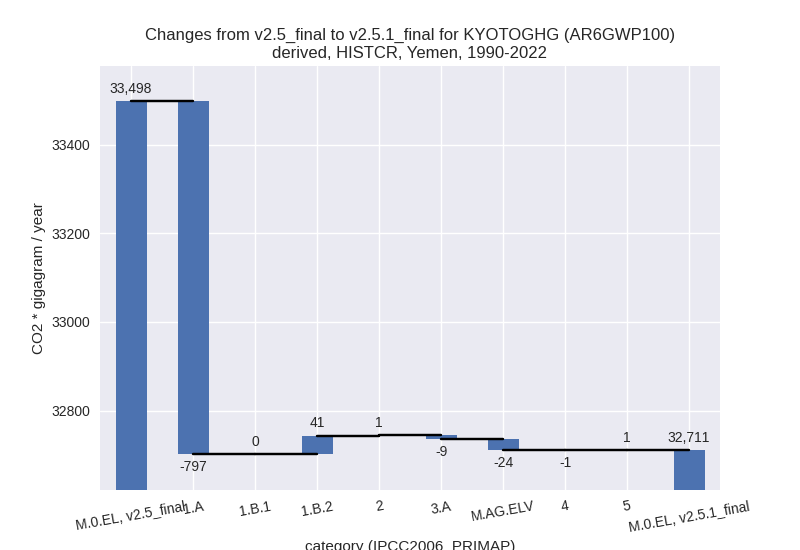
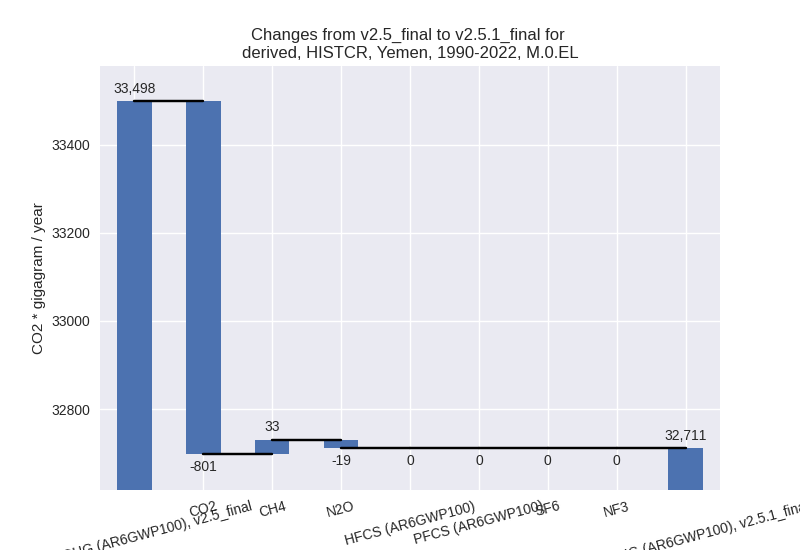
1990-2022
third party scenario
2022
1990-2022

Detailed changes for the scenarios:
country reported scenario (HISTCR):
Most important changes per time frame
For 2022 the following sector-gas combinations have the highest absolute impact on national total KyotoGHG (AR6GWP100) emissions in 2022 (top 5):
- 1: 1.A, CO2 with -2015.81 Gg CO2 / year (-10.7%)
- 2: M.AG.ELV, N2O with -695.88 Gg CO2 / year (-10.9%)
- 3: 1.B.2, CH4 with 513.87 Gg CO2 / year (295.5%)
- 4: 3.A, CH4 with -363.84 Gg CO2 / year (-5.9%)
- 5: 5, N2O with 27.88 Gg CO2 / year (61.3%)
For 1990-2022 the following sector-gas combinations have the highest absolute impact on national total KyotoGHG (AR6GWP100) emissions in 1990-2022 (top 5):
- 1: 1.A, CO2 with -797.47 Gg CO2 / year (-5.0%)
- 2: 1.B.2, CH4 with 41.18 Gg CO2 / year (5.1%)
- 3: M.AG.ELV, N2O with -19.82 Gg CO2 / year (-0.5%)
- 4: 3.A, CH4 with -8.93 Gg CO2 / year (-0.2%)
- 5: M.AG.ELV, CO2 with -4.38 Gg CO2 / year (-100.0%)
Changes in the main sectors for aggregate KyotoGHG (AR6GWP100) are
- 1: Total sectoral emissions in 2022 are 19658.04 Gg
CO2 / year which is 45.4% of M.0.EL emissions. 2022 Emissions have
changed by -7.0% (-1487.85 Gg CO2 /
year). 1990-2022 Emissions have changed by -4.1% (-755.63 Gg CO2 / year). For 2022
the changes per gas
are:

For 1990-2022 the changes per gas are: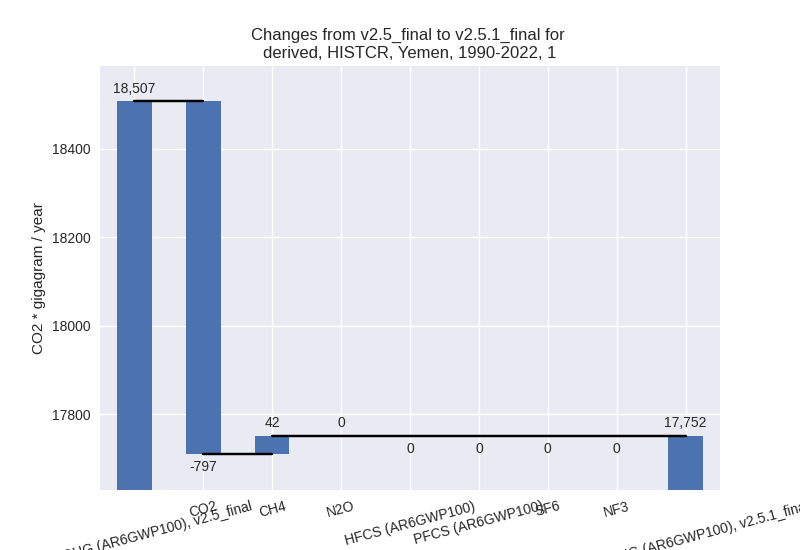
The changes come from the following subsectors:- 1.A: Total sectoral emissions in 2022 are 16901.05
Gg CO2 / year which is 86.0% of category 1 emissions. 2022 Emissions
have changed by -10.6% (-1998.31 Gg
CO2 / year). 1990-2022 Emissions have changed by -4.9% (-796.98 Gg CO2 / year). For 2022
the changes per gas
are:

For 1990-2022 the changes per gas are:
There is no subsector information available in PRIMAP-hist. - 1.B.1: Total sectoral emissions in 2022 are 194.65
Gg CO2 / year which is 1.0% of category 1 emissions. 2022 Emissions have
changed by -2.7% (-5.46 Gg CO2 /
year). 1990-2022 Emissions have changed by 0.1% (0.10 Gg CO2 / year). For 2022 the
changes per gas
are:

There is no subsector information available in PRIMAP-hist. - 1.B.2: Total sectoral emissions in 2022 are 2562.33
Gg CO2 / year which is 13.0% of category 1 emissions. 2022 Emissions
have changed by 25.2% (515.92 Gg CO2
/ year). 1990-2022 Emissions have changed by 1.9% (41.25 Gg CO2 / year). For 2022 the
changes per gas
are:

There is no subsector information available in PRIMAP-hist.
- 1.A: Total sectoral emissions in 2022 are 16901.05
Gg CO2 / year which is 86.0% of category 1 emissions. 2022 Emissions
have changed by -10.6% (-1998.31 Gg
CO2 / year). 1990-2022 Emissions have changed by -4.9% (-796.98 Gg CO2 / year). For 2022
the changes per gas
are:
- 2: Total sectoral emissions in 2022 are 8717.50 Gg CO2 / year which is 20.2% of M.0.EL emissions. 2022 Emissions have changed by 0.2% (21.12 Gg CO2 / year). 1990-2022 Emissions have changed by 0.0% (0.90 Gg CO2 / year).
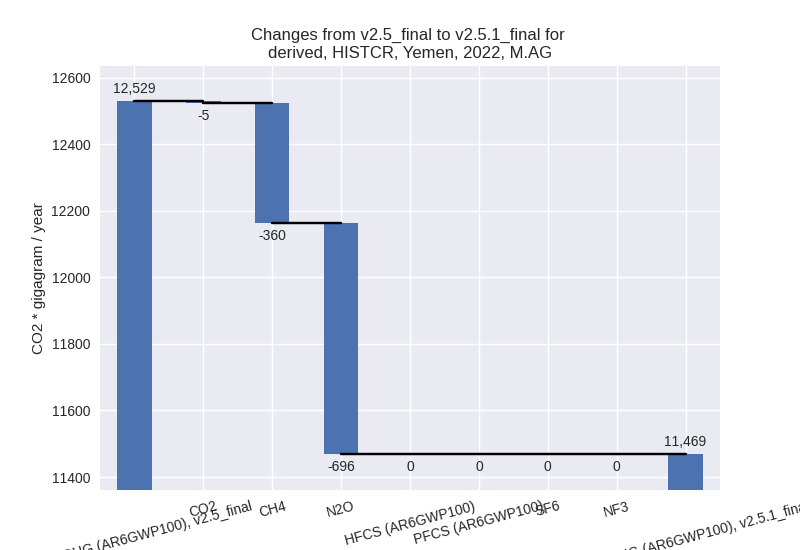
- M.AG: Total sectoral emissions in 2022 are 11468.66
Gg CO2 / year which is 26.5% of M.0.EL emissions. 2022 Emissions have
changed by -8.5% (-1060.18 Gg CO2 /
year). 1990-2022 Emissions have changed by -0.4% (-32.91 Gg CO2 / year). For 2022 the
changes per gas
are:
The changes come from the following subsectors:- 3.A: Total sectoral emissions in 2022 are 5792.94
Gg CO2 / year which is 50.5% of category M.AG emissions. 2022 Emissions
have changed by -5.9% (-363.71 Gg
CO2 / year). 1990-2022 Emissions have changed by -0.2% (-8.89 Gg CO2 / year). For 2022 the
changes per gas
are:

There is no subsector information available in PRIMAP-hist. - M.AG.ELV: Total sectoral emissions in 2022 are
5675.72 Gg CO2 / year which is 49.5% of category M.AG emissions. 2022
Emissions have changed by -10.9%
(-696.47 Gg CO2 / year). 1990-2022 Emissions have changed by -0.5% (-24.03 Gg CO2 / year). For 2022 the
changes per gas
are:

There is no subsector information available in PRIMAP-hist.
- 3.A: Total sectoral emissions in 2022 are 5792.94
Gg CO2 / year which is 50.5% of category M.AG emissions. 2022 Emissions
have changed by -5.9% (-363.71 Gg
CO2 / year). 1990-2022 Emissions have changed by -0.2% (-8.89 Gg CO2 / year). For 2022 the
changes per gas
are:
- 4: Total sectoral emissions in 2022 are 3345.11 Gg CO2 / year which is 7.7% of M.0.EL emissions. 2022 Emissions have changed by -0.7% (-22.89 Gg CO2 / year). 1990-2022 Emissions have changed by -0.0% (-0.69 Gg CO2 / year).
- 5: Total sectoral emissions in 2022 are 73.37 Gg
CO2 / year which is 0.2% of M.0.EL emissions. 2022 Emissions have
changed by 61.3% (27.88 Gg CO2 /
year). 1990-2022 Emissions have changed by 0.8% (0.84 Gg CO2 / year). For 2022 the
changes per gas
are:

third party scenario (HISTTP):
Most important changes per time frame
For 2022 the following sector-gas combinations have the highest absolute impact on national total KyotoGHG (AR6GWP100) emissions in 2022 (top 5):
- 1: 1.B.2, CH4 with 3278.86 Gg CO2 / year (inf%)
- 2: 1.A, CO2 with -1653.46 Gg CO2 / year (-10.7%)
- 3: 3.A, CH4 with -128.60 Gg CO2 / year (-2.4%)
- 4: 4, CH4 with -74.71 Gg CO2 / year (-1.0%)
- 5: 1.A, N2O with 56.12 Gg CO2 / year (inf%)
For 1990-2022 the following sector-gas combinations have the highest absolute impact on national total KyotoGHG (AR6GWP100) emissions in 1990-2022 (top 5):
- 1: 1.A, CO2 with -650.44 Gg CO2 / year (-4.3%)
- 2: 1.B.2, CH4 with 169.60 Gg CO2 / year (2.9%)
- 3: M.AG.ELV, CO2 with -4.38 Gg CO2 / year (-100.0%)
- 4: 4, CH4 with -2.26 Gg CO2 / year (-0.0%)
- 5: 3.A, CH4 with -2.01 Gg CO2 / year (-0.0%)
Changes in the main sectors for aggregate KyotoGHG (AR6GWP100) are
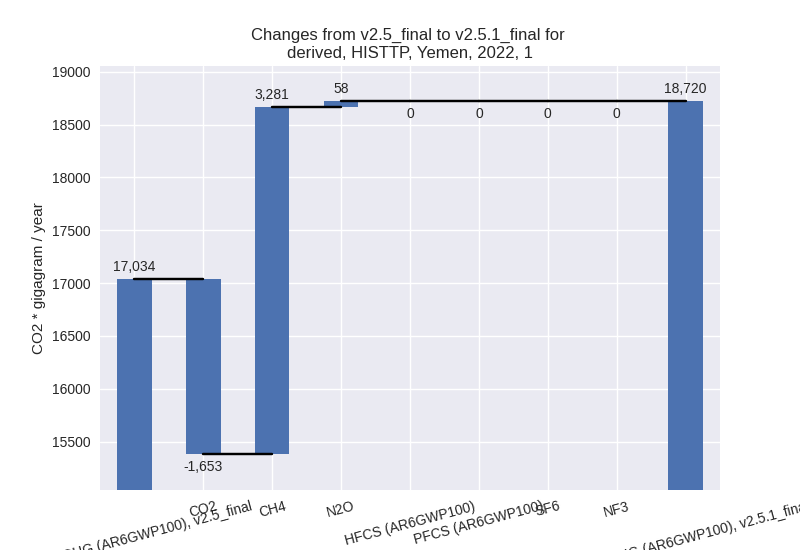
- 1: Total sectoral emissions in 2022 are 18719.96 Gg
CO2 / year which is 43.7% of M.0.EL emissions. 2022 Emissions have
changed by 9.9% (1685.84 Gg CO2 /
year). 1990-2022 Emissions have changed by -2.2% (-479.26 Gg CO2 / year). For 2022
the changes per gas
are:
For 1990-2022 the changes per gas are: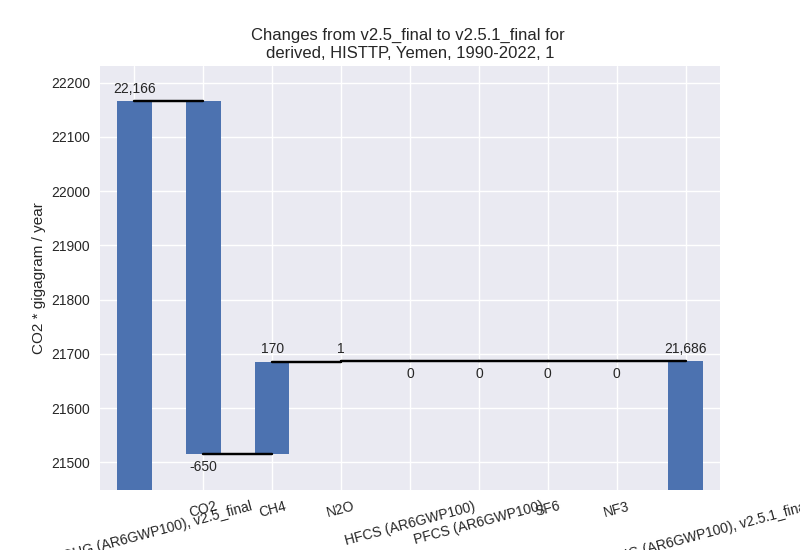
The changes come from the following subsectors:- 1.A: Total sectoral emissions in 2022 are 13840.76
Gg CO2 / year which is 73.9% of category 1 emissions. 2022 Emissions
have changed by -10.3% (-1589.62 Gg
CO2 / year). 1990-2022 Emissions have changed by -4.3% (-649.02 Gg CO2 / year). For 2022
the changes per gas
are:

For 1990-2022 the changes per gas are: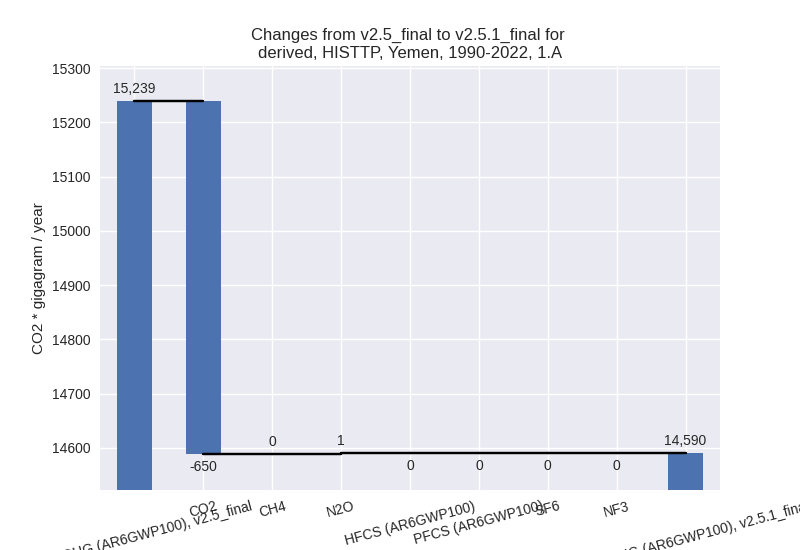
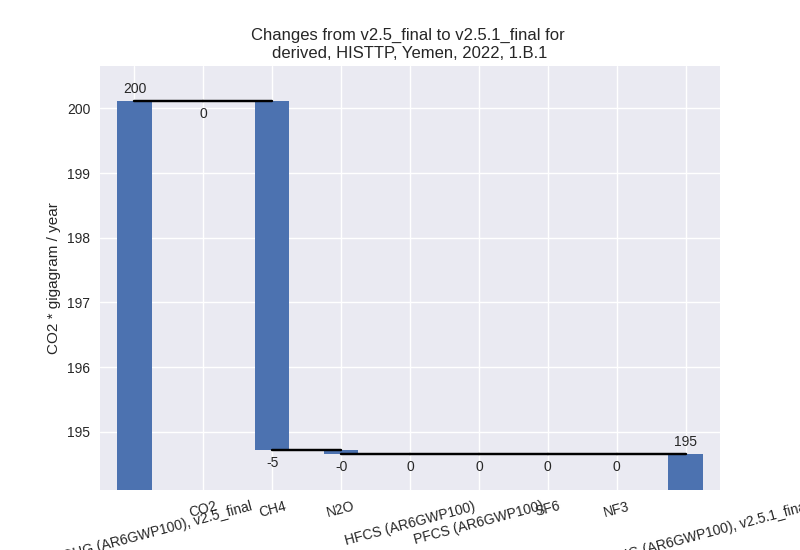
There is no subsector information available in PRIMAP-hist. - 1.B.1: Total sectoral emissions in 2022 are 194.65
Gg CO2 / year which is 1.0% of category 1 emissions. 2022 Emissions have
changed by -2.7% (-5.46 Gg CO2 /
year). 1990-2022 Emissions have changed by 0.1% (0.10 Gg CO2 / year). For 2022 the
changes per gas
are:
There is no subsector information available in PRIMAP-hist. - 1.B.2: Total sectoral emissions in 2022 are 4684.54
Gg CO2 / year which is 25.0% of category 1 emissions. 2022 Emissions
have changed by 233.7% (3280.91 Gg
CO2 / year). 1990-2022 Emissions have changed by 2.5% (169.67 Gg CO2 / year). For 2022 the
changes per gas
are:

For 1990-2022 the changes per gas are:
There is no subsector information available in PRIMAP-hist.
- 1.A: Total sectoral emissions in 2022 are 13840.76
Gg CO2 / year which is 73.9% of category 1 emissions. 2022 Emissions
have changed by -10.3% (-1589.62 Gg
CO2 / year). 1990-2022 Emissions have changed by -4.3% (-649.02 Gg CO2 / year). For 2022
the changes per gas
are:
- 2: Total sectoral emissions in 2022 are 8430.46 Gg CO2 / year which is 19.7% of M.0.EL emissions. 2022 Emissions have changed by 0.3% (21.12 Gg CO2 / year). 1990-2022 Emissions have changed by 0.0% (0.90 Gg CO2 / year).
- M.AG: Total sectoral emissions in 2022 are 8156.30 Gg CO2 / year which is 19.0% of M.0.EL emissions. 2022 Emissions have changed by -2.0% (-166.09 Gg CO2 / year). 1990-2022 Emissions have changed by -0.1% (-6.67 Gg CO2 / year).
- 4: Total sectoral emissions in 2022 are 7458.37 Gg CO2 / year which is 17.4% of M.0.EL emissions. 2022 Emissions have changed by -1.0% (-77.49 Gg CO2 / year). 1990-2022 Emissions have changed by -0.0% (-2.35 Gg CO2 / year).
- 5: Total sectoral emissions in 2022 are 73.37 Gg
CO2 / year which is 0.2% of M.0.EL emissions. 2022 Emissions have
changed by 61.3% (27.88 Gg CO2 /
year). 1990-2022 Emissions have changed by 0.8% (0.84 Gg CO2 / year). For 2022 the
changes per gas
are: