Changes in PRIMAP-hist v2.5.1_final compared to v2.5_final for South Africa
2024-02-29
Johannes Gütschow
Change analysis for South Africa for PRIMAP-hist v2.5.1_final compared to v2.5_final
Overview over emissions by sector and gas
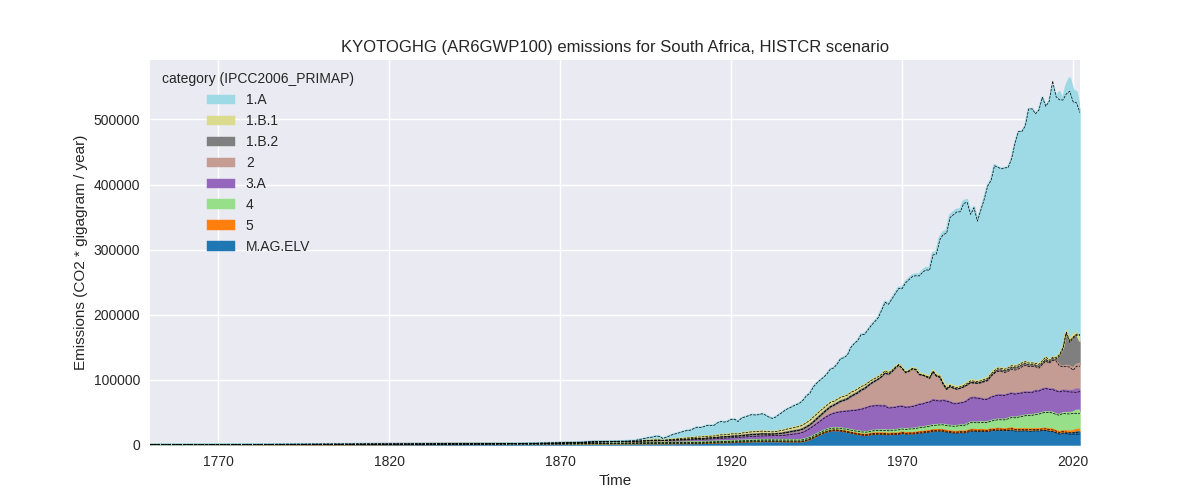
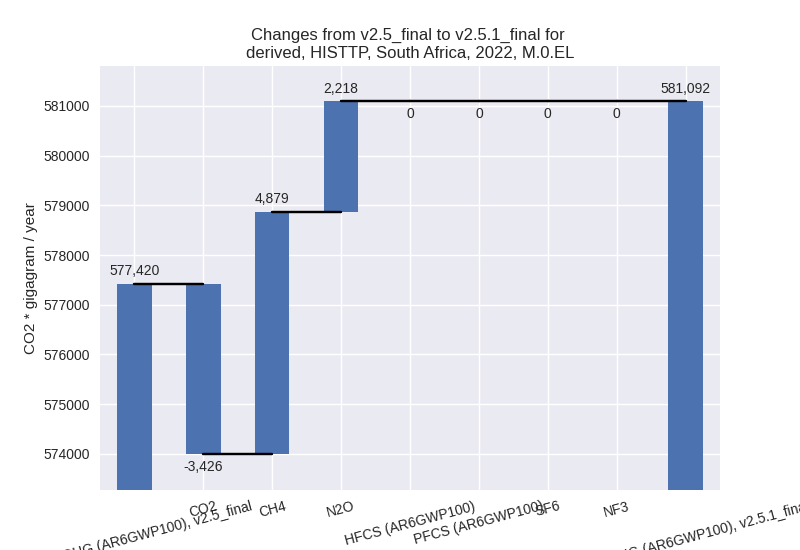
The following figures show the aggregate national total emissions excluding LULUCF AR6GWP100 for the country reported priority scenario. The dotted linesshow the v2.5_final data.

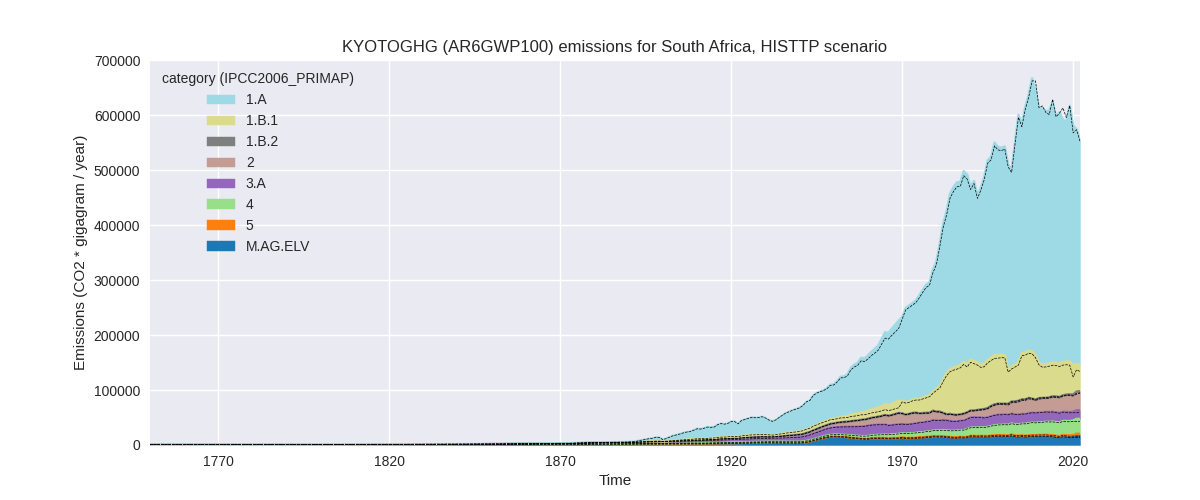
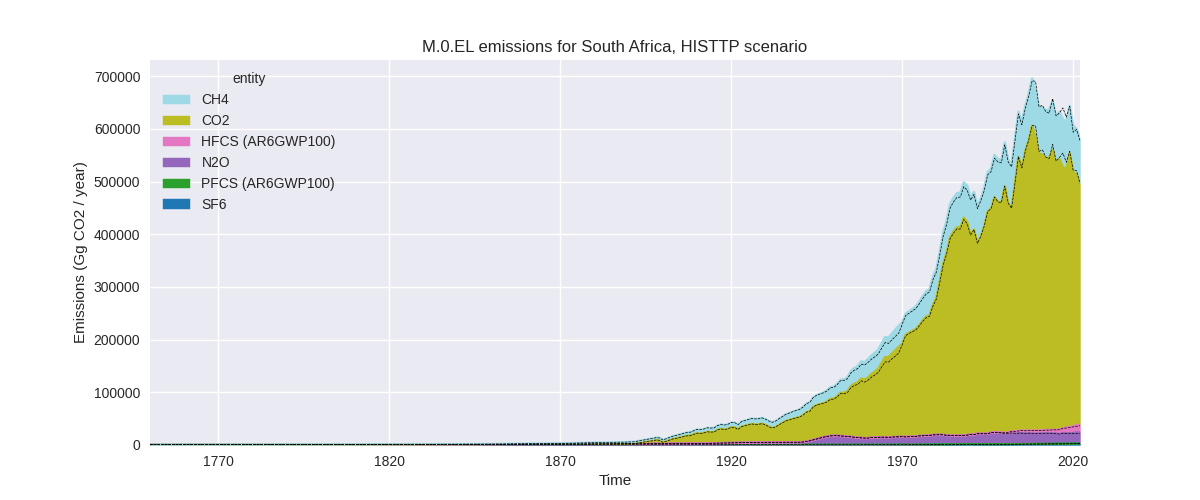
The following figures show the aggregate national total emissions excluding LULUCF AR6GWP100 for the third party priority scenario. The dotted linesshow the v2.5_final data.

Overview over changes
In the country reported priority scenario we have the following changes for aggregate Kyoto GHG and national total emissions excluding LULUCF (M.0.EL):
- Emissions in 2022 have changed by 0.8%% (4456.69 Gg CO2 / year)
- Emissions in 1990-2022 have changed by 0.5%% (2381.33 Gg CO2 / year)
In the third party priority scenario we have the following changes for aggregate Kyoto GHG and national total emissions excluding LULUCF (M.0.EL):
- Emissions in 2022 have changed by 0.6%% (3671.50 Gg CO2 / year)
- Emissions in 1990-2022 have changed by 0.3%% (1941.15 Gg CO2 / year)
Most important changes per scenario and time frame
In the country reported priority scenario the following sector-gas combinations have the highest absolute impact on national total KyotoGHG (AR6GWP100) emissions in 2022 (top 5):
- 1: 1.A, CO2 with 14358.26 Gg CO2 / year (4.3%)
- 2: 1.B.2, CO2 with -12704.41 Gg CO2 / year (-27.6%)
- 3: M.AG.ELV, N2O with 3768.44 Gg CO2 / year (24.8%)
- 4: 3.A, CH4 with -1210.94 Gg CO2 / year (-3.8%)
- 5: M.AG.ELV, CH4 with 663.00 Gg CO2 / year (250.2%)
In the country reported priority scenario the following sector-gas combinations have the highest absolute impact on national total KyotoGHG (AR6GWP100) emissions in 1990-2022 (top 5):
- 1: 1.A, CO2 with 2384.03 Gg CO2 / year (0.7%)
- 2: 1.B.2, CO2 with -371.05 Gg CO2 / year (-4.3%)
- 3: M.AG.ELV, N2O with 333.11 Gg CO2 / year (1.8%)
- 4: 1.B.2, CH4 with -101.35 Gg CO2 / year (-7.0%)
- 5: 2, CO2 with 97.21 Gg CO2 / year (0.3%)
In the third party priority scenario the following sector-gas combinations have the highest absolute impact on national total KyotoGHG (AR6GWP100) emissions in 2022 (top 5):
- 1: 1.A, CO2 with -7679.62 Gg CO2 / year (-1.9%)
- 2: 1.B.1, CH4 with 5531.51 Gg CO2 / year (18.4%)
- 3: 1.B.1, CO2 with 4057.31 Gg CO2 / year (46.8%)
- 4: M.AG.ELV, N2O with 2593.20 Gg CO2 / year (21.6%)
- 5: M.AG.ELV, CH4 with 1329.19 Gg CO2 / year (134.1%)
In the third party priority scenario the following sector-gas combinations have the highest absolute impact on national total KyotoGHG (AR6GWP100) emissions in 1990-2022 (top 5):
- 1: 1.B.1, CH4 with 5667.45 Gg CO2 / year (17.6%)
- 2: 1.A, CO2 with -3745.76 Gg CO2 / year (-0.9%)
- 3: M.AG.ELV, N2O with 228.26 Gg CO2 / year (1.7%)
- 4: 1.A, CH4 with -169.98 Gg CO2 / year (-5.1%)
- 5: 2, CO2 with -163.41 Gg CO2 / year (-1.1%)
Notes on data changes
No country specific notes present for this changelog.
Changes by sector and gas
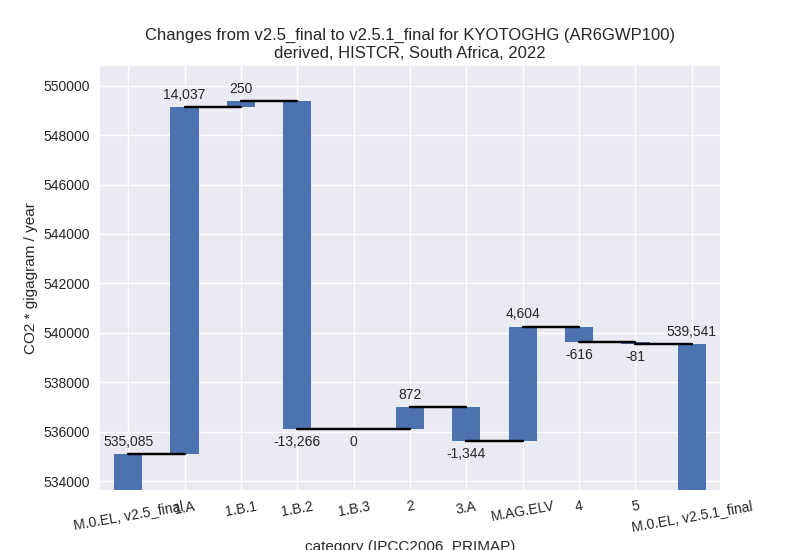
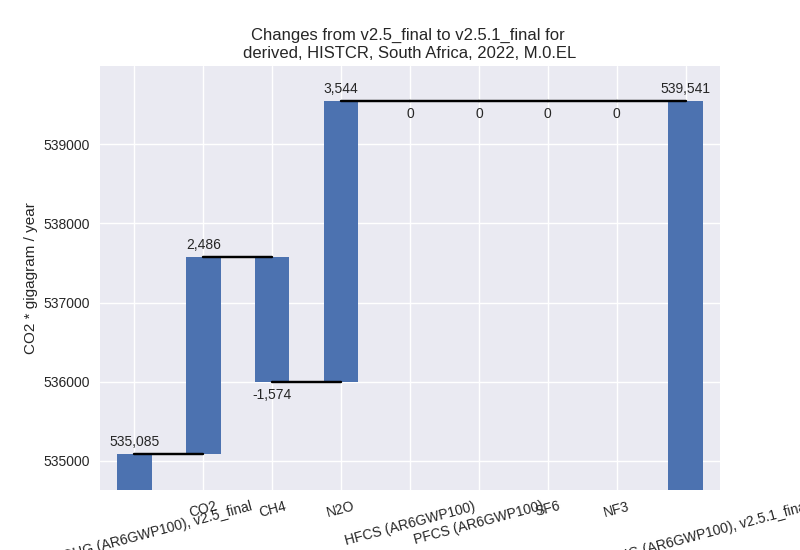
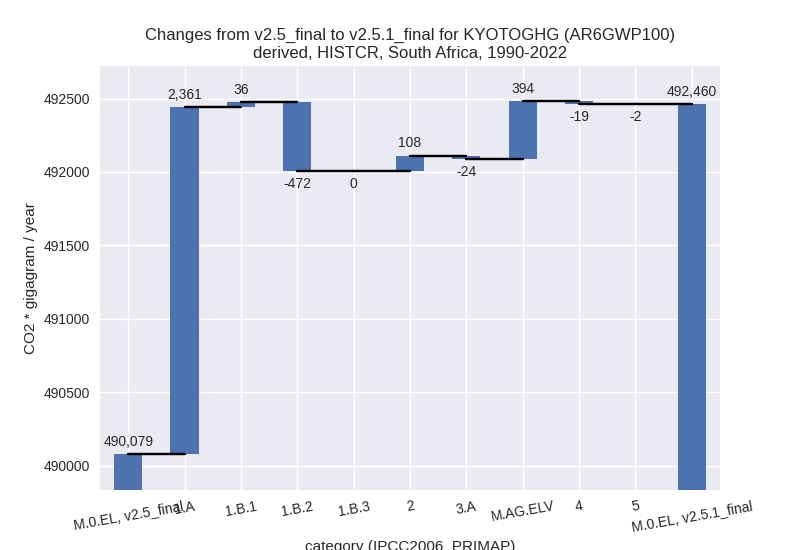
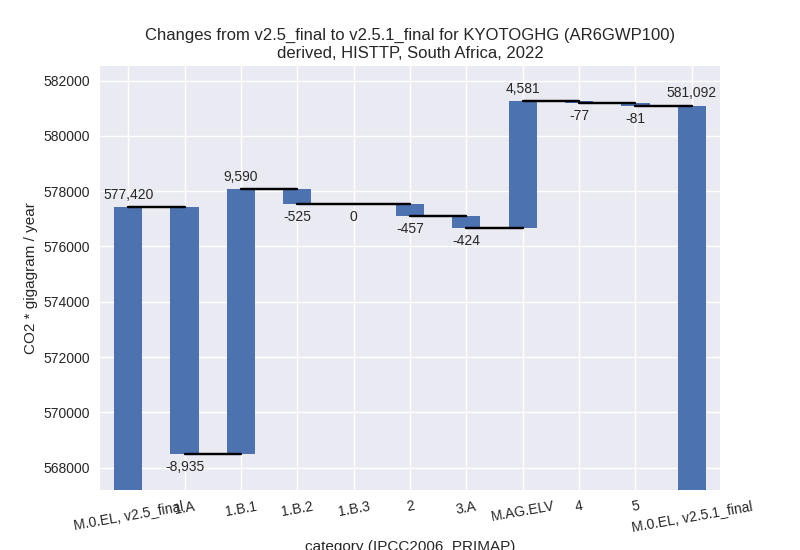
For each scenario and time frame the changes are displayed for all individual sectors and all individual gases. In the sector plot we use aggregate Kyoto GHGs in AR6GWP100. In the gas plot we usenational total emissions without LULUCF. ## country reported scenario
2022
1990-2022

third party scenario
2022
1990-2022


Detailed changes for the scenarios:
country reported scenario (HISTCR):
Most important changes per time frame
For 2022 the following sector-gas combinations have the highest absolute impact on national total KyotoGHG (AR6GWP100) emissions in 2022 (top 5):
- 1: 1.A, CO2 with 14358.26 Gg CO2 / year (4.3%)
- 2: 1.B.2, CO2 with -12704.41 Gg CO2 / year (-27.6%)
- 3: M.AG.ELV, N2O with 3768.44 Gg CO2 / year (24.8%)
- 4: 3.A, CH4 with -1210.94 Gg CO2 / year (-3.8%)
- 5: M.AG.ELV, CH4 with 663.00 Gg CO2 / year (250.2%)
For 1990-2022 the following sector-gas combinations have the highest absolute impact on national total KyotoGHG (AR6GWP100) emissions in 1990-2022 (top 5):
- 1: 1.A, CO2 with 2384.03 Gg CO2 / year (0.7%)
- 2: 1.B.2, CO2 with -371.05 Gg CO2 / year (-4.3%)
- 3: M.AG.ELV, N2O with 333.11 Gg CO2 / year (1.8%)
- 4: 1.B.2, CH4 with -101.35 Gg CO2 / year (-7.0%)
- 5: 2, CO2 with 97.21 Gg CO2 / year (0.3%)
Changes in the main sectors for aggregate KyotoGHG (AR6GWP100) are
- 1: Total sectoral emissions in 2022 are 415036.08 Gg CO2 / year which is 76.9% of M.0.EL emissions. 2022 Emissions have changed by 0.2% (1021.14 Gg CO2 / year). 1990-2022 Emissions have changed by 0.5% (1925.04 Gg CO2 / year).
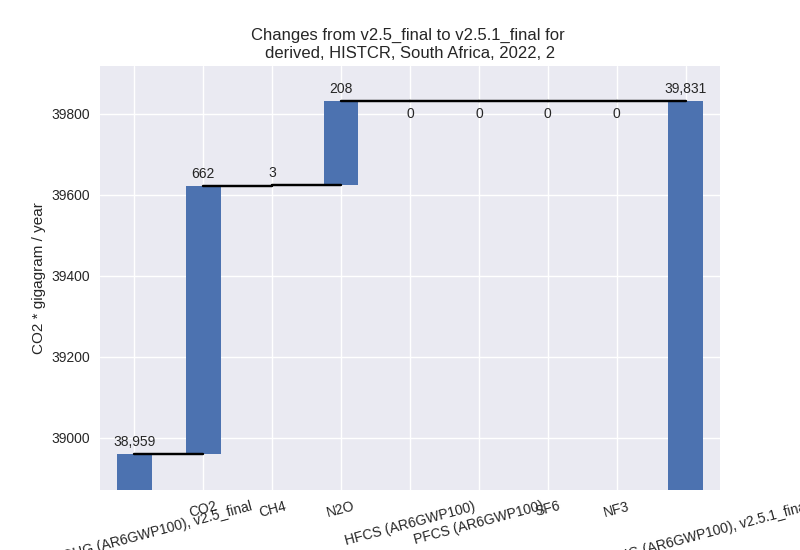
- 2: Total sectoral emissions in 2022 are 39831.10 Gg
CO2 / year which is 7.4% of M.0.EL emissions. 2022 Emissions have
changed by 2.2% (871.82 Gg CO2 /
year). 1990-2022 Emissions have changed by 0.3% (107.55 Gg CO2 / year). For 2022 the
changes per gas
are:
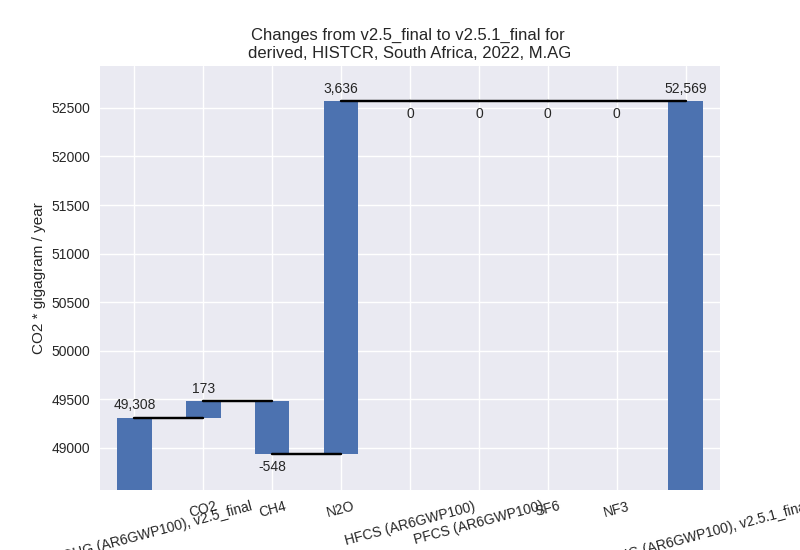
- M.AG: Total sectoral emissions in 2022 are 52568.64
Gg CO2 / year which is 9.7% of M.0.EL emissions. 2022 Emissions have
changed by 6.6% (3260.17 Gg CO2 /
year). 1990-2022 Emissions have changed by 0.7% (369.85 Gg CO2 / year). For 2022 the
changes per gas
are:
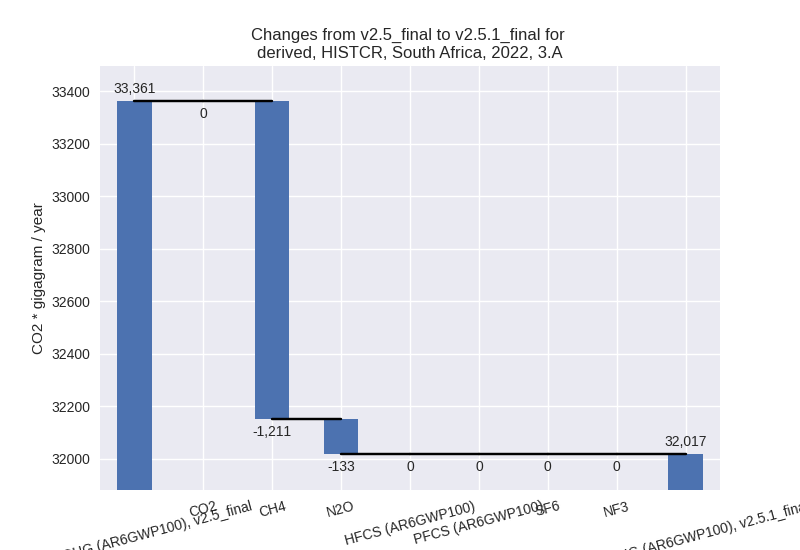
The changes come from the following subsectors:- 3.A: Total sectoral emissions in 2022 are 32017.48
Gg CO2 / year which is 60.9% of category M.AG emissions. 2022 Emissions
have changed by -4.0% (-1343.84 Gg
CO2 / year). 1990-2022 Emissions have changed by -0.1% (-24.05 Gg CO2 / year). For 2022 the
changes per gas
are:
There is no subsector information available in PRIMAP-hist. - M.AG.ELV: Total sectoral emissions in 2022 are
20551.16 Gg CO2 / year which is 39.1% of category M.AG emissions. 2022
Emissions have changed by 28.9%
(4604.01 Gg CO2 / year). 1990-2022 Emissions have changed by 1.9% (393.90 Gg CO2 / year). For 2022 the
changes per gas
are:

There is no subsector information available in PRIMAP-hist.
- 3.A: Total sectoral emissions in 2022 are 32017.48
Gg CO2 / year which is 60.9% of category M.AG emissions. 2022 Emissions
have changed by -4.0% (-1343.84 Gg
CO2 / year). 1990-2022 Emissions have changed by -0.1% (-24.05 Gg CO2 / year). For 2022 the
changes per gas
are:
- 4: Total sectoral emissions in 2022 are 29652.13 Gg
CO2 / year which is 5.5% of M.0.EL emissions. 2022 Emissions have
changed by -2.0% (-615.61 Gg CO2 /
year). 1990-2022 Emissions have changed by -0.1% (-18.65 Gg CO2 / year). For 2022 the
changes per gas
are:

- 5: Total sectoral emissions in 2022 are 2453.44 Gg
CO2 / year which is 0.5% of M.0.EL emissions. 2022 Emissions have
changed by -3.2% (-80.81 Gg CO2 /
year). 1990-2022 Emissions have changed by -0.1% (-2.45 Gg CO2 / year). For 2022 the
changes per gas
are:

third party scenario (HISTTP):
Most important changes per time frame
For 2022 the following sector-gas combinations have the highest absolute impact on national total KyotoGHG (AR6GWP100) emissions in 2022 (top 5):
- 1: 1.A, CO2 with -7679.62 Gg CO2 / year (-1.9%)
- 2: 1.B.1, CH4 with 5531.51 Gg CO2 / year (18.4%)
- 3: 1.B.1, CO2 with 4057.31 Gg CO2 / year (46.8%)
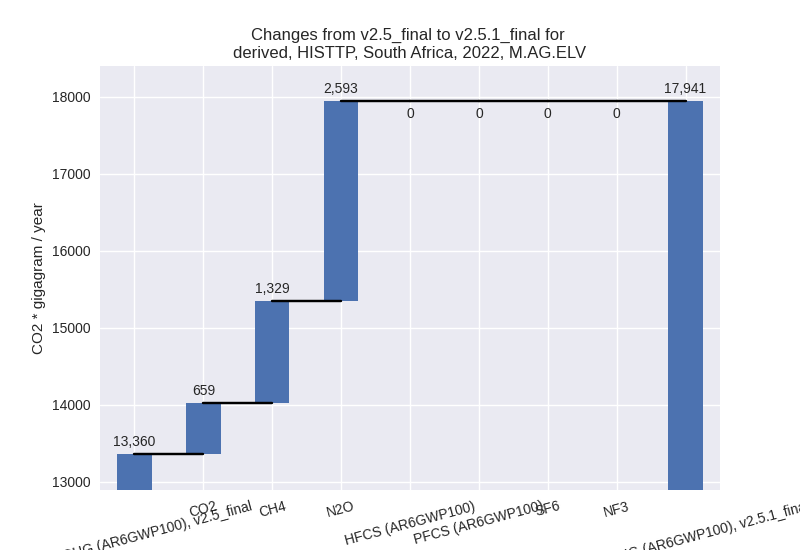
- 4: M.AG.ELV, N2O with 2593.20 Gg CO2 / year (21.6%)
- 5: M.AG.ELV, CH4 with 1329.19 Gg CO2 / year (134.1%)
For 1990-2022 the following sector-gas combinations have the highest absolute impact on national total KyotoGHG (AR6GWP100) emissions in 1990-2022 (top 5):
- 1: 1.B.1, CH4 with 5667.45 Gg CO2 / year (17.6%)
- 2: 1.A, CO2 with -3745.76 Gg CO2 / year (-0.9%)
- 3: M.AG.ELV, N2O with 228.26 Gg CO2 / year (1.7%)
- 4: 1.A, CH4 with -169.98 Gg CO2 / year (-5.1%)
- 5: 2, CO2 with -163.41 Gg CO2 / year (-1.1%)
Changes in the main sectors for aggregate KyotoGHG (AR6GWP100) are
- 1: Total sectoral emissions in 2022 are 483725.15 Gg CO2 / year which is 83.2% of M.0.EL emissions. 2022 Emissions have changed by 0.0% (129.63 Gg CO2 / year). 1990-2022 Emissions have changed by 0.3% (1641.60 Gg CO2 / year).
- 2: Total sectoral emissions in 2022 are 34325.02 Gg CO2 / year which is 5.9% of M.0.EL emissions. 2022 Emissions have changed by -1.3% (-457.15 Gg CO2 / year). 1990-2022 Emissions have changed by -0.7% (-160.34 Gg CO2 / year).
- M.AG: Total sectoral emissions in 2022 are 33432.03
Gg CO2 / year which is 5.8% of M.0.EL emissions. 2022 Emissions have
changed by 14.2% (4156.92 Gg CO2 /
year). 1990-2022 Emissions have changed by 1.4% (464.68 Gg CO2 / year). For 2022 the
changes per gas
are:
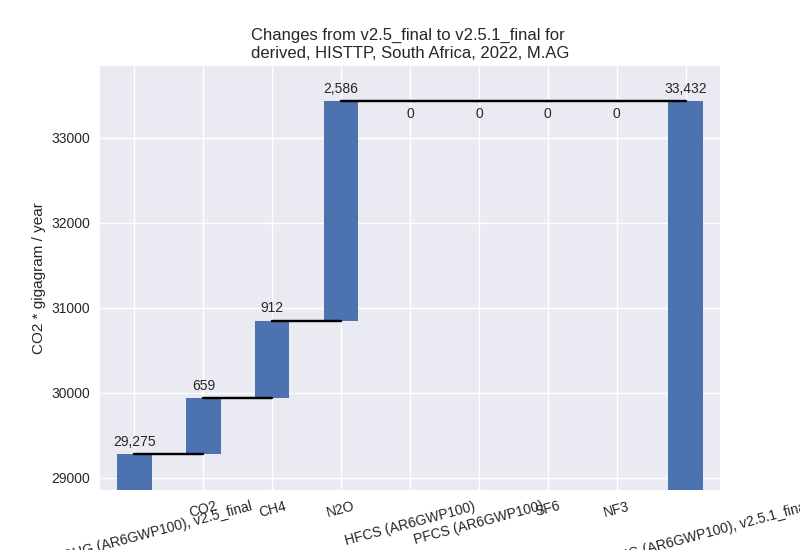
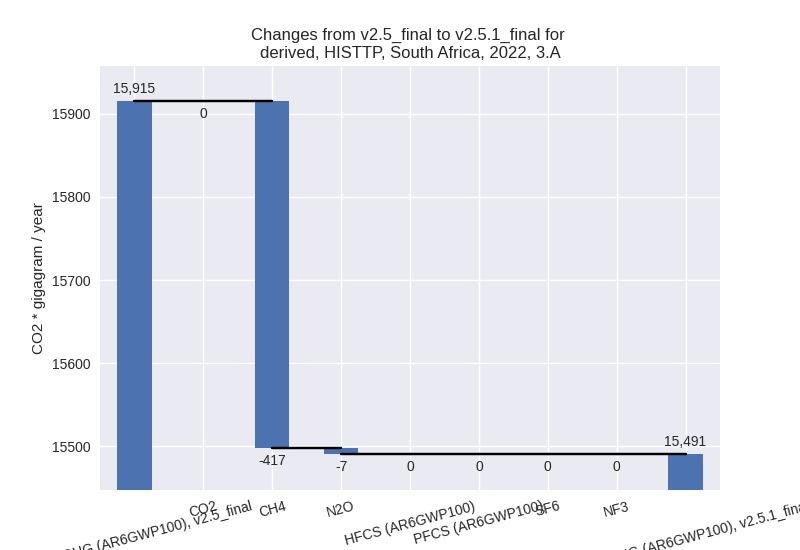
The changes come from the following subsectors:- 3.A: Total sectoral emissions in 2022 are 15490.66
Gg CO2 / year which is 46.3% of category M.AG emissions. 2022 Emissions
have changed by -2.7% (-424.39 Gg
CO2 / year). 1990-2022 Emissions have changed by -0.0% (-6.21 Gg CO2 / year). For 2022 the
changes per gas
are:
There is no subsector information available in PRIMAP-hist. - M.AG.ELV: Total sectoral emissions in 2022 are
17941.38 Gg CO2 / year which is 53.7% of category M.AG emissions. 2022
Emissions have changed by 34.3%
(4581.31 Gg CO2 / year). 1990-2022 Emissions have changed by 3.1% (470.88 Gg CO2 / year). For 2022 the
changes per gas
are:
For 1990-2022 the changes per gas are: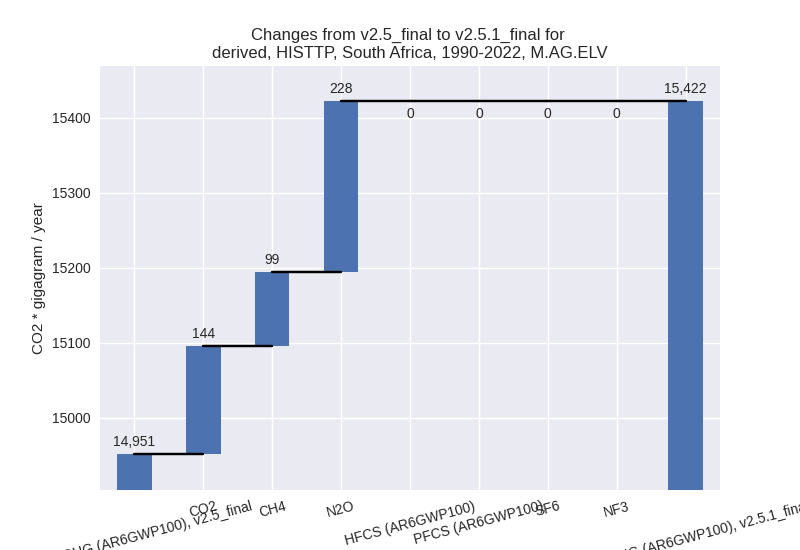
There is no subsector information available in PRIMAP-hist.
- 3.A: Total sectoral emissions in 2022 are 15490.66
Gg CO2 / year which is 46.3% of category M.AG emissions. 2022 Emissions
have changed by -2.7% (-424.39 Gg
CO2 / year). 1990-2022 Emissions have changed by -0.0% (-6.21 Gg CO2 / year). For 2022 the
changes per gas
are:
- 4: Total sectoral emissions in 2022 are 27156.20 Gg CO2 / year which is 4.7% of M.0.EL emissions. 2022 Emissions have changed by -0.3% (-77.08 Gg CO2 / year). 1990-2022 Emissions have changed by -0.0% (-2.34 Gg CO2 / year).
- 5: Total sectoral emissions in 2022 are 2453.44 Gg
CO2 / year which is 0.4% of M.0.EL emissions. 2022 Emissions have
changed by -3.2% (-80.81 Gg CO2 /
year). 1990-2022 Emissions have changed by -0.1% (-2.45 Gg CO2 / year). For 2022 the
changes per gas
are:
