Changes in PRIMAP-hist v2.5.1_final compared to v2.5_final for Zimbabwe
2024-02-29
Johannes Gütschow
Change analysis for Zimbabwe for PRIMAP-hist v2.5.1_final compared to v2.5_final
Overview over emissions by sector and gas
The following figures show the aggregate national total emissions excluding LULUCF AR6GWP100 for the country reported priority scenario. The dotted linesshow the v2.5_final data.
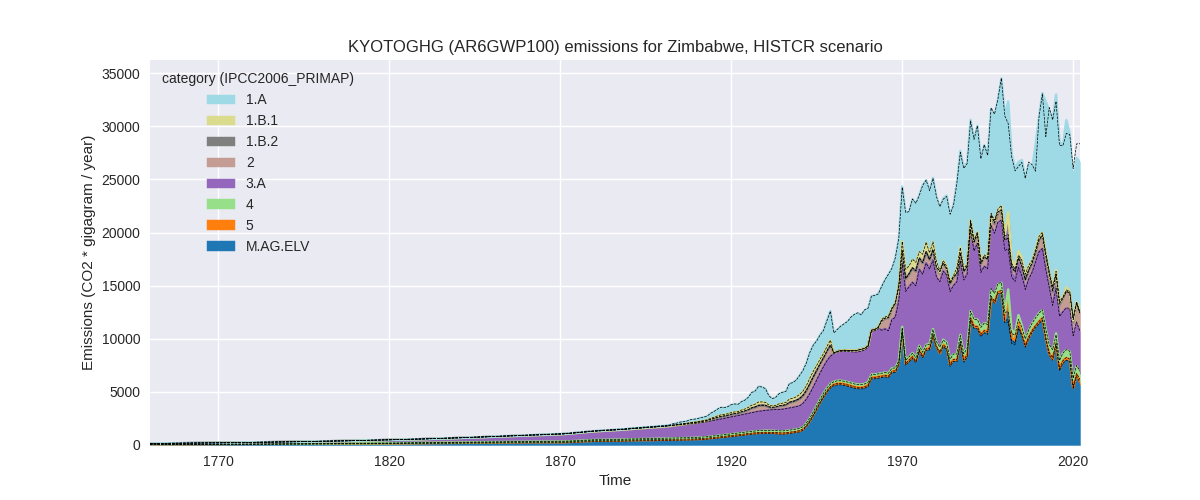
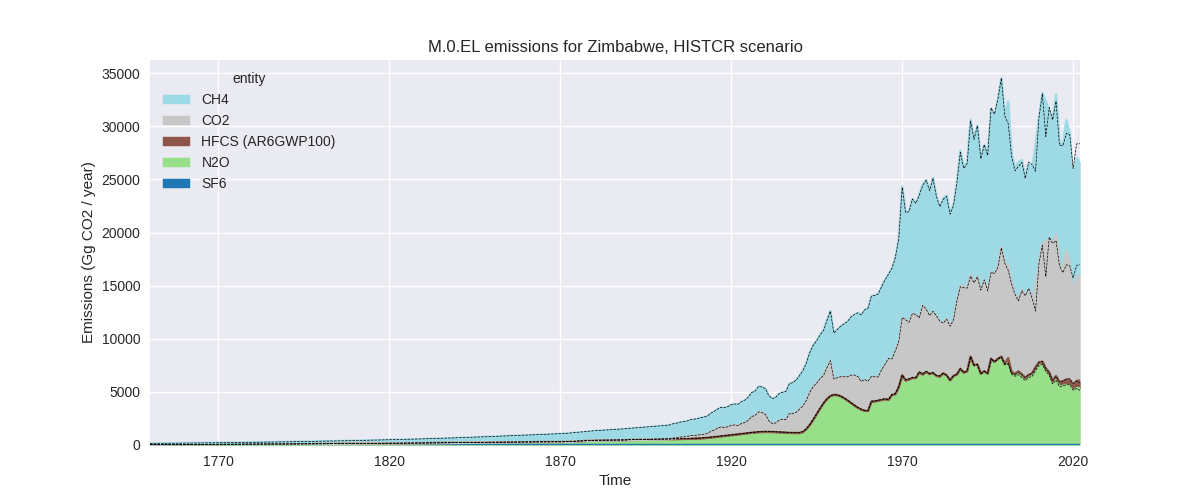
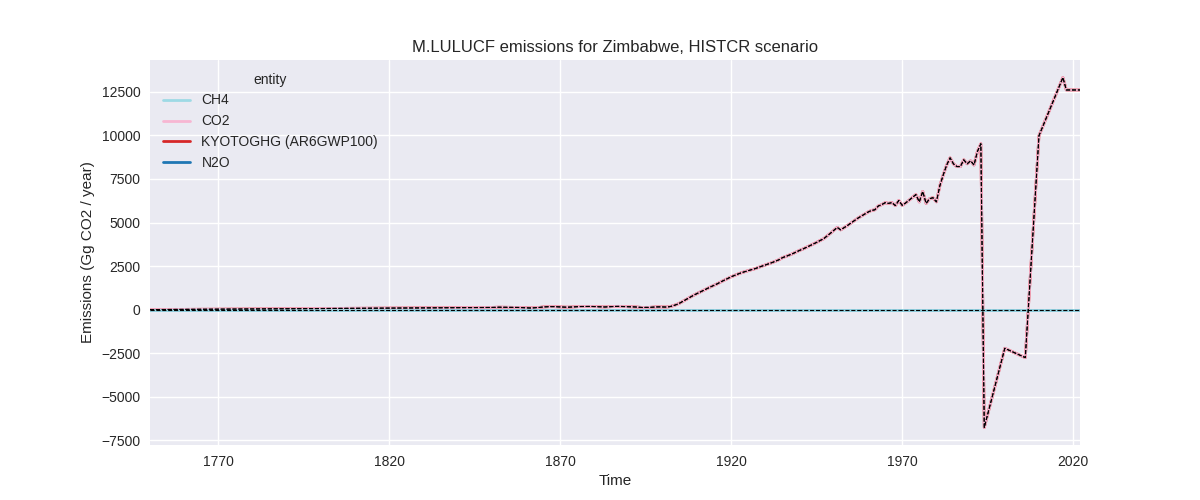
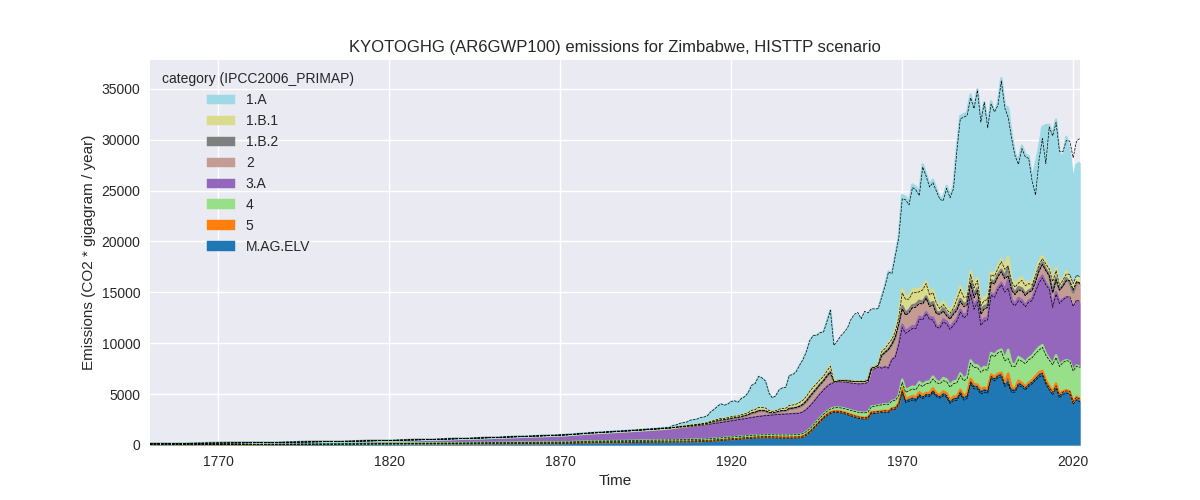
The following figures show the aggregate national total emissions excluding LULUCF AR6GWP100 for the third party priority scenario. The dotted linesshow the v2.5_final data.


Overview over changes
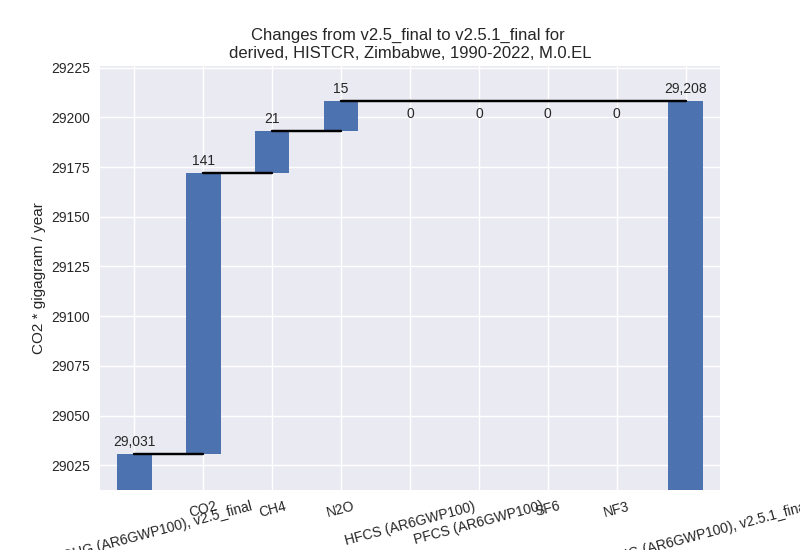
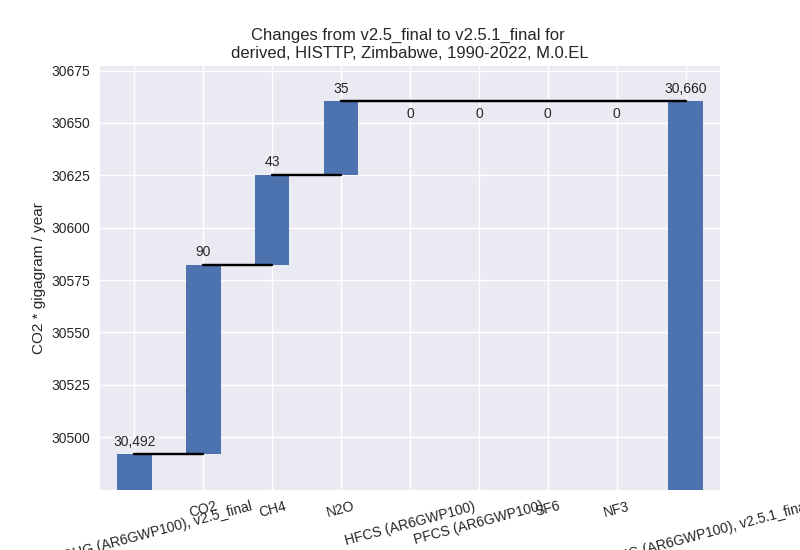
In the country reported priority scenario we have the following changes for aggregate Kyoto GHG and national total emissions excluding LULUCF (M.0.EL):
- Emissions in 2022 have changed by -6.1%% (-1729.38 Gg CO2 / year)
- Emissions in 1990-2022 have changed by 0.6%% (177.53 Gg CO2 / year)
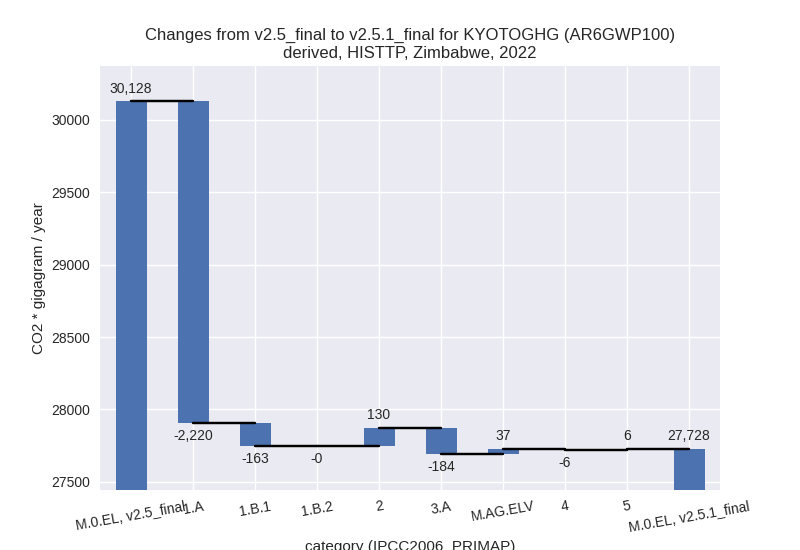
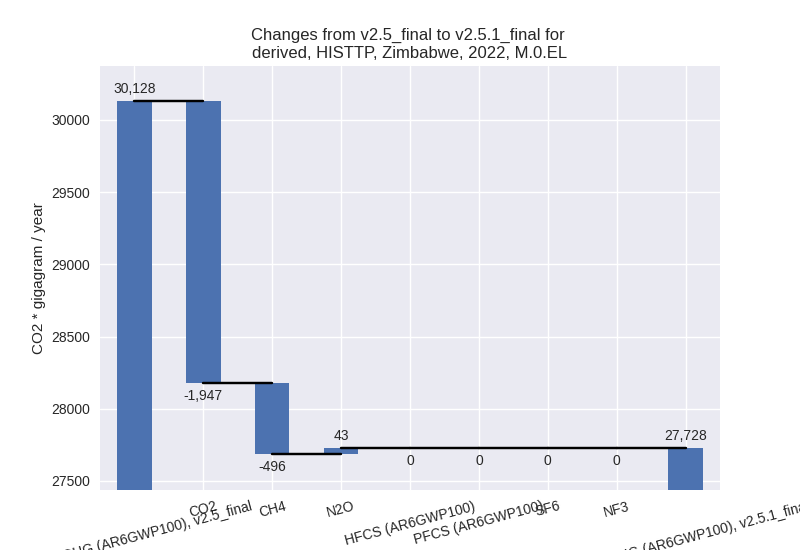
In the third party priority scenario we have the following changes for aggregate Kyoto GHG and national total emissions excluding LULUCF (M.0.EL):
- Emissions in 2022 have changed by -8.0%% (-2399.87 Gg CO2 / year)
- Emissions in 1990-2022 have changed by 0.6%% (168.43 Gg CO2 / year)
Most important changes per scenario and time frame
In the country reported priority scenario the following sector-gas combinations have the highest absolute impact on national total KyotoGHG (AR6GWP100) emissions in 2022 (top 5):
- 1: 1.A, CO2 with -1362.43 Gg CO2 / year (-13.4%)
- 2: M.AG.ELV, CH4 with -552.34 Gg CO2 / year (-26.5%)
- 3: 1.A, CH4 with -471.77 Gg CO2 / year (-9.7%)
- 4: M.AG.ELV, N2O with 303.30 Gg CO2 / year (8.0%)
- 5: 3.A, CH4 with 219.89 Gg CO2 / year (6.0%)
In the country reported priority scenario the following sector-gas combinations have the highest absolute impact on national total KyotoGHG (AR6GWP100) emissions in 1990-2022 (top 5):
- 1: 1.A, CO2 with 119.69 Gg CO2 / year (1.4%)
- 2: M.AG.ELV, CH4 with 40.94 Gg CO2 / year (1.0%)
- 3: M.AG.ELV, N2O with 19.18 Gg CO2 / year (0.3%)
- 4: 2, CO2 with 18.15 Gg CO2 / year (2.9%)
- 5: 1.A, CH4 with -11.75 Gg CO2 / year (-0.4%)
In the third party priority scenario the following sector-gas combinations have the highest absolute impact on national total KyotoGHG (AR6GWP100) emissions in 2022 (top 5):
- 1: 1.A, CO2 with -2181.87 Gg CO2 / year (-20.9%)
- 2: 1.B.1, CH4 with -224.87 Gg CO2 / year (-44.9%)
- 3: 3.A, CH4 with -181.29 Gg CO2 / year (-2.8%)
- 4: 2, CO2 with 121.87 Gg CO2 / year (14.2%)
- 5: M.AG.ELV, CH4 with -77.88 Gg CO2 / year (-16.3%)
In the third party priority scenario the following sector-gas combinations have the highest absolute impact on national total KyotoGHG (AR6GWP100) emissions in 1990-2022 (top 5):
- 1: M.AG.ELV, CO2 with 117.80 Gg CO2 / year (916.1%)
- 2: M.AG.ELV, CH4 with 37.05 Gg CO2 / year (3.1%)
- 3: M.AG.ELV, N2O with 36.82 Gg CO2 / year (0.8%)
- 4: 1.A, CO2 with -35.02 Gg CO2 / year (-0.3%)
- 5: 1.B.1, CH4 with 34.30 Gg CO2 / year (5.7%)
Notes on data changes
Here we list notes explaining important emissions changes for the country. ’' means that the following text only applies to the TP time series, while means that it only applies to the CR scenario. Otherwise the note applies to both scenarios.
- 1.A, CO2: CDIAC 2023 emissions show a continued emissions decrease leading to lower emissions in the last years.
- M.AG.ELV, CH4: Updated FAO and EDGAR data lead to lower 2022 emissions.
- 1.B.1, CH4: EDGAR 8.0 data are higher until 2018 and lower for 2019-2022.
Changes by sector and gas
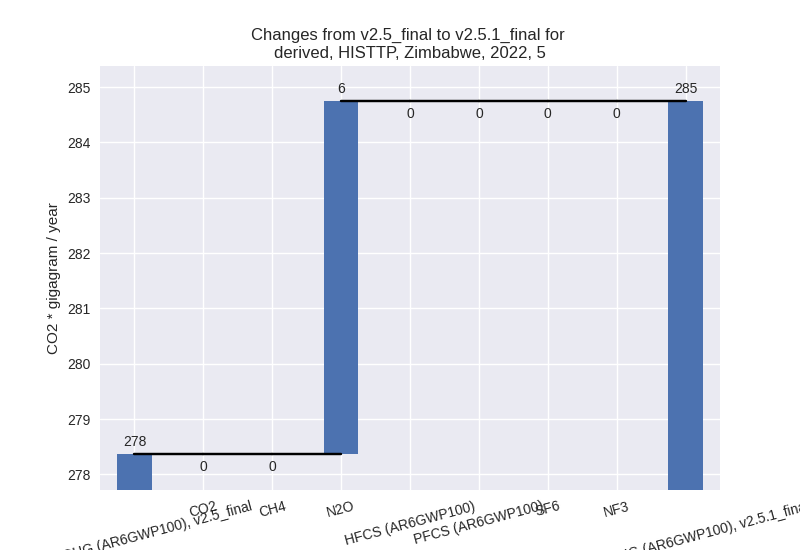
For each scenario and time frame the changes are displayed for all individual sectors and all individual gases. In the sector plot we use aggregate Kyoto GHGs in AR6GWP100. In the gas plot we usenational total emissions without LULUCF. ## country reported scenario
2022


1990-2022

third party scenario
2022
1990-2022

Detailed changes for the scenarios:
country reported scenario (HISTCR):
Most important changes per time frame
For 2022 the following sector-gas combinations have the highest absolute impact on national total KyotoGHG (AR6GWP100) emissions in 2022 (top 5):
- 1: 1.A, CO2 with -1362.43 Gg CO2 / year (-13.4%)
- 2: M.AG.ELV, CH4 with -552.34 Gg CO2 / year (-26.5%)
- 3: 1.A, CH4 with -471.77 Gg CO2 / year (-9.7%)
- 4: M.AG.ELV, N2O with 303.30 Gg CO2 / year (8.0%)
- 5: 3.A, CH4 with 219.89 Gg CO2 / year (6.0%)
For 1990-2022 the following sector-gas combinations have the highest absolute impact on national total KyotoGHG (AR6GWP100) emissions in 1990-2022 (top 5):
- 1: 1.A, CO2 with 119.69 Gg CO2 / year (1.4%)
- 2: M.AG.ELV, CH4 with 40.94 Gg CO2 / year (1.0%)
- 3: M.AG.ELV, N2O with 19.18 Gg CO2 / year (0.3%)
- 4: 2, CO2 with 18.15 Gg CO2 / year (2.9%)
- 5: 1.A, CH4 with -11.75 Gg CO2 / year (-0.4%)
Changes in the main sectors for aggregate KyotoGHG (AR6GWP100) are
- 1: Total sectoral emissions in 2022 are 14074.69 Gg
CO2 / year which is 52.9% of M.0.EL emissions. 2022 Emissions have
changed by -11.8% (-1877.82 Gg CO2 /
year). 1990-2022 Emissions have changed by 0.9% (107.87 Gg CO2 / year). For 2022 the
changes per gas
are:

The changes come from the following subsectors:- 1.A: Total sectoral emissions in 2022 are 13866.91
Gg CO2 / year which is 98.5% of category 1 emissions. 2022 Emissions
have changed by -12.3% (-1939.37 Gg
CO2 / year). 1990-2022 Emissions have changed by 0.9% (103.45 Gg CO2 / year). For 2022 the
changes per gas
are:

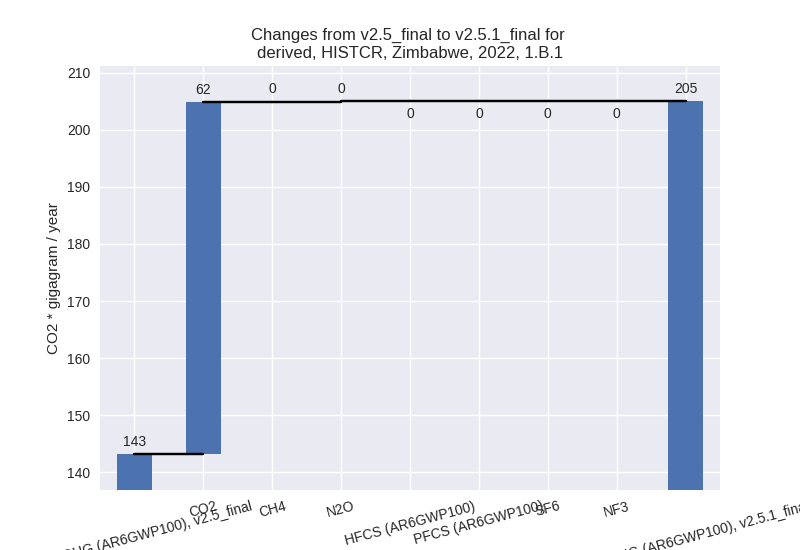
There is no subsector information available in PRIMAP-hist. - 1.B.1: Total sectoral emissions in 2022 are 204.98
Gg CO2 / year which is 1.5% of category 1 emissions. 2022 Emissions have
changed by 43.2% (61.80 Gg CO2 /
year). 1990-2022 Emissions have changed by 1.7% (4.43 Gg CO2 / year). For 2022 the
changes per gas
are:
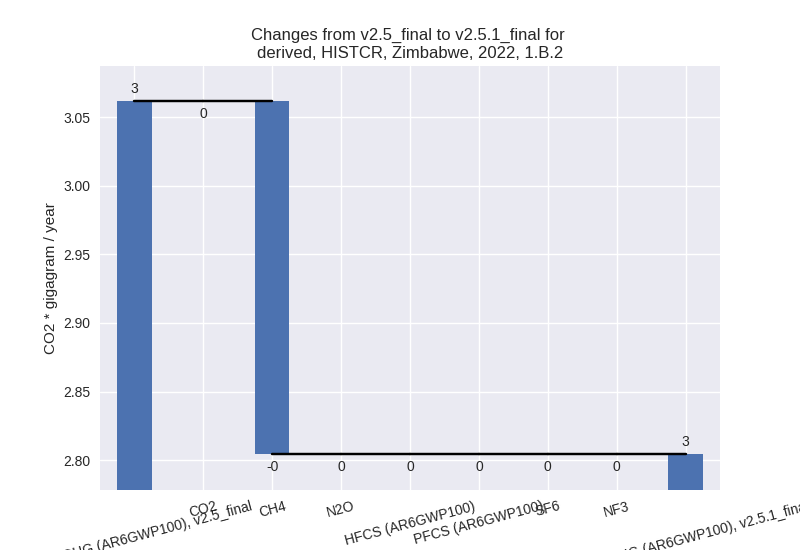
There is no subsector information available in PRIMAP-hist. - 1.B.2: Total sectoral emissions in 2022 are 2.80 Gg
CO2 / year which is 0.0% of category 1 emissions. 2022 Emissions have
changed by -8.4% (-0.26 Gg CO2 /
year). 1990-2022 Emissions have changed by -2.4% (-0.01 Gg CO2 / year). For 2022 the
changes per gas
are:
For 1990-2022 the changes per gas are:
There is no subsector information available in PRIMAP-hist.
- 1.A: Total sectoral emissions in 2022 are 13866.91
Gg CO2 / year which is 98.5% of category 1 emissions. 2022 Emissions
have changed by -12.3% (-1939.37 Gg
CO2 / year). 1990-2022 Emissions have changed by 0.9% (103.45 Gg CO2 / year). For 2022 the
changes per gas
are:
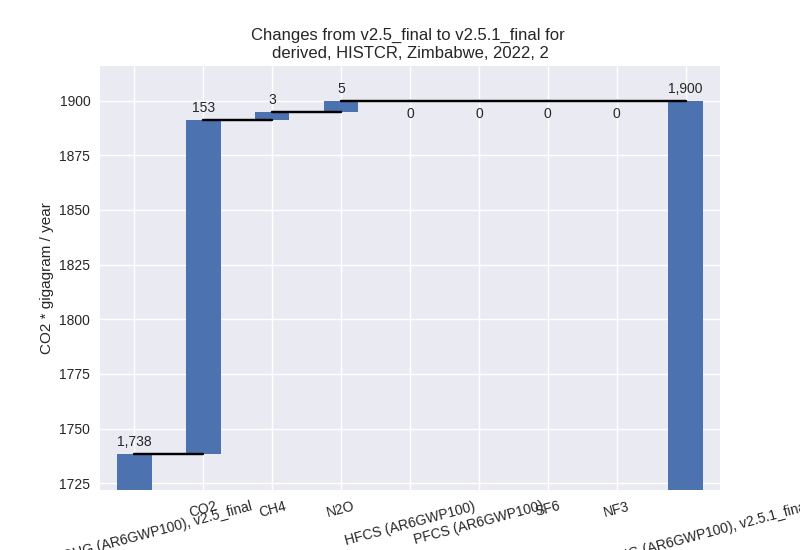
- 2: Total sectoral emissions in 2022 are 1899.70 Gg
CO2 / year which is 7.1% of M.0.EL emissions. 2022 Emissions have
changed by 9.3% (161.45 Gg CO2 /
year). 1990-2022 Emissions have changed by 1.7% (19.19 Gg CO2 / year). For 2022 the
changes per gas
are:
- M.AG: Total sectoral emissions in 2022 are 9585.96 Gg CO2 / year which is 36.0% of M.0.EL emissions. 2022 Emissions have changed by -0.4% (-35.78 Gg CO2 / year). 1990-2022 Emissions have changed by 0.3% (49.78 Gg CO2 / year).
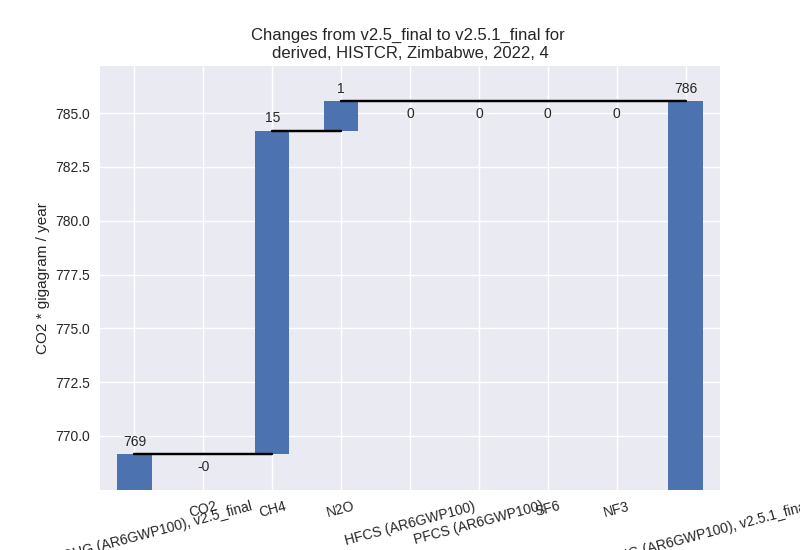
- 4: Total sectoral emissions in 2022 are 785.55 Gg
CO2 / year which is 2.9% of M.0.EL emissions. 2022 Emissions have
changed by 2.1% (16.39 Gg CO2 /
year). 1990-2022 Emissions have changed by 0.1% (0.50 Gg CO2 / year). For 2022 the
changes per gas
are:
- 5: Total sectoral emissions in 2022 are 284.74 Gg
CO2 / year which is 1.1% of M.0.EL emissions. 2022 Emissions have
changed by 2.3% (6.38 Gg CO2 /
year). 1990-2022 Emissions have changed by 0.1% (0.19 Gg CO2 / year). For 2022 the
changes per gas
are:

third party scenario (HISTTP):
Most important changes per time frame
For 2022 the following sector-gas combinations have the highest absolute impact on national total KyotoGHG (AR6GWP100) emissions in 2022 (top 5):
- 1: 1.A, CO2 with -2181.87 Gg CO2 / year (-20.9%)
- 2: 1.B.1, CH4 with -224.87 Gg CO2 / year (-44.9%)
- 3: 3.A, CH4 with -181.29 Gg CO2 / year (-2.8%)
- 4: 2, CO2 with 121.87 Gg CO2 / year (14.2%)
- 5: M.AG.ELV, CH4 with -77.88 Gg CO2 / year (-16.3%)
For 1990-2022 the following sector-gas combinations have the highest absolute impact on national total KyotoGHG (AR6GWP100) emissions in 1990-2022 (top 5):
- 1: M.AG.ELV, CO2 with 117.80 Gg CO2 / year (916.1%)
- 2: M.AG.ELV, CH4 with 37.05 Gg CO2 / year (3.1%)
- 3: M.AG.ELV, N2O with 36.82 Gg CO2 / year (0.8%)
- 4: 1.A, CO2 with -35.02 Gg CO2 / year (-0.3%)
- 5: 1.B.1, CH4 with 34.30 Gg CO2 / year (5.7%)
Changes in the main sectors for aggregate KyotoGHG (AR6GWP100) are
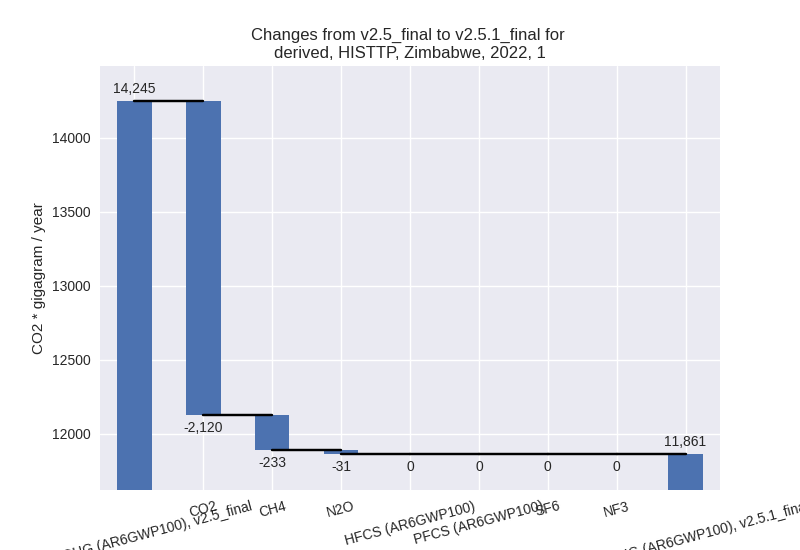
- 1: Total sectoral emissions in 2022 are 11861.22 Gg
CO2 / year which is 42.8% of M.0.EL emissions. 2022 Emissions have
changed by -16.7% (-2383.63 Gg CO2 /
year). 1990-2022 Emissions have changed by 0.0% (1.71 Gg CO2 / year). For 2022 the
changes per gas
are:
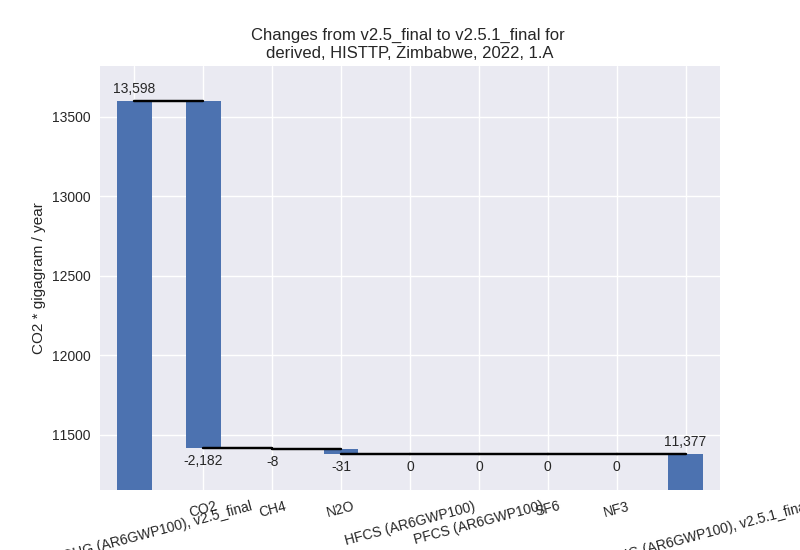
The changes come from the following subsectors:- 1.A: Total sectoral emissions in 2022 are 11377.37
Gg CO2 / year which is 95.9% of category 1 emissions. 2022 Emissions
have changed by -16.3% (-2220.16 Gg
CO2 / year). 1990-2022 Emissions have changed by -0.3% (-37.04 Gg CO2 / year). For 2022 the
changes per gas
are:
There is no subsector information available in PRIMAP-hist. - 1.B.1: Total sectoral emissions in 2022 are 481.05
Gg CO2 / year which is 4.1% of category 1 emissions. 2022 Emissions have
changed by -25.3% (-163.22 Gg CO2 /
year). 1990-2022 Emissions have changed by 5.1% (38.76 Gg CO2 / year). For 2022 the
changes per gas
are:

For 1990-2022 the changes per gas are: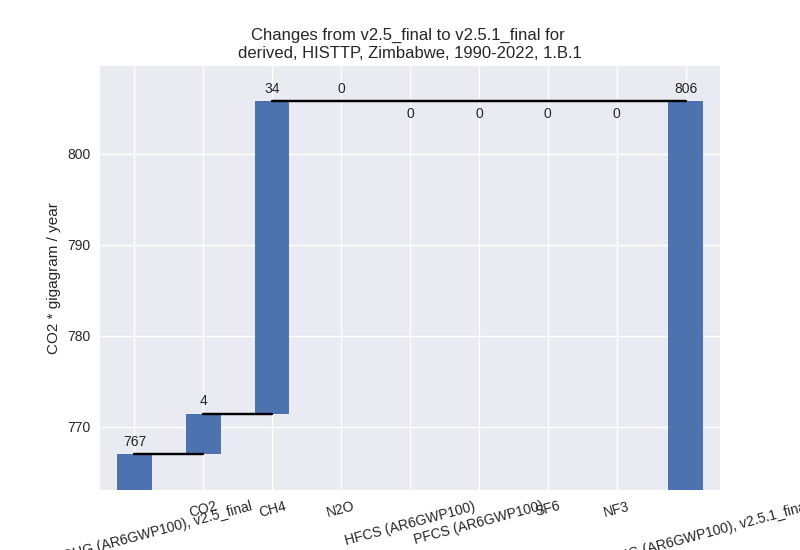
There is no subsector information available in PRIMAP-hist. - 1.B.2: Total sectoral emissions in 2022 are 2.80 Gg
CO2 / year which is 0.0% of category 1 emissions. 2022 Emissions have
changed by -8.4% (-0.26 Gg CO2 /
year). 1990-2022 Emissions have changed by -2.4% (-0.01 Gg CO2 / year). For 2022 the
changes per gas
are:

For 1990-2022 the changes per gas are:
There is no subsector information available in PRIMAP-hist.
- 1.A: Total sectoral emissions in 2022 are 11377.37
Gg CO2 / year which is 95.9% of category 1 emissions. 2022 Emissions
have changed by -16.3% (-2220.16 Gg
CO2 / year). 1990-2022 Emissions have changed by -0.3% (-37.04 Gg CO2 / year). For 2022 the
changes per gas
are:
- 2: Total sectoral emissions in 2022 are 1916.34 Gg
CO2 / year which is 6.9% of M.0.EL emissions. 2022 Emissions have
changed by 7.3% (130.46 Gg CO2 /
year). 1990-2022 Emissions have changed by 0.3% (4.27 Gg CO2 / year). For 2022 the
changes per gas
are:

- M.AG: Total sectoral emissions in 2022 are 10541.97 Gg CO2 / year which is 38.0% of M.0.EL emissions. 2022 Emissions have changed by -1.4% (-147.17 Gg CO2 / year). 1990-2022 Emissions have changed by 1.4% (162.45 Gg CO2 / year).
- 4: Total sectoral emissions in 2022 are 3124.11 Gg CO2 / year which is 11.3% of M.0.EL emissions. 2022 Emissions have changed by -0.2% (-5.90 Gg CO2 / year). 1990-2022 Emissions have changed by -0.0% (-0.18 Gg CO2 / year).
- 5: Total sectoral emissions in 2022 are 284.74 Gg
CO2 / year which is 1.0% of M.0.EL emissions. 2022 Emissions have
changed by 2.3% (6.38 Gg CO2 /
year). 1990-2022 Emissions have changed by 0.1% (0.19 Gg CO2 / year). For 2022 the
changes per gas
are: